Viral Hepatitis
- Key findings
- Has there been a change in the prevalence of HAV antibody among the U.S. born population?
- Are there differences in HAV antibody prevalence by race/ethnicity and were they consistent over time?
- Has the prevalence of HBV infection changed over time?
- Did HBV infection vary by race/ethnicity, sex or place of birth, and how did prevalence change over time in these population subgroups?
- What percentage of the population aged 6-19 years reported vaccination with the HBV vaccine?
- Did HCV infection vary by race/ethnicity or sex, and how did prevalence change over time in these population subgroups?
- Did the prevalence of HCV infection by age group change over time?
- Summary
- Limitations
- Definitions
- Data source and methods
- About the authors
- References
- Suggested citation
NCHS Data Brief No. 27, March 2010
PDF Version (596 KB)
Geraldine M. McQuillan, Ph.D; Deanna Kruszon-Moran, M.S.; Maxine M. Denniston, M.S.P.H.; and Rosemarie Hirsch, M.D., M.P.H.
Key findings.
- The prevalence of hepatitis A antibody, which is indicative of immunity to hepatitis A virus, increased among U.S. born persons aged 6-19, but decreased among persons aged 40 years and over.
- Hepatitis B virus (HBV) infection among persons aged 6-19 has decreased in recent years. By 2003-2006, over 90% of children had received at least one dose of the recommended three-dose series of hepatitis B vaccine.
- Prevalence of infection with hepatitis C virus (HCV) decreased among those at highest risk of infection including males and Mexican- American and non-Hispanic black populations. Despite this decrease, the prevalence of infection remains higher in the non-Hispanic black population. The peak prevalence of HCV infection has shifted over time from persons aged 30-39 years (3.9%) to those aged 40-49 years (4.3%).
Viral hepatitis is a disease of major public health significance in the United States with most infection caused by three viruses, hepatitis A virus (HAV), hepatitis B virus (HBV), and hepatitis C virus (HCV) (1). Although unrelated, they share a similar symptomatology (2). HBV and HCV can produce chronic infection that is associated with chronic liver disease and liver cancer. Because 70-85% of those acutely infected with HCV become chronically infected, HCV is the most common chronic bloodborne infection in the United States (3).
The vaccine for HAV has been recommended for travelers since 1995; children and others at risk since 2006 (4). The vaccine for HBV has been recommended for infants, older children and adolescents not previously vaccinated since 1991, and adults at risk since the early 1980s (5,6). No vaccine currently exists for HCV. Effective antiviral treatments are available for HBV infection to halt progressive liver damage (7) and for hepatitis C to achieve “sustained virologic response” (i.e., virologic cure).
Keywords: hepatitis, liver disease, National Health and Nutrition Examination Survey
Has there been a change in the prevalence of HAV antibody among the U.S. born population?
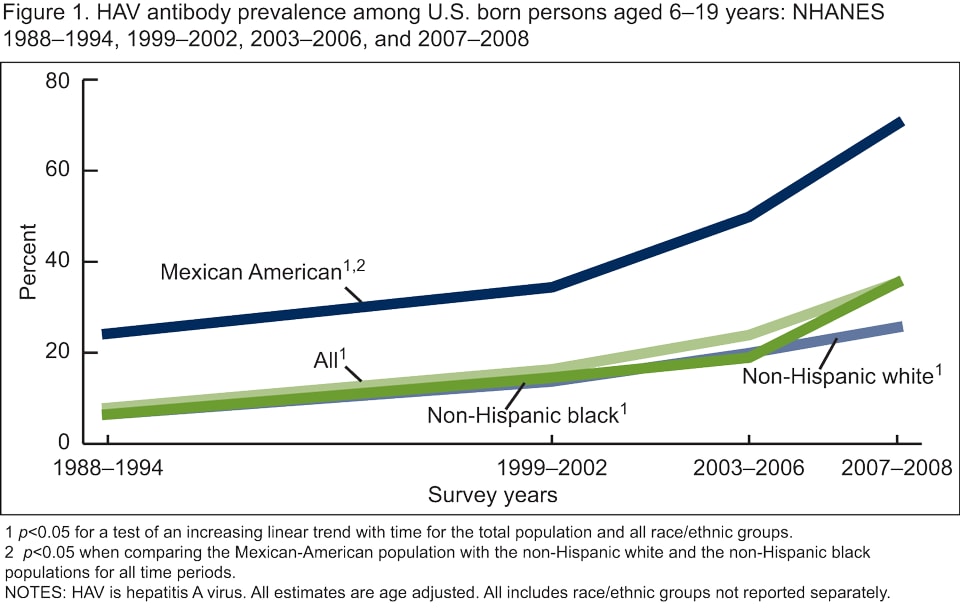
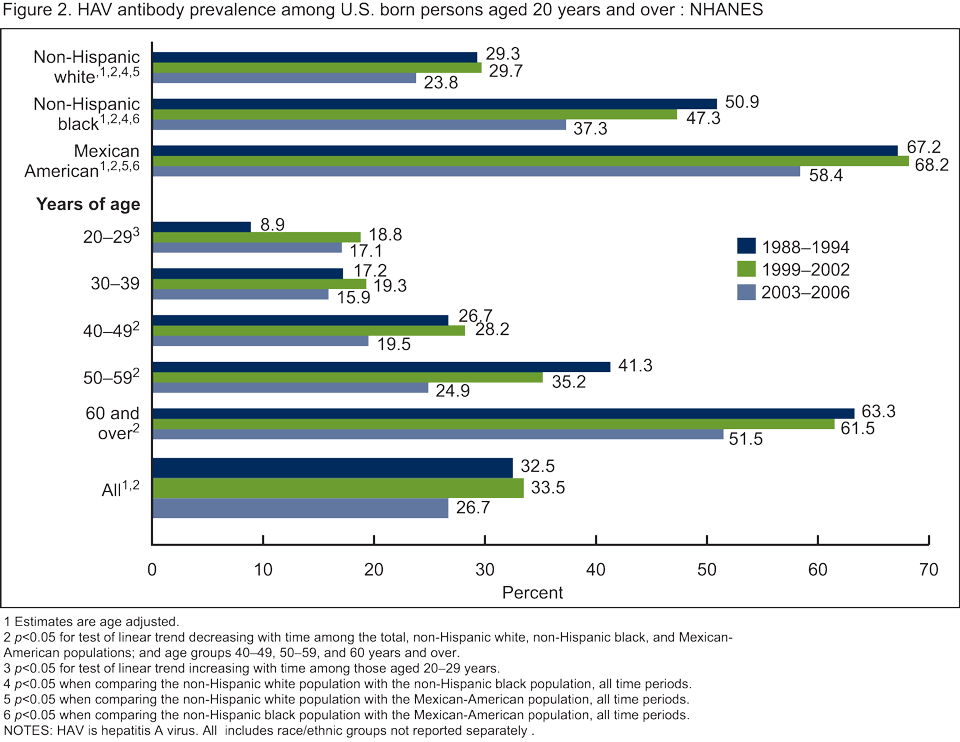
The prevalence of HAV antibody among persons aged 6-19 years increased steadily over the four time periods from 8.0% in 1988-1994 to 35.3% in 2007-2008 (Figure 1). Among persons aged 20-29 years, the prevalence of HAV antibody increased overall from 8.9% in 1988-1994 to 17.1 in 2003-2006 (Figure 2), HAV antibody was not measured among persons aged 19 years and over in 2007-2008). There was no change over time in HAV antibody among persons aged 30-39 years. Among adults aged 40 years and over, there was a decline in the HAV antibody prevalence from 1988-1994 to 2003-2006.
Are there differences in HAV antibody prevalence by race/ethnicity and were they consistent over time?
For all time periods, the Mexican-American population had a significantly higher prevalence of HAV antibody compared with the non-Hispanic white and non-Hispanic black populations among both children aged 6-19 years (Figure 1) and adults aged 20 years and over (Figure 2).
Has the prevalence of HBV infection changed over time?
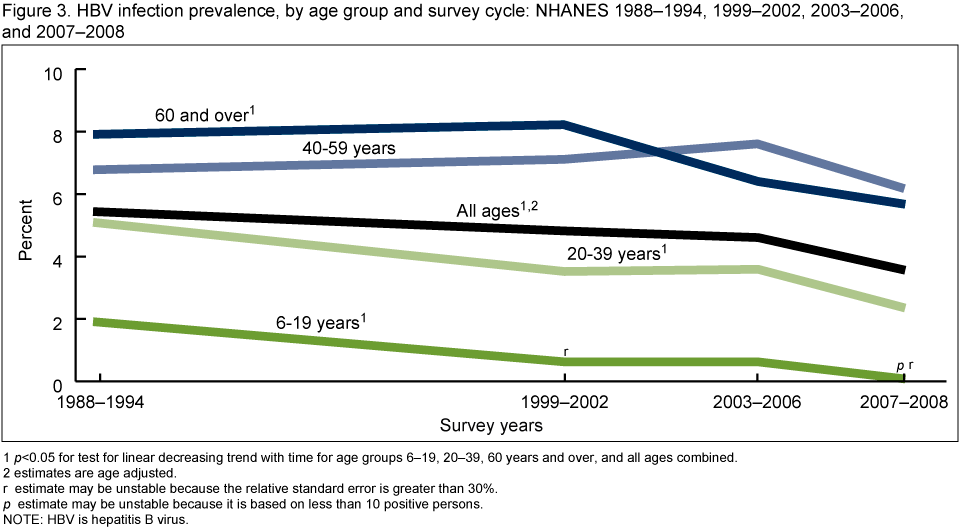
The overall prevalence of HBV infection among persons of all ages decreased from 1988-1994 to 2007-2008 (Figure 3). The decrease in the prevalence of HBV infection from 1988-1994 to 2007-2008 was significant for all age groups except for persons aged 40-59 years.
Did HBV infection vary by race/ethnicity, sex or place of birth, and how did prevalence change over time in these population subgroups?
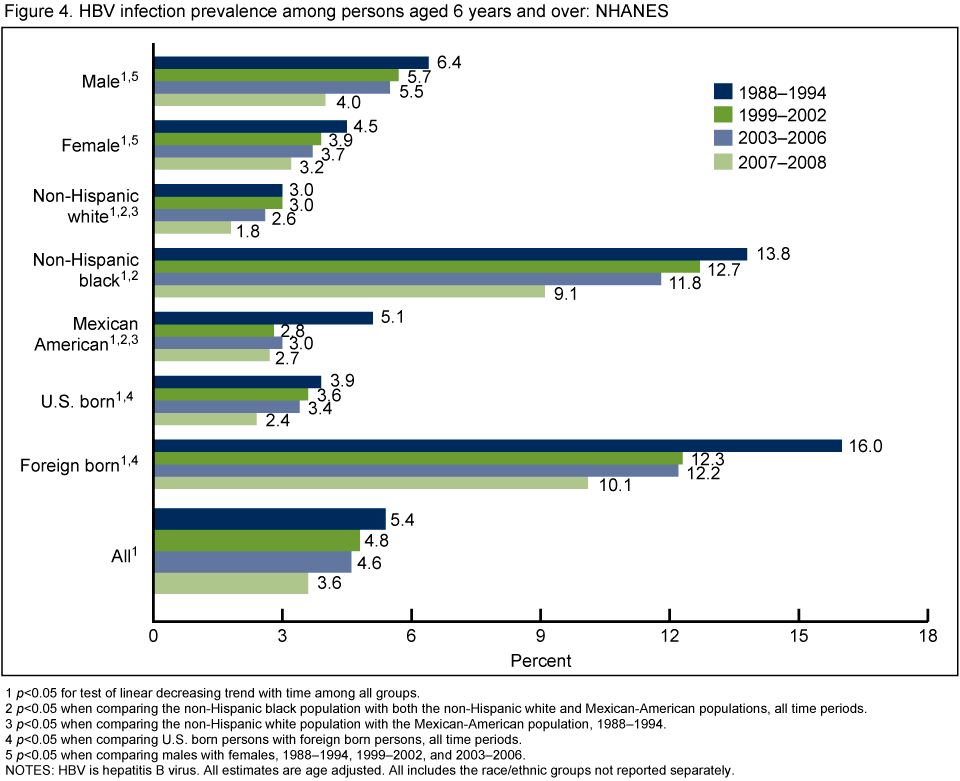
For all four time periods, the non-Hispanic black population had a higher prevalence of HBV infection compared with the non-Hispanic white and Mexican-American populations. Persons born outside the United States had a higher prevalence of infection compared with those that were U.S. born (Figure 4). For the three time periods from 1988-2006, males also had higher prevalence of infection than females. HBV infection prevalence decreased from 1988-1994 to 2007-2008 for all racial/ethnic and demographic groups.
What percentage of the population aged 6-19 years reported vaccination with the HBV vaccine?
HBV vaccination (at least one dose) was reported for 73% of the population in 1999-2002. This increased to 90% and 91% in 2003-2006 and 2007-2008, respectively (data not shown).
Did HCV infection vary by race/ethnicity or sex, and how did prevalence change over time in these population subgroups?
The overall prevalence of HCV infection decreased from 1988-1994 to 2007-2008 (Figure 5). The non-Hispanic black population had significantly greater prevalence of HCV infection compared with both the non-Hispanic white and Mexican-American populations across all survey cycles from 1988-2008. Among three subgroups,
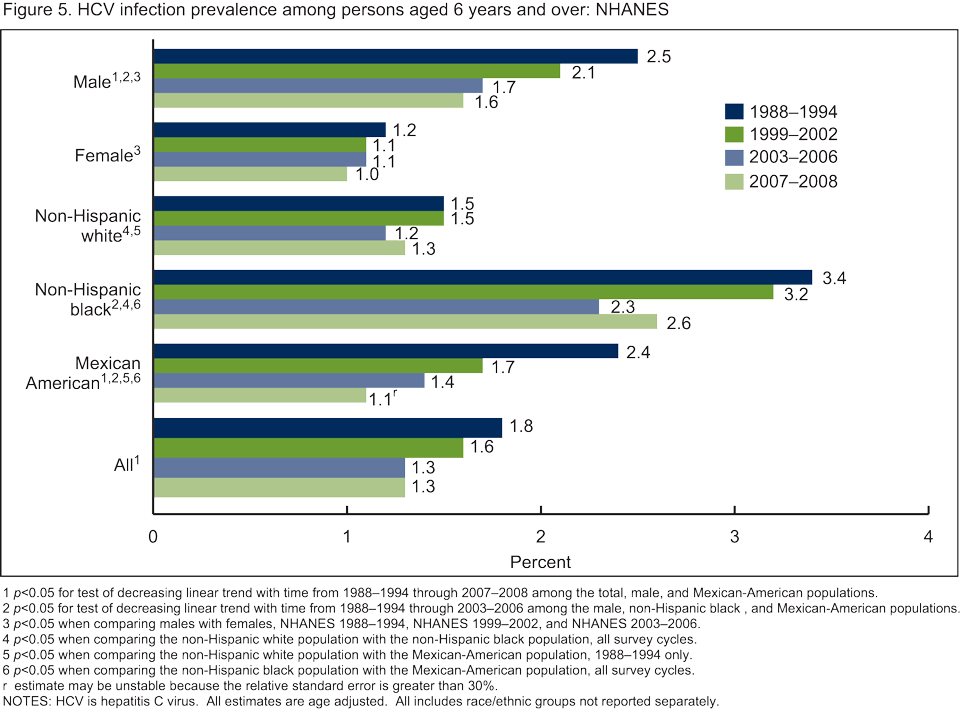
non-Hispanic black and Mexican-American persons and males, decreases in prevalence of HCV infection were observed from 1988-1994 to 2003-2006. Among Mexican-American persons and males decreases were observed from 1988-1994 to 2007-2008. In contrast, there was no change over time in prevalence among non-Hispanic white persons or among females.
Did the prevalence of HCV infection by age group change over time?
For 1988-1994, persons aged 30-39 years had the highest prevalence of HCV infection (3.9%) (Figure 6). By 1999-2002, the peak of infection had shifted to persons aged 40-49 years (4.3%). Peak infection remained among persons aged 40-49 years in 2003-2006 and 2007-2008.

Summary
There was a significant increase in the prevalence of HAV antibody among U.S. born persons aged 6-19 years from 1988-1994 to 2007-2008 most likely reflecting increasing HAV immunization of children and others. Among U.S. born adults (aged 40 years and over), HAV antibody prevalence decreased from 1988-1994 and 2003-2006. This may reflect lower rates of infection due to reduced exposure to the virus, resulting from higher rates of immunization among the younger age groups. Surveillance data also have recently demonstrated a decrease in incidence over the past 50 years to historic lows with the release of the HAV vaccine and changes in vaccination policy (4,8).
The significantly higher prevalence of HAV antibody among U.S. born Mexican-American children and adults may reflect not only higher rates of vaccination within this subgroup, but also continued greater exposure to natural infection from travel to or visitors from Mexico where the disease is endemic.
There was a significant decrease from 1988-1994 to 2007-2008 for the total population and for most age groups (6-19, 20-39, and 60 years and over) including the youngest age groups that were targeted for vaccination. Disparities continued with significantly higher HBV infection prevalence among non-Hispanic black persons, males, and foreign born persons for most time periods. Reported vaccination coverage among persons aged 6-19 years was over 70% by 1999-2002 and increased to over 90% by 2003-2006.
Overall prevalence of HCV decreased from 1988-1994 to 2003-2006, but remained constant from 2003-2006 to 2007-2008. The decreases in HCV prevalence were observed among the subgroups at highest risk, which suggest a positive impact of prevention efforts (9). Despite these apparent gains, rates remained high among non-Hispanic black persons compared with other race/ethnicity populations. The peak in age-specific prevalence shifted from aged 30-39 years in 1988-1994 to aged 40-49 years by 1999-2002 and continued through 2007-2008. This shift in peak age group suggests younger cohorts in the later time periods are not being infected at the same rate as those in earlier time periods.
Limitations
National Health and Nutrition Examination Surveys (NHANES) do not include groups that may be considered at higher risk for hepatitis infection (i.e., those institutionalized, incarcerated, those in nonhospital based long-term care facilities, injection drug using homeless populations, etc.). Therefore, these data provide conservative estimates of disease prevalence.
Prevalence of HAV antibody: Presence of HAV antibody reflects immunity due to vaccination or due to natural infection transmitted by close personal contact or ingestion of fecal contaminated food or drink. All analyses for HAV are restricted to those U.S. born because prevalence of HAV antibody is much higher among those not born in the U.S., possibly reflecting infection early in life prior to immigration.
Prevalence of HBV infection: Presence of HBV core antibody, a measure of lifetime infection transmitted through sexual contact, sharing contaminated needles, or from an infected mother to her newborn. HBV core antibody alone does not distinguish between history of infection and chronic active infection.
Prevalence of HCV infection: Presence of antibody to HCV, a measure of lifetime infection transmitted by contact with the blood of an infected person primarily through sharing contaminated needles.
Data source and methods
NHANES data were used for these analyses. NHANES is a cross-sectional survey designed to monitor the health and nutritional status of the civilian, noninstitutionalized U.S. population (10). The survey consists of interviews conducted in participant’s homes, standardized physical examinations conducted in specially outfitted mobile examination centers, and laboratory tests utilizing blood provided by participants during the physical examination.
The NHANES sample design is a complex, multistage design that includes oversampling in order to obtain reliable estimates of health and nutritional measures for population subgroups. In NHANES III conducted from 1988 to 1994, children under age 5 years, persons aged 60 years and over, Mexican-American persons and non-Hispanic black persons were oversampled. In 1999-2006, non-Hispanic black persons, Mexican-American persons, persons with low-income, persons aged 12-19 years, and persons aged 60 years and over were oversampled. In 2007-2008, adolescents were no longer oversampled. In 1999, NHANES became a continuous survey, fielded on an ongoing basis. Public use data files are released in 2-year cycles.
Sample weights, which account for the differential probabilities of selection, nonresponse and noncoverage, are incorporated into the estimation process. Standard errors of the estimates were calculated and tests of significance were conducted incorporating the sample weights and sample design (11). Prevalence estimates were age adjusted by the direct method to the projected 2000 U.S. Census population for comparisons across population subgroups and between surveys (12). Tests for linear trends with time were examined using orthogonal contrast matrices (13). All data analyses were performed using SAS System for Windows (release 9.2; SAS Institute Inc, Cary N.C.) and SUDAAN (release 10.0; Research Triangle Institute, Research Triangle Park, N.C.).
Serum samples for persons aged 6 years and over (aged 6-19 years only for HAV testing in NHANES 2007-2008) were sent to the Division of Viral Hepatitis, National Center for HIV/AIDS, Viral Hepatitis, STD, and TB Prevention, Centers for Disease Control and Prevention for HAV, HBV, and HCV antibody testing.
About the authors
Geraldine McQuillan, Deanna Kruszon-Moran, and Rosemarie Hirsch are with the Centers for Disease Control and Prevention’s National Center for Health Statistics, Division of Health and Nutrition Examination Surveys. Maxine Denniston is with the Centers for Disease Control and Prevention’s National Center for HIV/AIDS, Viral Hepatitis, STD, and TB Prevention, Division of Viral Hepatitis.
References
- Tolsma DD, Bryan JA. The economic impact of viral hepatitis in the United States. Public Health Reports; 91:349-53. 1976.
- McMahon BJ, Alward WL, Hall DB et Al. Acute hepatitis B infection: relation of age to the clinical expression of disease and subsequent development of the carrier state. J Infect Dis; 151:599-603. 1985.
- Armstrong GM, Wasley A, Simard EP et al. The prevalence of hepatitis C virus infection in the United States 1999 through 2002. Ann Inter Med; 144:705-14. 2006.
- CDC. Prevention of hepatitis A through active or passive immunization. Recommendations of the Advisory Committee on Immunization Practices (ACIP). MMWR; 55 (RR-7):1-23. 2006.
- CDC, A comprehensive immunization strategy to eliminate transmission of hepatitis B virus infection in the United States. Recommendations of the Advisory Committee on Immunization Practices (ACIP). Part II: immunization of adults. MMWR; 55:1-33. 2006.
- CDC, A comprehensive immunization strategy to eliminate transmission of hepatitis B virus infection in the United States. Recommendations of the Advisory Committee on Immunization Practices (ACIP). Part I: immunization of infants, children and adolescents. MMWR; 54:1-33. 2005.
- Pramoolsinsup C. Management of viral hepatitis B. J. Gastroenterol Hepatol; 17 Suppl:S125-45. 2002.
- Daniels D, Grytdal S, Wasley A. CDC. Surveillance for acute viral hepatitis—United States, 2007. MMWR Surv Summ; 58 (No. SS-3):1-27. 2009.
- Brady JE, Friedman SR, Cooper HL, et al. Estimating the prevalence of injection drug users in the U.S. and in large U.S. metropolitan areas from 1992 to 2002. J Urban Health; 85(3):323-51. 2008.
- Centers for Disease Control and Prevention. National Center for Health Statistics. National Health and Nutrition Examination Survey.
- Centers for Disease Control and Prevention. National Center for Health Statistics. National Health and Nutrition Examination Surveys Analytic Guidelines.
- Klein RJ, Schoenborn CA. Age adjustment using the 2000 projected U.S. population. Healthy People Statistical Notes, no. 20. Hyattsville, MD: National Center for Health Statistics. 2001.
- Winer BJ. Statistical principles in experimental design. New York, NY:McGraw-Hill Companies; 878 (Table C.10). 1971.
Suggested citation
McQuillan GM, Kruszon-Moran D, Denniston MM, Hirsch R. Viral hepatitis. NCHS data brief, no 27. Hyattsville, MD: National Center for Health Statistics. 2010.
Copyright information
All material appearing in this report is in the public domain and may be reproduced or copied without permission; citation as to source, however, is appreciated.
National Center for Health Statistics
Edward J. Sondik, Ph.D., Director
Jennifer H. Madans, Ph.D., Associate Director for Science
Division of Health Care Statistics
Clifford L. Johnson, M.S.P.H., Director