Viral Hepatitis Among Non-Hispanic Asian Adults in the United States, 2011–2014
- Key findings
- Does prevalence of antibody to hepatitis A virus among non-Hispanic Asian adults differ from other race and Hispanic groups, and does it vary by birth place?
- Does prevalence of hepatitis B virus infection (past or current) among non-Hispanic Asian adults differ from other race and Hispanic groups, and does it vary by birth place?
- Does prevalence of current hepatitis B virus infection among non-Hispanic Asian adults differ from other race and Hispanic groups, and does it vary by birth place?
- Does prevalence of current hepatitis C virus infection among non-Hispanic Asian adults differ from other race and Hispanic groups?
- Summary
- Definitions
- Data source and methods
- About the authors
- References
- Suggested citation
NCHS Data Brief No. 225, November 2015
PDF Version (689 KB)
Deanna Kruszon-Moran, M.S.; Ryne Paulose-Ram, Ph.D.; Maxine Denniston, M.S.P.H.; and Geraldine McQuillan, Ph.D.
Key findings
Data from the National Health and Nutrition Examination Survey
- Prevalence of antibody to hepatitis A virus (HAV) from infection or vaccination was higher among non-Hispanic Asian adults than non-Hispanic white and non-Hispanic black adults.
- Prevalence of both past or current hepatitis B virus (HBV) infection as well as just current active HBV infection was higher among non-Hispanic Asian adults than non-Hispanic white, non-Hispanic black, and Hispanic adults.
- Prevalence of current hepatitis C virus infection among non-Hispanic Asian adults was lower than the other race and Hispanic groups.
- Prevalence of antibody to HAV from infection or vaccination was greater among non-Hispanic Asian adults born outside the United States than those who were U.S.-born. A similar pattern was seen for past or current HBV infection.
Hepatitis A (HAV), B (HBV), and C (HCV) viruses are common types of viral hepatitis. HBV and HCV infection can lead to liver disease, cancer, and serious health consequences. HAV and HBV infections are high among Asian persons, especially those born outside the United States (1–3). This report provides 2011–2014 National Health and Nutrition Examination Survey (NHANES) estimates on prevalence of antibody to HAV (from infection or immunization), past or current HBV infection, and current HCV infection, by race and Hispanic origin.
Keywords: HAV, HBV, HCV, NHANES
Does prevalence of antibody to hepatitis A virus among non-Hispanic Asian adults differ from other race and Hispanic groups, and does it vary by birth place?
During 2011–2014, the prevalence of antibody to HAV, which may be due to natural infection or immunization, was 36.5% among U.S. adults aged 18 and over (Figure 1). Among non-Hispanic Asian adults, the prevalence of antibody to HAV was 70.9%, which was higher than among non-Hispanic white (25.4%) and non-Hispanic black (38.0%) adults but was similar to Hispanic (73.1%) adults.
When examining birth place among non-Hispanic Asian adults, the prevalence of antibody to HAV was higher among those born outside the United States (76.6%) than among those who were U.S.-born (41.3%).
Figure 1. Prevalence of antibody to hepatitis A virus among adults aged 18 and over, by race and Hispanic origin, and by birth place for non-Hispanic Asian adults, 2011–2014
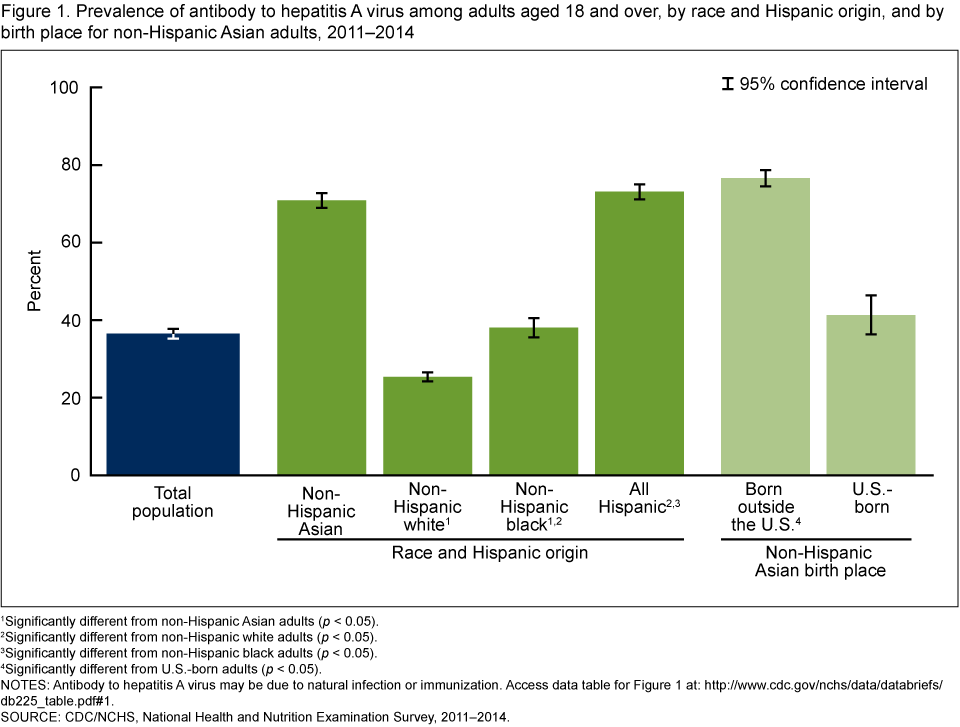
1Significantly different from non-Hispanic Asian adults (p < 0.05).
2Significantly different from non-Hispanic white adults (p < 0.05).
3Significantly different from non-Hispanic black adults (p < 0.05).
4Significantly different from U.S.-born adults (p < 0.05).
NOTES: Antibody to hepatitis A virus may be due to natural infection or immunization. Access data table for Figure 1.
SOURCE: CDC/NCHS, National Health and Nutrition Examination Survey, 2011–2014.
Does prevalence of hepatitis B virus infection (past or current) among non-Hispanic Asian adults differ from other race and Hispanic groups, and does it vary by birth place?
During 2011–2014, the prevalence of HBV infection (past or current) was 4.7% among U.S. adults aged 18 and over (Figure 2). Among non-Hispanic Asian adults, the prevalence was 22.6%, which was higher than among non-Hispanic white (2.6%), non-Hispanic black (10.2%), and Hispanic (3.6%) adults.
More than one-quarter (26.5%) of non-Hispanic Asian adults born outside the United States had HBV infection. This percentage was higher than among non-Hispanic Asian adults who were U.S.-born (2.7%) (Figure 2).
Figure 2. Prevalence of hepatitis B virus infection (past or current) among adults aged 18 and over, by race and Hispanic origin, and by birth place for non-Hispanic Asian adults, 2011–2014
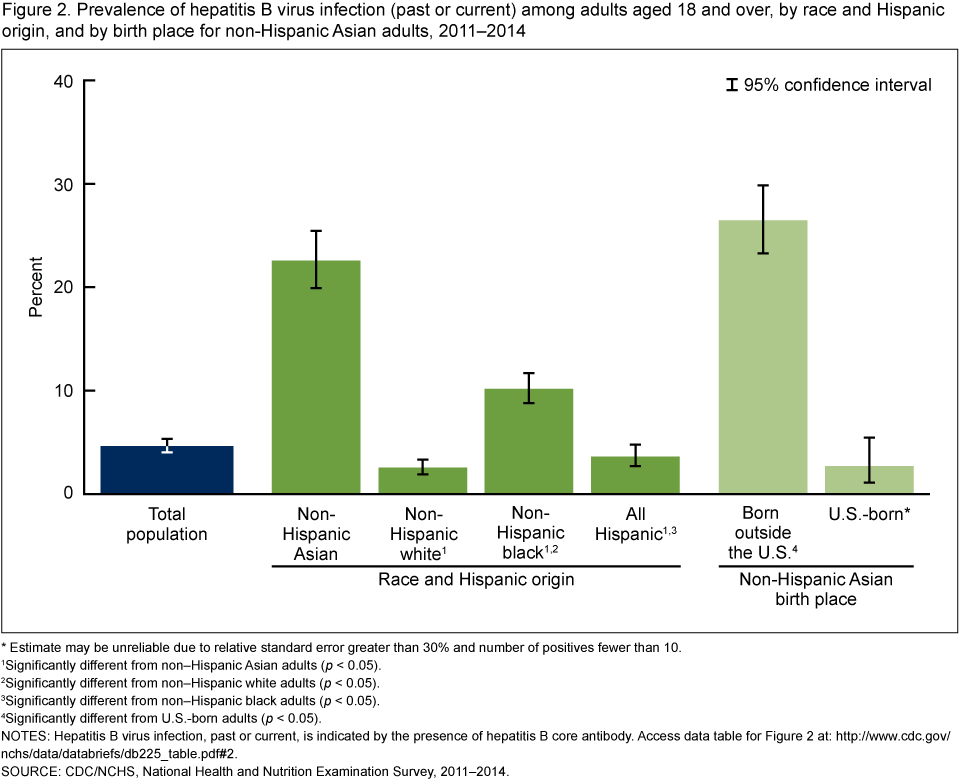
* Estimate may be unreliable due to relative standard error greater than 30% and number of positives fewer than 10.
1Significantly different from non–Hispanic Asian adults (p < 0.05).
2Significantly different from non–Hispanic white adults (p < 0.05).
3Significantly different from non–Hispanic black adults (p < 0.05).
4Significantly different from U.S.-born adults (p < 0.05).
NOTES: Hepatitis B virus infection, past or current, is indicated by the presence of hepatitis B core antibody. Access data table for Figure 2.
SOURCE: CDC/NCHS, National Health and Nutrition Examination Survey, 2011–2014.
Does prevalence of current hepatitis B virus infection among non-Hispanic Asian adults differ from other race and Hispanic groups, and does it vary by birth place?
During 2011–2014, the prevalence of current active HBV infection was 0.4% among U.S. adults aged 18 and over (Figure 3). Among non-Hispanic Asian adults, the prevalence was 3.3%, which was higher than among non-Hispanic black (0.8%), non-Hispanic white (0.2%), and Hispanic (0.2%) adults.
The prevalence of current HBV infection was 3.7% among non-Hispanic Asian adults born outside the United States. This percentage was higher than among non-Hispanic Asian adults who were U.S.-born (1.1%) (Figure 3).
Figure 3. Prevalence of current hepatitis B virus infection among adults aged 18 and over, by race and Hispanic origin, and by birth place for non-Hispanic Asian adults, 2011–2014
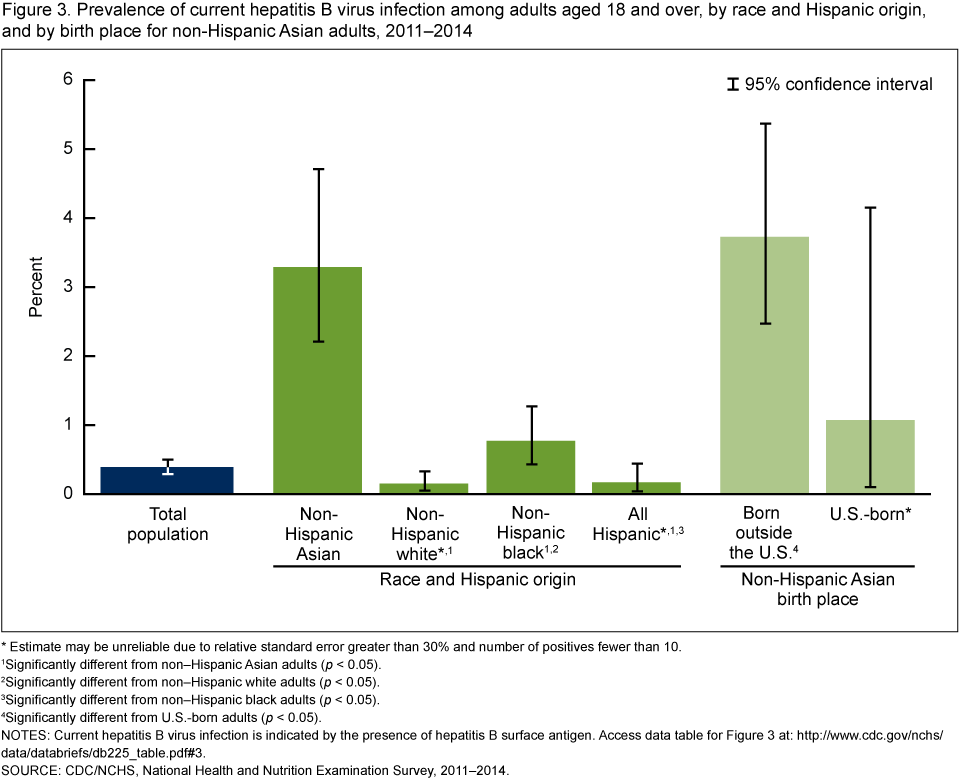
* Estimate may be unreliable due to relative standard error greater than 30% and number of positives fewer than 10.
1Significantly different from non–Hispanic Asian adults (p < 0.05).
2Significantly different from non–Hispanic white adults (p < 0.05).
3Significantly different from non–Hispanic black adults (p < 0.05).
4Significantly different from U.S.-born adults (p < 0.05).
NOTES: Current hepatitis B virus infection is indicated by the presence of hepatitis B surface antigen. Access data table for Figure 3.
SOURCE: CDC/NCHS, National Health and Nutrition Examination Survey, 2011–2014.
Does prevalence of current hepatitis C virus infection among non-Hispanic Asian adults differ from other race and Hispanic groups?
During 2011–2014, the prevalence of current HCV infection among U.S. adults aged 18 and over was 0.9% (Figure 4). Among non-Hispanic Asian adults, the prevalence was 0.2%, which was lower than among non-Hispanic white (0.8%), non-Hispanic black (1.9%), and Hispanic (0.8%) adults.
Due to the low prevalence of current HCV infection among non-Hispanic Asian adults and an extremely small number of cases, estimates could not be presented by place of birth.
Figure 4. Prevalence of current hepatitis C virus infection among adults aged 18 and over, by race and Hispanic origin, 2011–2014
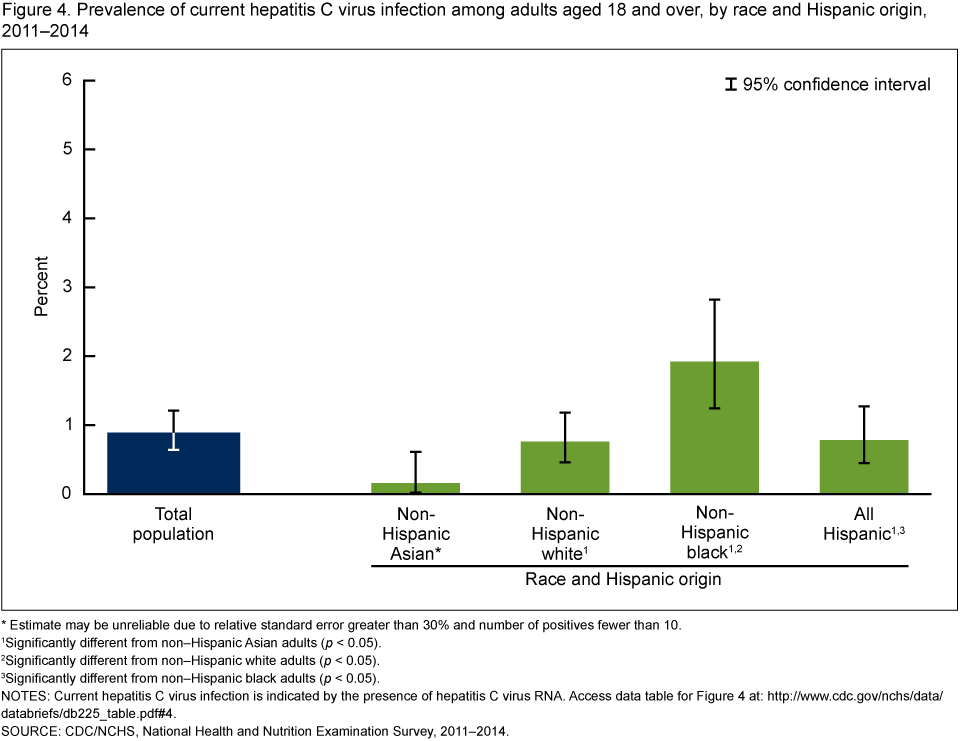
* Estimate may be unreliable due to relative standard error greater than 30% and number of positives fewer than 10.
1Significantly different from non–Hispanic Asian adults (p < 0.05).
2Significantly different from non–Hispanic white adults (p < 0.05).
3Significantly different from non–Hispanic black adults (p < 0.05).
NOTES: Current hepatitis C virus infection is indicated by the presence of hepatitis C virus RNA. Access data table for Figure 4.
SOURCE: CDC/NCHS, National Health and Nutrition Examination Survey, 2011–2014.
Summary
Prevalence of antibody to HAV, a marker for both immunization and natural infection, was higher among both non-Hispanic Asian (70.9%) and Hispanic (73.1%) adults compared with non-Hispanic white (25.4%) and non-Hispanic black (38.0%) adults. HAV infection is spread through fecal–oral contamination resulting from unhygienic living conditions and is more prevalent in both Latin and Asian countries (2). HAV antibody prevalence among U.S.-born non-Hispanic Asian adults was lower and more similar to the estimates for the other non-Hispanic race groups.
Prevalence of past or current HBV infection (indicated by hepatitis B core antibody) as well as current active HBV infection (indicated by hepatitis B surface antigen) were both higher among non-Hispanic Asian adults than among non-Hispanic white, non-Hispanic black, and Hispanic adults. As expected, prevalence of past or current HBV infection was greater among non-Hispanic Asian adults born outside the United States (26.5%) than among those born in the United States (2.7%). Prevalence among Asian adults born in the United States was similar to the prevalence in some of the other race and Hispanic origin groups, although some differences still existed. These results are expected based on prior literature on HBV infection in Asian countries and among Asian persons living in the United States (1,3).
Estimates of current HCV infection vary among Asian countries, from 0.1%–4.4% (4). Although NHANES oversamples non-Hispanic Asian persons, the Asian sample is still very small to estimate conditions with low prevalence, such as HCV infection (less than 1% in the total population and less than 2% for any specific race and Hispanic origin subgroup).
NHANES does not include groups that may be considered at higher risk of hepatitis infection (e.g., institutionalized, incarcerated, injection drug-using, and homeless populations, and those living in nonhospital-based long-term care facilities). Therefore, these data provide conservative estimates of disease prevalence.
Worldwide, a majority of diagnoses of cirrhosis and hepatocellular carcinoma have been attributed to viral hepatitis infection, especially HBV and HCV infection (5). Therefore, it is important to continue to monitor the prevalence of these serious infections among racial and ethnic groups in the United States.
Definitions
Prevalence of antibody to HAV: Reflects immunity due to vaccination or natural infection. HAV infection is primarily transmitted by close personal contact or ingestion of contaminated food or drink.
Prevalence of past or current HBV infection: Presence of hepatitis B core antibody is a measure of past or current infection and not a measure of immunity due to vaccination. HBV infection is transmitted primarily through sexual contact, contaminated blood, or from an infected mother to her newborn.
Prevalence of current HBV infection: Presence of hepatitis B surface antigen is indicative of current active or acute infection.
Prevalence of current HCV infection: Presence of hepatitis C virus RNA is a measure of current or active infection. HCV infection is transmitted primarily by injection drug use or receipt of contaminated blood.
Data source and methods
Data from NHANES 2011–2014 were used for these analyses. NHANES is a cross-sectional survey designed to monitor the health and nutritional status of the civilian, noninstitutionalized U.S. population. The survey consists of interviews conducted in participants’ homes followed by standardized physical examinations that include collection of blood and other biological specimens for laboratory tests.
NHANES is based on a complex, multistage design with data released in 2-year cycles. The design includes oversampling and the ability to combine cycles to obtain reliable estimates for population subgroups. Starting with the 2011–2012 survey cycle, non-Hispanic Asian persons were oversampled to obtain more reliable estimates of health for this race and ethnic group. Additional information about NHANES is available.
Prevalence estimates and standard errors were calculated in SAS-callable SUDAAN software, release 11.0 (RTI International, Research Triangle Park, N.C.). The examination sample weights were used to account for differing probabilities of selection, nonresponse, and noncoverage. Taylor series linearization was used to calculate standard errors to take into account the complex sampling design. Differences between groups were evaluated using a Student’s t statistic at the p less than 0.05 significance level. Estimates with a relative standard error greater than 30% or based on fewer than 10 positives were designated as potentially unreliable and should be interpreted with caution. All differences discussed are statistically significant unless otherwise indicated. Calculated estimates were not age-adjusted and no adjustments were made for multiple comparisons.
About the authors
Deanna Kruszon-Moran, Ryne Paulose-Ram, and Geraldine McQuillan are with CDC’s National Center for Health Statistics, Division of Health and Nutrition Examination Surveys. Maxine Denniston is with CDC’s National Center for HIV/AIDS, Viral Hepatitis, STD and TB Prevention, Division of Viral Hepatitis.
References
- CDC, National Center for HIV/AIDS, Viral Hepatitis, STD, and TB Prevention. Chapter 3: Viral hepatitis. In: Epidemiologic Profile 2010: Asians and Native Hawaiians and Other Pacific Islanders. Atlanta, GA: 26–37. 2012.
- WHO. Hepatitis A. 2007.
- CDC. Viral hepatitis–CDC recommendations for specific populations and settings.
- Nguyen LH, Nguyen MH. Systematic review: Asian patients with chronic hepatitis C infection. Aliment Pharmacol Ther 37(10):921–36. 2013.
- Perz JF, Armstrong GL, Farrington LA, Hutin YJ, Bell BP. The contributions of hepatitis B virus and hepatitis C virus infections to cirrhosis and primary liver cancer worldwide. J Hepatol 45(4):529–38. 2006.
Suggested citation
Kruszon-Moran D, Paulose-Ram R, Denniston M, McQuillan G. Viral hepatitis among non-Hispanic Asian adults in the United States, 2011–2014. NCHS data brief, no 225. Hyattsville, MD: National Center for Health Statistics. 2015.
Copyright information
All material appearing in this report is in the public domain and may be reproduced or copied without permission; citation as to source, however, is appreciated.
National Center for Health Statistics
Charles J. Rothwell, M.S., M.B.A., Director
Nathaniel Schenker, Ph.D., Deputy Director
Jennifer H. Madans, Ph.D., Associate Director for Science
Division of Health and Nutrition Examination Surveys
Kathryn S. Porter, M.D., M.S., Director
Ryne Paulose-Ram, Ph.D., Associate Director for Science