Variation in Physician Office Visit Rates by Patient Characteristics and State, 2012
- Key findings
- Did office-based physician visit rates vary by patient age and sex?
- Did physician office visit rates for children vary by state where the visit occurred?
- Did physician office visit rates for adults aged 18–64 vary by state where the visit occurred?
- Did physician office visit rates for adults aged 65 and over vary by state where the visit occurred?
- Did the percentage of physician office visits with private insurance as the expected source of payment for adults aged 18–64 vary by state where the visit occurred?
- Summary
- Data source and methods
- About the authors
- References
- Suggested citation
NCHS Data Brief No. 212, September 2015
PDF Version (1.5 MB)
Jill J. Ashman, Ph.D.; Esther Hing, M.P.H.; and Anjali Talwalkar, M.D., M.P.H.
Key findings
Data from the National Ambulatory Medical Care Survey
- In 2012, there were an estimated 301 physician office visits per 100 persons. The visit rate among females exceeded the rate for males.
- The rate for adults aged 65 and over was more than twice the rate for adults aged 18–64 and children under age 18 years.
- Among the 34 most populous states, Missouri had the lowest rate of physician office visits for both adult age groups (18–64 and 65 and over), and Connecticut had the highest rate.
- The percentage of visits made by adults aged 18–64 with private insurance as the expected source of payment varied across the 34 most populous states, ranging from 53% in New York and Arkansas to 79% in Maryland.
In 2012, 74% of children and adults with a usual place to visit listed a doctor’s office as their usual place for care (1,2). This report examines the rate of physician office visits by patient age, sex, and state. Visits by adults with private insurance as their expected source of payment were also examined. Estimates are based on the 2012 National Ambulatory Medical Care Survey (NAMCS), a nationally representative survey of physician office visits. State estimates for the 34 most populous states are available for the first time. State refers to the location of the physician office visit.
Keywords: ambulatory care, state estimates
Did office-based physician visit rates vary by patient age and sex?
- In 2012, there were an estimated 929 million physician office visits or 301 visits per 100 persons (Figure 1).
- The visit rate among females (342 visits per 100 females) exceeded the rate for males (258 visits per 100 males).
- Visit rates did not vary by sex among children under age 18 and adults aged 65 and over. However, the visit rate for women aged 18–64 (321 per 100 women) was 57% higher than the rate for men aged 18–64 (204 per 100 men).
- The visit rate for adults aged 65 and over (592 per 100 adults) was more than twice the rate for adults aged 18–64 (264 per 100 adults) and children under age 18 (232 per 100 children). This same pattern was observed for males and females.
Figure 1. Physician office visits per 100 persons, by sex and age: United States, 2012
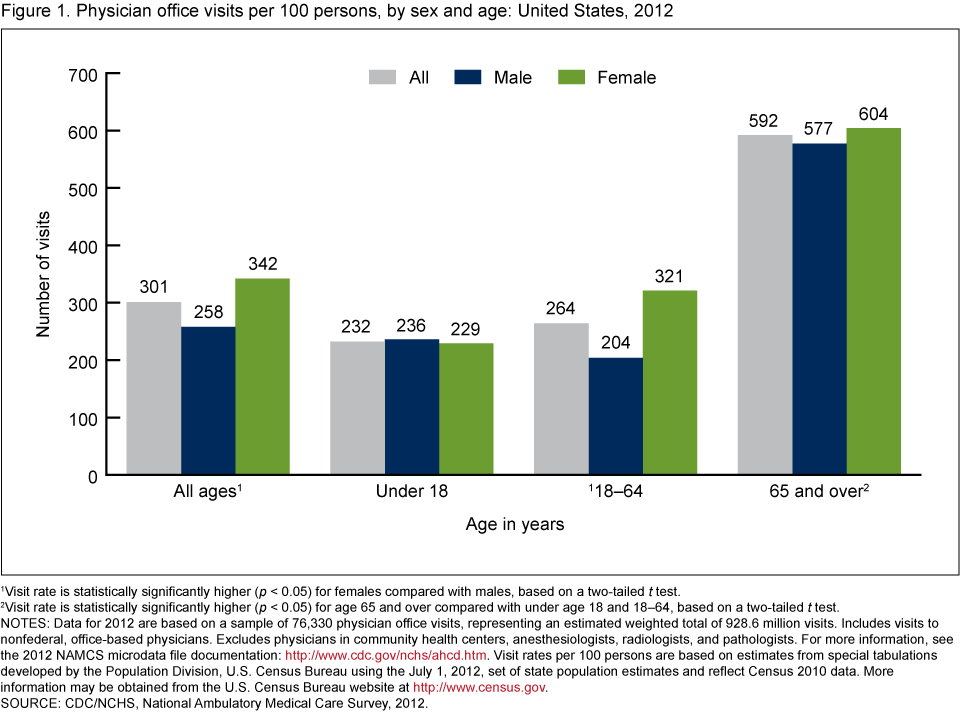
1Visit rate is statistically significantly higher (p < 0.05) for females compared with males, based on a two-tailed t test.
2Visit rate is statistically significantly higher (p < 0.05) for age 65 and over compared with under age 18 and 18–64, based on a two-tailed t test.
NOTES: Data for 2012 are based on a sample of 76,330 physician office visits, representing an estimated weighted total of 928.6 million visits. Includes visits to nonfederal, office-based physicians. Excludes physicians in community health centers, anesthesiologists, radiologists, and pathologists. For more information, see the 2012 NAMCS microdata file documentation. Visit rates per 100 persons are based on estimates from special tabulations developed by the Population Division, U.S. Census Bureau using the July 1, 2012, set of state population estimates and reflect Census 2010 data. More information may be obtained from the U.S. Census Bureau website.
SOURCE: CDC/NCHS, National Ambulatory Medical Care Survey, 2012.
Did physician office visit rates for children vary by state where the visit occurred?
- Among the 25 most populous states with reliable estimates, the rate of physician office visits for children ranged from 137 visits per 100 children in Mississippi to 330 visits per 100 children in Texas (Figure 2).
- The visit rate for children was lower than the national rate of 232 visits per 100 children in Mississippi (137) and Missouri (146). No state was statistically significantly higher than the national rate.
Figure 2. Number of physician office visits per 100 children under age 18 years, by selected states: United States, 2012
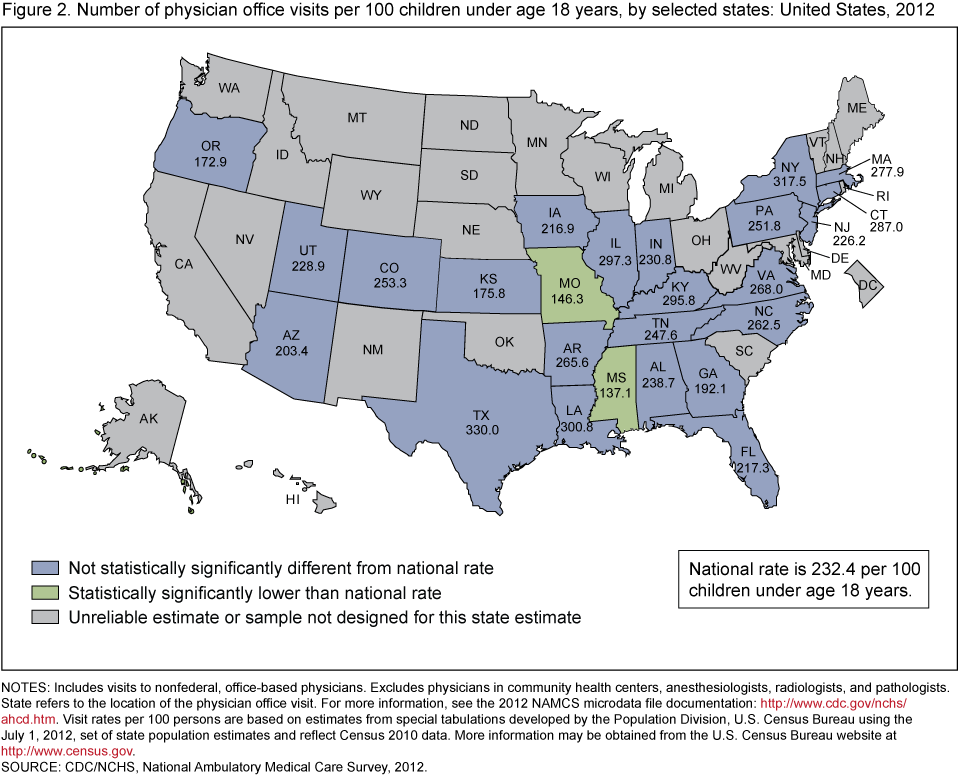
NOTES: Includes visits to nonfederal, office-based physicians. Excludes physicians in community health centers, anesthesiologists, radiologists, and pathologists. State refers to the location of the physician office visit. For more information, see the 2012 NAMCS microdata file documentation. Visit rates per 100 persons are based on estimates from special tabulations developed by the Population Division, U.S. Census Bureau using the July 1, 2012, set of state population estimates and reflect Census 2010 data. More information may be obtained from the U.S. Census Bureau website.
SOURCE: CDC/NCHS, National Ambulatory Medical Care Survey, 2012.
Did physician office visit rates for adults aged 18–64 vary by state where the visit occurred?
- Among the 34 most populous states, the rate of physician office visits for adults aged 18–64 ranged from 145 visits per 100 adults in Missouri to 450 visits per 100 adults in Connecticut (Figure 3).
- The visit rate for adults aged 18–64 was lower than the national rate of 264 visits per 100 adults aged 18–64 in Arkansas (186), Iowa (205), Michigan (185), Missouri (145), North Carolina (166), South Carolina (202), and Washington (205). It was higher than the national rate in Connecticut (450), New Jersey (391), and Tennessee (382).
Figure 3. Number of physician office visits per 100 adults aged 18–64, by selected states: United States, 2012
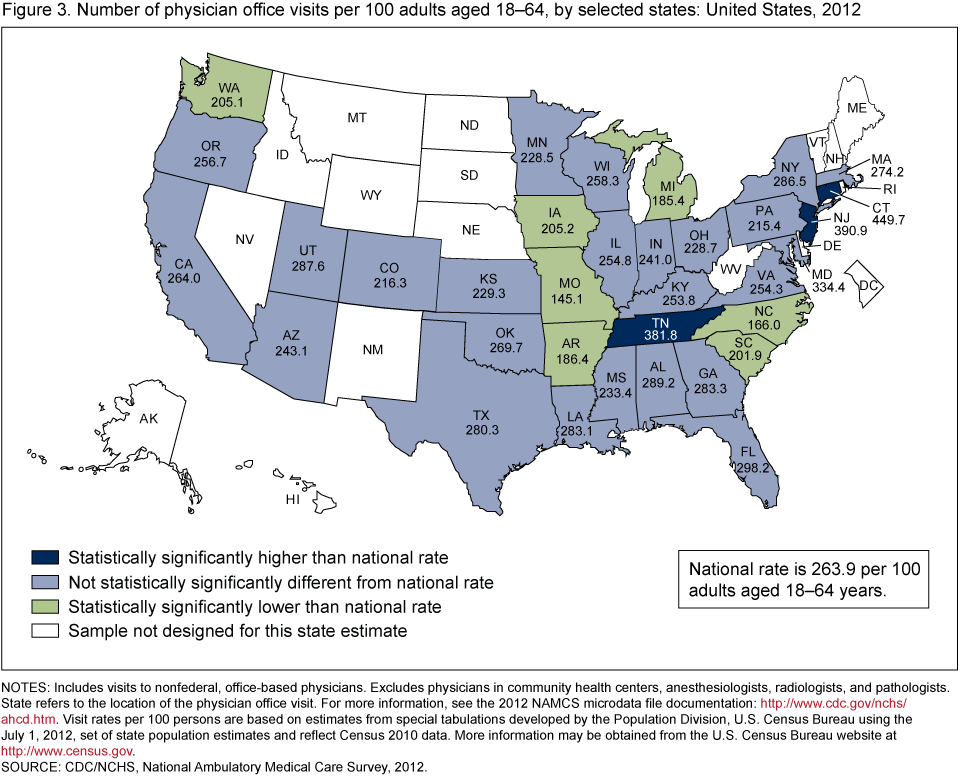
NOTES: Includes visits to nonfederal, office-based physicians. Excludes physicians in community health centers, anesthesiologists, radiologists, and pathologists. State refers to the location of the physician office visit. For more information, see the 2012 NAMCS microdata file documentation. Visit rates per 100 persons are based on estimates from special tabulations developed by the Population Division, U.S. Census Bureau using the July 1, 2012, set of state population estimates and reflect Census 2010 data. More information may be obtained from the U.S. Census Bureau website.
SOURCE: CDC/NCHS, National Ambulatory Medical Care Survey, 2012.
Did physician office visit rates for adults aged 65 and over vary by state where the visit occurred?
- Among the 34 most populous states, the rate of physician office visits for adults aged 65 and over ranged from 296 visits per 100 adults in Missouri to 1,026 visits per 100 adults in Connecticut (Figure 4).
- The visit rate for adults aged 65 and over was lower than the national rate of 592 visits per 100 adults aged 65 and over in Arkansas (473), Iowa (422), Michigan (421), Minnesota (429), Missouri (296), Ohio (321), Pennsylvania (445), and Wisconsin (473). It was higher than the national rate in Connecticut (1,026) and New Jersey (905).
Figure 4. Number of physician office visits per 100 persons aged 65 and over, by selected states: United States, 2012
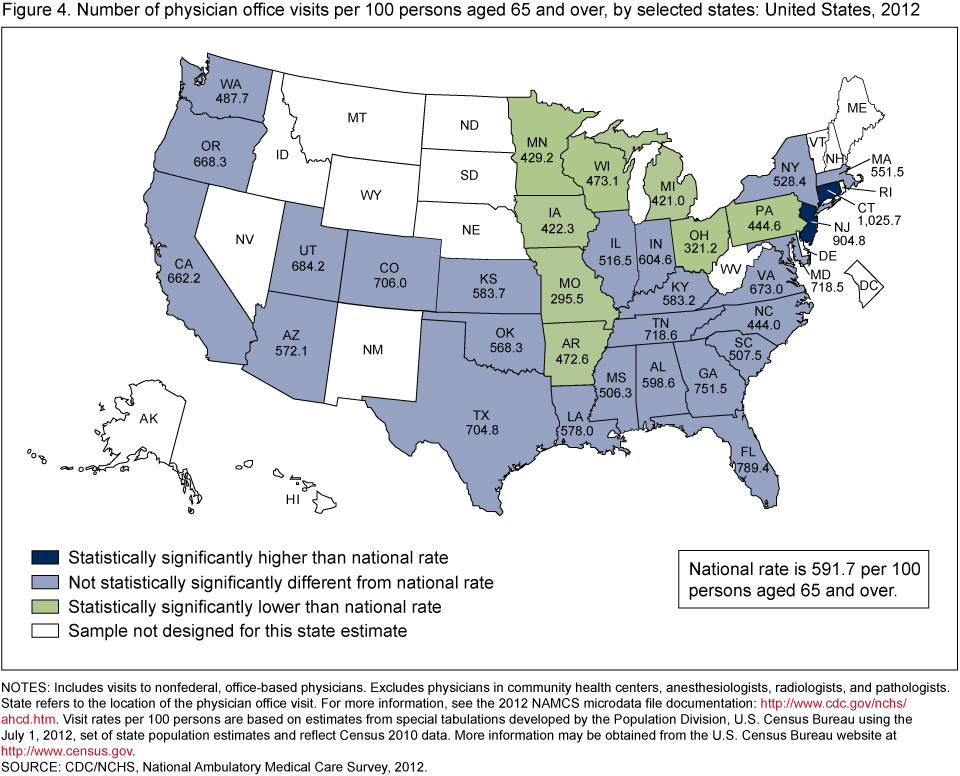
NOTES: Includes visits to nonfederal, office-based physicians. Excludes physicians in community health centers, anesthesiologists, radiologists, and pathologists. State refers to the location of the physician office visit. For more information, see the 2012 NAMCS microdata file documentation. Visit rates per 100 persons are based on estimates from special tabulations developed by the Population Division, U.S. Census Bureau using the July 1, 2012, set of state population estimates and reflect Census 2010 data. More information may be obtained from the U.S. Census Bureau website.
SOURCE: CDC/NCHS, National Ambulatory Medical Care Survey, 2012.
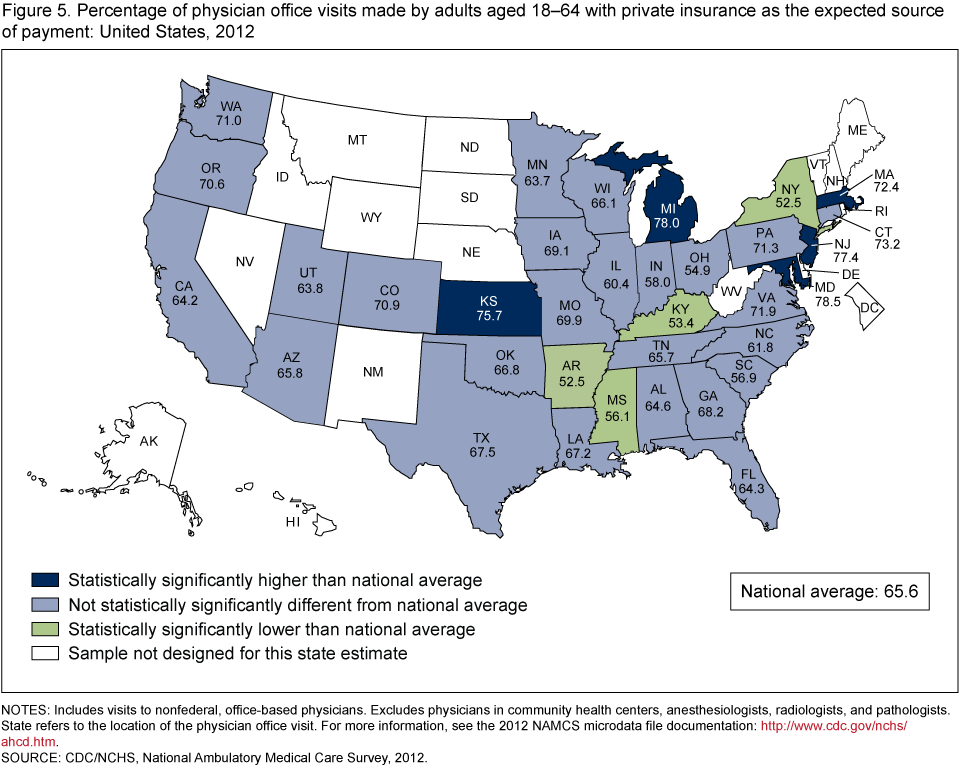
Did the percentage of physician office visits with private insurance as the expected source of payment for adults aged 18–64 vary by state where the visit occurred?
- Private insurance was the expected source of payment for one-half (51%) of all physician office visits in 2012 (data not shown), but 66% of visits made by adults aged 18–64 had private insurance as the expected source of payment (Figure 5).
- The percentage of visits made by adults aged 18–64 with private insurance as the expected source of payment varied across the 34 most populous states, ranging from 53% in Arkansas and New York to 79% in Maryland.
- The percentage of visits made by adults aged 18–64 with private insurance as the expected source of payment was lower than the national average of 66% in Arkansas (53%), Kentucky (53%), New York (53%), and Mississippi (56%). It was higher than the national average in Kansas (76%), Maryland (79%), Massachusetts (72%), Michigan (78%), and New Jersey (77%).
Figure 5. Percentage of physician office visits made by adults aged 18–64 with private insurance as the expected source of payment: United States, 2012
NOTES: Includes visits to nonfederal, office-based physicians. Excludes physicians in community health centers, anesthesiologists, radiologists, and pathologists. State refers to the location of the physician office visit. For more information, see the 2012 NAMCS microdata file documentation.
SOURCE: CDC/NCHS, National Ambulatory Medical Care Survey, 2012.
Summary
During 2012, an estimated 929 million visits were made to physician offices in the United States. There were 171 million visits by children under age 18, representing 18% of all physician office visits. Over one-half (55%) of all physician office visits were made by patients aged 18–64. Adults aged 65 and over made up the remaining 27% of physician office visits in 2012.
In 2012, the overall office-based physician visit rate was 301 visits per 100 persons. Visit rates differed by age and sex. The overall rate of 342 visits for females was higher than the overall rate for males (258). Adult women aged 18–64 had a higher rate than adult men aged 18–64. The visit rate for persons aged 65 and over was much higher than the rate for younger age groups.
In 2012, state estimates for the 34 most populous states were available for the first time. State refers to the location of the physician office visit. For each of the three age groups, the visit rate in Missouri was below the national rate. Data from the National Health Interview Survey showed that in 2012, Missouri had a higher percentage of persons reporting delaying needed medical care or not getting it at all because of the cost than almost all of the other 25 most populous states for which estimates could be calculated (3). For the two adult age groups, Connecticut had the highest visit rate of the 34 most populous states. For children under age 18, no state had a visit rate higher than the national rate. For adults aged 18–64, Connecticut, New Jersey, and Tennessee had visit rates higher than the national rate and for adults aged 65 and over, Connecticut and New Jersey had visit rates higher than the national rate.
Private insurance was the expected source of payment for 66% of visits made by adults aged 18–64. Adults aged 18–64 in Arkansas, Kentucky, New York, and Mississippi were less likely to have private insurance as the expected payment source and in Kansas, Maryland, Massachusetts, Michigan, and New Jersey were more likely to have private insurance than the national average.
Data source and methods
Data for this report are from NAMCS, conducted by the Centers for Disease Control and Prevention’s (CDC) National Center for Health Statistics (NCHS). NAMCS is an annual, nationally representative survey of office-based physicians and their visits (4). The target universe of NAMCS is physicians classified as providing direct patient care in office-based practices. Radiologists, anesthesiologists, and pathologists are excluded, as are physicians in community health centers (CHC). In 2012, the NAMCS survey design changed, and the sample size was increased five-fold to allow for state-level estimates in the 34 most populous states (4,5).This sampling design change may affect trending NAMCS 2011 data with 2012 data. The sample included 9,574 in-scope physicians (4). The unweighted physician response rate was 58.7% (59.7% weighted). Participating physicians provided 76,330 visit records. The unweighted visit response rate for the 2012 survey was 39.3% (39.4% weighted). A detailed analysis of nonresponse bias was conducted by NCHS. After adjustment for nonresponse by state, census division, metropolitan status, and physician specialty categories, no or negligible biases were observed among physicians providing visit data. Although bias toward overestimating solo practitioners and underestimating physicians in larger practices (group or HMO, practices with 11 or more physicians) persisted after adjustments for nonresponse among physicians providing visit data, biases computed at the visit level for the same variables were not statistically significant (4,5). In addition, when 2010 and 2012 NAMCS visit estimates were compared, there were no statistically significant differences between percentages of visits by practice size category (Solo, 2 physicians, 3–5 physicians, 6–10 physicians, or 11 or more physicians) (6,7).
Data analyses were performed using the statistical packages SAS, version 9.3 (SAS Institute, Cary, N.C.), and SAS-callable SUDAAN, version 11.0 (RTI International, Research Triangle Park, N.C.). The physician office location where the visit occurred was used to generate state-level estimates. Statements of difference in estimates are based on two-tailed t tests with significance at the p < 0.05 level.
About the authors
Jill J. Ashman and Esther Hing are with CDC’s National Center for Health Statistics; Anjali Talwalkar is with the DC Department of Health. The opinions are the authors’ and do not represent the views of CDC or the DC Department of Health.
References
- Blackwell DL, Lucas JW, Clarke TC. Summary health statistics for U.S. adults: National Health Interview Survey, 2012. National Center for Health Statistics. Vital Health Stat 10(260). 2014.
- Bloom B, Jones LI, Freeman G. Summary health statistics for U.S. children: National Health Interview Survey, 2012. National Center for Health Statistics. Vital Health Stat 10(258). 2013.
- National Center for Health Statistics. Health, United States, 2013: With Special Feature on Prescription Drugs. Hyattsville, MD. 2014.
- NCHS. 2012 NAMCS microdata file documentation. Hyattsville, MD. 2015.
- Hing E, Shimizu I, Talwalkar A. Nonresponse bias in estimates from the 2012 National Ambulatory Medical Care Survey. Vital Health Stat 2. Forthcoming.
- NCHS. 2012 NAMCS microdata file. 2015.
- NCHS. 2010 NAMCS microdata file. 2012.
Suggested citation
Ashman JJ, Hing E, Talwalkar A. Variation in physician office visit rates by patient characteristics and state, 2012. NCHS data brief, no 212. Hyattsville, MD: National Center for Health Statistics. 2015.
Copyright information
All material appearing in this report is in the public domain and may be reproduced or copied without permission; citation as to source, however, is appreciated.
National Center for Health Statistics
Charles J. Rothwell, M.S., M.B.A., Director
Nathaniel Schenker, Ph.D., Deputy Director
Jennifer H. Madans, Ph.D., Associate Director for Science
Division of Health Care Statistics
Clarice Brown, M.S., Director