Lung Obstruction Among Adults Aged 40–79: United States, 2007–2012
- Key findings
- What were the percentages of adults aged 40–79 with lung obstruction, overall and by sex?
- Did the percentage of adults aged 40–79 with lung obstruction differ by age?
- Did the percentage of adults aged 40–79 with lung obstruction differ by race and Hispanic origin?
- Did the percentage of adults aged 40–79 with lung obstruction differ by education?
- Did the percentage of adults aged 40–79 with respiratory symptoms differ by severity of lung obstruction?
- Summary
- Definitions
- Data source and methods
- About the authors
- References
- Suggested citation
NCHS Data Brief No. 180, January 2015
PDF Version (690 KB)
Timothy Tilert, B.S.; Ryne Paulose-Ram, Ph.D., M.A.; and Debra J. Brody, M.P.H.
Key findings
Data from the National Health and Nutrition Examination Survey, 2007–2012
- During 2007–2012, almost 15% (14.7%) of adults aged 40–79 had any lung obstruction; 9.4% had mild and 5.3% had moderate or worse lung obstruction.
- A similar percentage of men and women had lung obstruction, overall and at each level of severity.
- A greater percentage of adults aged 60–79 (17.0%) than adults aged 40–59 (13.6%) had lung obstruction.
- Rates of lung obstruction, overall and at the moderate or worse severity level, were lower for adults with at least some college education than for those with less education.
- More than one-half of adults aged 40–79 with lung obstruction (55.7%) reported one or more respiratory symptoms. Among adults with moderate or worse lung obstruction, more than 80% had at least one respiratory symptom.
Lung obstruction is characterized by a decrease in airflow and shortness of breath. Common types of obstructive lung diseases include asthma and chronic obstructive pulmonary disease (COPD), which includes emphysema and chronic bronchitis. During 2007–2010, about 15% of adults aged 40–79 had lung obstruction, with about one-third of those having moderate or worse obstruction (1). This report uses 2011–2012 data from the National Health and Nutrition Examination Survey (NHANES) to update these percentages, overall and by severity level. For this report, lung obstruction is defined based on lung function tests or self-reported oxygen use with diagnosed emphysema or current chronic bronchitis.
Keywords: obstructive lung disease, lung impairment, spirometry, COPD
What were the percentages of adults aged 40–79 with lung obstruction, overall and by sex?
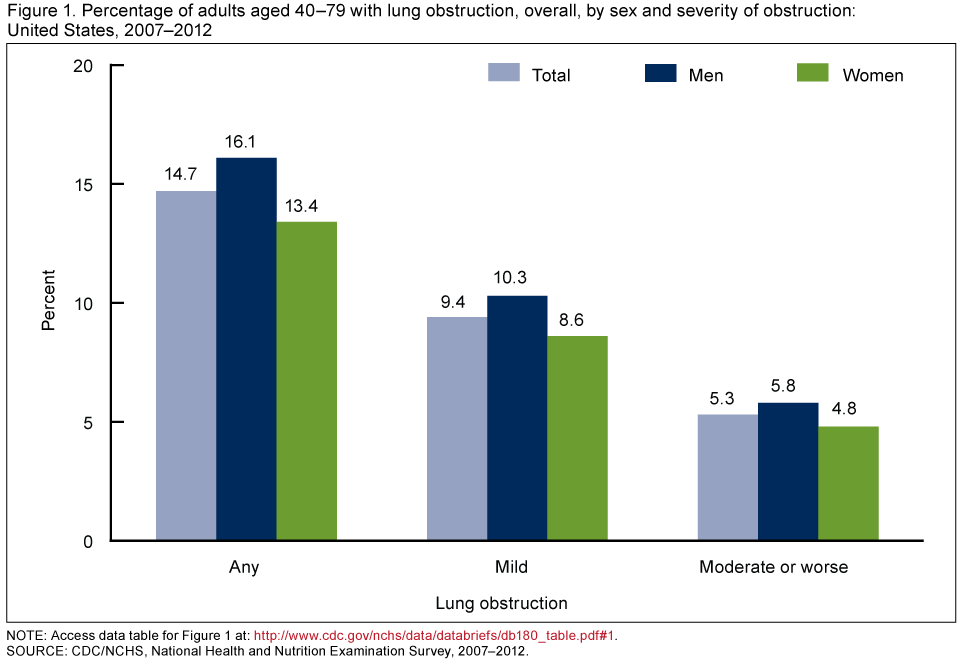
About 15% of U.S. adults aged 40–79 had any lung obstruction, with 9.4% having mild lung obstruction and 5.3% having moderate or worse lung obstruction (Figure 1). A similar percentage of men and women aged 40–79 had lung obstruction overall and at each level of severity.
Figure 1. Percentage of adults aged 40–79 with lung obstruction, overall, by sex and severity of obstruction: United States, 2007–2012
NOTE: Access data table for Figure 1.
SOURCE: CDC/NCHS, National Health and Nutrition Examination Survey, 2007–2012.
Did the percentage of adults aged 40–79 with lung obstruction differ by age?
A lower percentage of adults aged 40–59 had any lung obstruction (13.6%) compared with adults aged 60–79 (17.0%) (Figure 2). There was a similar difference by age among adults with moderate or worse lung obstruction (3.9% and 8.1%, respectively). Among adults with mild lung obstruction, there were no differences in the percentages of adults aged 40–59 and 60–79 with lung obstruction.
Figure 2. Percentage of adults aged 40–79 with lung obstruction, by age group and severity of obstruction: United States, 2007–2012
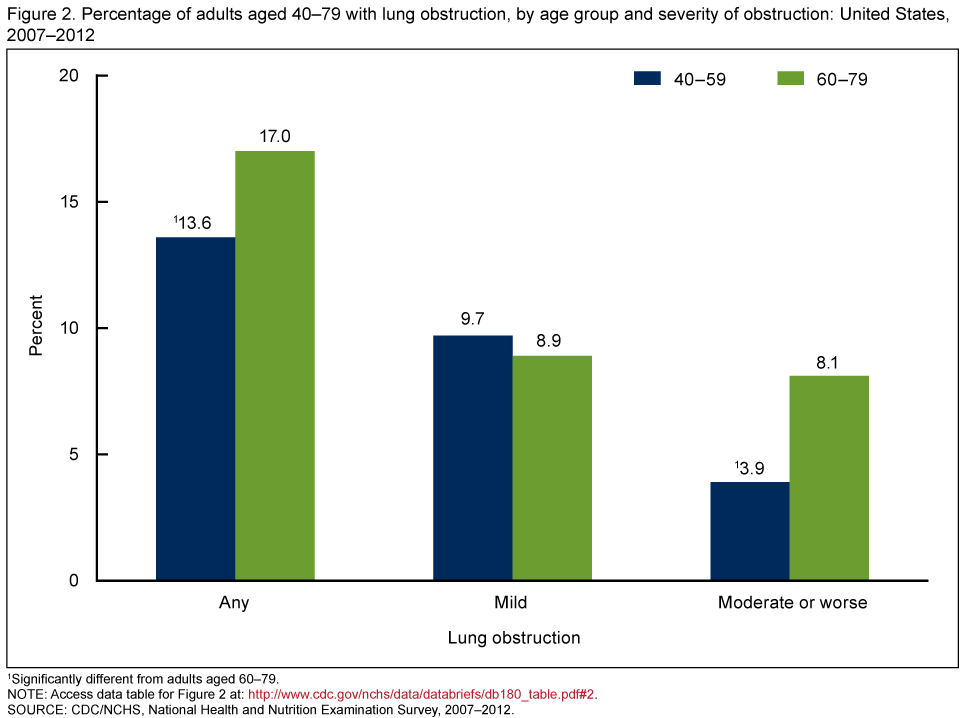
1Significantly different from adults aged 60–79.
NOTE: Access data table for Figure 2.
SOURCE: CDC/NCHS, National Health and Nutrition Examination Survey, 2007–2012.
Did the percentage of adults aged 40–79 with lung obstruction differ by race and Hispanic origin?
The percentage of adults aged 40–79 with lung obstruction varied by race and Hispanic origin. Non-Hispanic white adults had a higher percentage of any lung obstruction (16.3%) than non-Hispanic black adults (13.5%) who, in turn, had a higher percentage than Hispanic adults (7.7%) (Figure 3). This pattern was similar for mild lung obstruction. For moderate or worse lung obstruction, both non-Hispanic white (5.9%) and non-Hispanic black (5.6%) adults had higher rates than Hispanic adults (1.9%).
Figure 3. Age-adjusted percentage of adults aged 40–79 with lung obstruction, by race and Hispanic origin and severity of obstruction: United States, 2007–2012
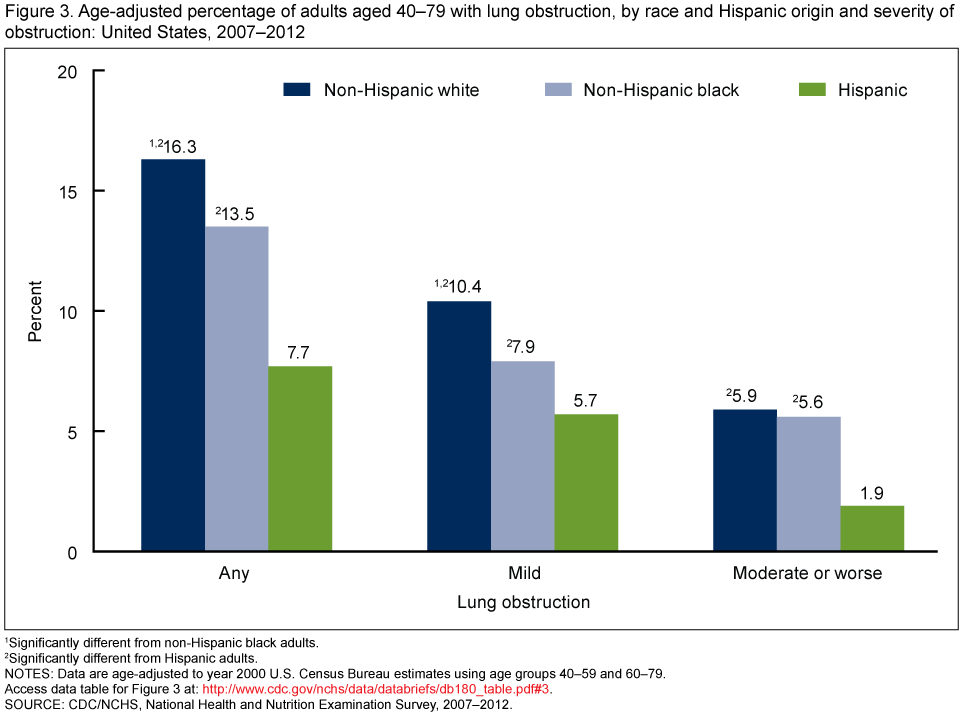
1Significantly different from non-Hispanic black adults.
2Significantly different from Hispanic adults.
NOTES: Data are age-adjusted to year 2000 U.S. Census Bureau estimates using age groups 40–59 and 60–79. Access data table for Figure 3.
SOURCE: CDC/NCHS, National Health and Nutrition Examination Survey, 2007–2012.
Did the percentage of adults aged 40–79 with lung obstruction differ by education?
The percentage of adults aged 40–79 with any lung obstruction was lower for those with at least some college education (13.3%) compared with adults with a high school diploma or less education (16.7% and 17.0%, respectively) (Figure 4). This relationship persisted for those with moderate or worse lung obstruction. However, among adults with mild lung obstruction, the rates of lung obstruction were similar across education levels.
Figure 4. Percentage of adults aged 40–79 with lung obstruction, by education and severity of obstruction: United States, 2007–2012
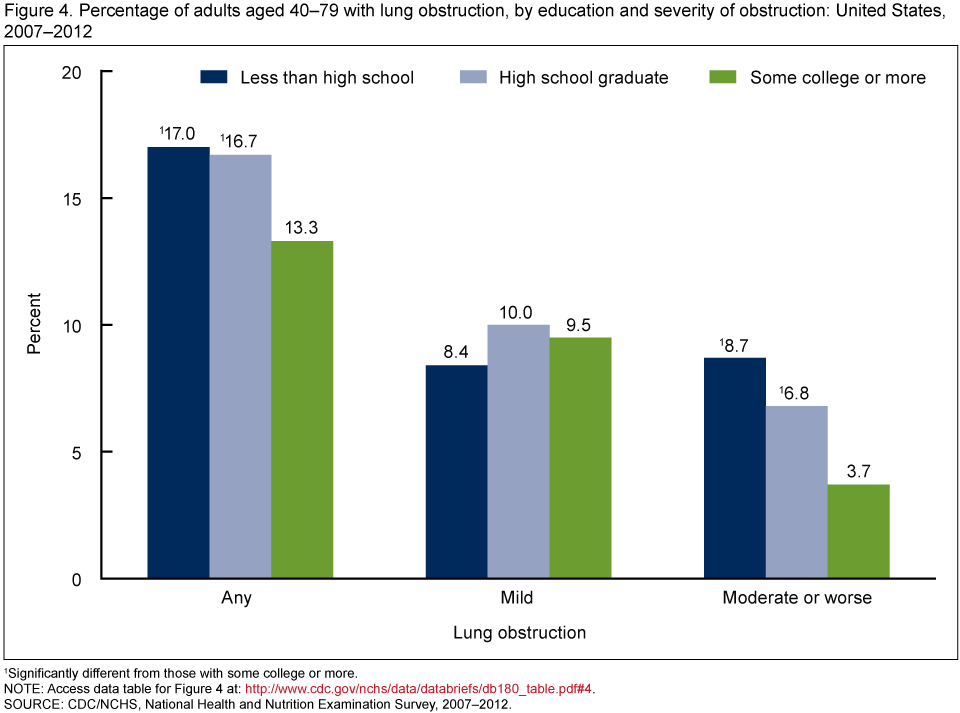
1Significantly different from those with some college or more.
NOTE: Access data table for Figure 4.
SOURCE: CDC/NCHS, National Health and Nutrition Examination Survey, 2007–2012.
Did the percentage of adults aged 40–79 with respiratory symptoms differ by severity of lung obstruction?
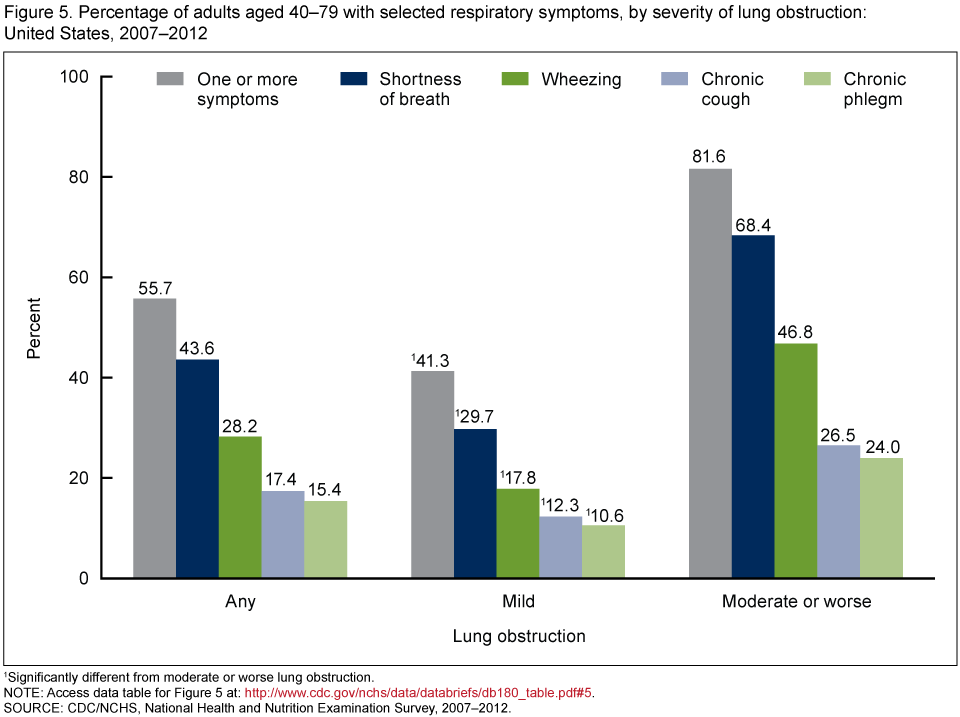
More than one-half (55.7%) of adults aged 40–79 with any lung obstruction reported one or more of the following respiratory symptoms: shortness of breath, wheezing, chronic cough, and chronic phlegm (Figure 5). Shortness of breath was the most commonly reported symptom (43.6%).
More than 40% of adults with mild lung obstruction and more than 80% of adults with moderate or worse lung obstruction reported one or more respiratory symptoms. Each respiratory symptom was reported at a higher rate among adults with moderate or worse lung obstruction compared with adults with mild obstruction.
Figure 5. Percentage of adults aged 40–79 with selected respiratory symptoms, by severity of lung obstruction: United States, 2007–2012
1Significantly different from moderate or worse lung obstruction.
NOTE: Access data table for Figure 5.
SOURCE: CDC/NCHS, National Health and Nutrition Examination Survey, 2007–2012.
Summary
During 2007–2012, 14.7% of U.S. adults aged 40–79 had lung obstruction, with almost two-thirds having mild lung obstruction (9.4%) and one-third having moderate or worse obstruction (5.3%). A similar percentage of men and women had any lung obstruction, a pattern that persisted at each level of severity.
There were notable differences in lung obstruction by race and Hispanic origin. Overall and at both levels of severity, rates of lung obstruction were higher for non-Hispanic white and non-Hispanic black adults compared with Hispanic adults. Overall and at the mild lung obstruction level, the percentage of non-Hispanic white adults with lung obstruction was significantly higher than that of non-Hispanic black adults.
Lung obstruction also varied by education level. Adults who had attended college had a significantly lower percentage of moderate or worse lung obstruction compared with adults with less education. Among adults with mild lung obstruction, percentages were similar by education level.
More than one-half of adults aged 40–79 with lung obstruction reported having at least one respiratory symptom. Reporting rates for each symptom and for one or more symptoms were all higher for those adults with moderate or worse lung obstruction than for those with mild obstruction. Among adults with moderate or worse lung obstruction, more than 80% reported having at least one respiratory symptom.
Definitions
Lung obstruction: Based on lung function values obtained from a pre-bronchodilator spirometry examination, lung obstruction was defined as a forced expiratory volume in the first second (FEV1) to forced vital capacity (FVC) ratio less than the lower limit of normal (2). Persons were also defined as having lung obstruction based on a positive response to use of daytime supplemental oxygen and ever having been diagnosed with emphysema or still having chronic bronchitis.
Severity of lung obstruction: Mild lung obstruction was defined as an FEV1 greater than 70% predicted among those with lung obstruction. Moderate or worse lung obstruction was defined as an FEV1 less than or equal to 70% predicted among those with lung obstruction (2). Persons who were identified as having lung obstruction based on supplemental oxygen use were defined as having moderate or worse lung obstruction.
Respiratory symptoms: Shortness of breath was defined as having shortness of breath on stairs or inclines. Wheezing was defined as having wheezing or whistling in the chest in the past year. Chronic cough was defined as coughing most days over a 3-month period for at least 2 years. Chronic phlegm was defined as bringing up phlegm most days over a 3-month period for at least 2 years.
Data source and methods
Data from NHANES 2007–2012 were used for these analyses. NHANES is a cross-sectional survey designed to monitor the health and nutritional status of the civilian noninstitutionalized resident population of the United States (3). It is conducted by the Centers for Disease Control and Prevention’s (CDC) National Center for Health Statistics. The survey consists of interviews conducted in participants’ homes and standardized physical examinations conducted in mobile examination centers (MECs), where blood and urine specimens are collected. The NHANES sample is selected through a complex, multistage probability design. Data collection is based on a representative sample covering all ages of the target population. During 2007–2010, non-Hispanic black and Hispanic persons were oversampled to obtain more reliable estimates of the health of these population subgroups. During 2011–2012, non-Hispanic Asian persons were also oversampled. Public-use data files are released in 2-year cycles.
During NHANES 2007–2012, spirometry data were collected in the MEC from survey participants aged 6–79 years. Details of the NHANES spirometry examination procedures and data collection are available elsewhere (4). Lung obstruction may be defined using multiple criteria. This report uses the American Thoracic Society/European Respiratory Society (ATS/ERS) diagnostic criteria (2) and follows the data and analytic methodology conducted by Tilert et al. (1). Examination sample weights were used to account for differential probabilities of selection, nonresponse, and noncoverage, and they were incorporated into the estimation process. Standard errors of the percentages were estimated using Taylor series linearization, a method that incorporates the sample weights and accounts for the complex survey design. Estimates for race and Hispanic origin were age-adjusted by the direct method to the year 2000 projected U.S. standard population using two age groups: 40–59 and 60–79. Differences between groups were tested using Student’s t statistic at the p < 0.05 significance level. Statistical analyses were conducted using STATA version 12.1 (StataCorp, College Station, Tex.).
About the authors
Timothy Tilert, Ryne Paulose-Ram, and Debra J. Brody are with CDC’s National Center for Health Statistics, Division of Health and Nutrition Examination Surveys.
References
- Tilert T, Dillon C, Paulose-Ram R, Hnizdo E, Doney B. Estimating the U.S. prevalence of chronic obstructive pulmonary disease using pre- and post-bronchodilator spirometry: The National Health and Nutrition Examination Survey (NHANES) 2007–2010. Respir Res 14(1):103. 2013.
- Pellegrino R, Viegi G, Brusasco V, Crapo RO, Burgos F, Casaburi R, et al. Interpretative strategies for lung function tests. Eur Respir J 26(5):948–68. 2005.
- Zipf G, Chiappa M, Porter KS, et al. The National Health and Nutrition Examination Survey: Plan and operations, 1999–2010. National Center for Health Statistics. Vital Health Stat 1(56). 2013.
- NCHS. National Health and Nutrition Examination Survey (NHANES): Respiratory health spirometry procedures manual. 2011.
Suggested citation
Tilert T, Paulose-Ram R, Brody DJ. Lung obstruction among adults aged 40–79: United States, 2007–2012. NCHS data brief, no 180. Hyattsville, MD: National Center for Health Statistics. 2015.
Copyright information
All material appearing in this report is in the public domain and may be reproduced or copied without permission; citation as to source, however, is appreciated.
National Center for Health Statistics
Charles J. Rothwell, M.S., M.B.A., Director
Jennifer H. Madans, Ph.D., Associate Director for Science
Division of Health and Nutrition Examination Surveys
Kathryn S. Porter, M.D., M.S., Director