Discussions Between Health Care Providers and Their Patients Who Smoke Cigarettes
- Key findings
- About one-half of adult cigarette smokers had a doctor or other health professional talk to them about their smoking, although prevalence varied by population subgroup.
- For both women and men, the percentage of smokers who had a doctor or other health professional talk to them about their smoking in the past 12 months increased with age.
- Cigarette smokers in excellent or very good health were less likely than those in worse health to have had a health professional talk to them about their smoking, regardless of age.
- Cigarette smokers who smoked on some days were less likely than those who smoked every day to have had a health professional talk to them about their smoking, regardless of health status.
- Cigarette smokers with selected health conditions that have been linked to smoking were more likely than smokers without these conditions to have had a health professional talk to them about their smoking.
- Summary
- Definitions
- Data source and methods
- About the authors
- References
- Suggested citation
NCHS Data Brief No. 174, December 2014
PDF Version (317 KB)
Colleen N. Nugent, Ph.D.; Charlotte A. Schoenborn, M.P.H.; and Anjel Vahratian, Ph.D.
Key findings
Data from the National Health Interview Survey, 2011–2013
- About one-half of adult cigarette smokers had a doctor or other health professional talk to them about their smoking in the past 12 months.
- Men, younger adults, Hispanic adults, and non-Hispanic Asian adults were less likely than other cigarette smokers to have had a health professional talk to them about their smoking.
- Healthier smokers, younger smokers, and those who did not smoke cigarettes every day were less likely than other cigarette smokers to have had a health professional talk to them about their smoking.
- Cigarette smokers with selected health conditions linked to smoking were more likely than those without these conditions to have had a health professional talk to them about their smoking.
Smoking is the primary cause of preventable death in the United States (1). Studies show that a majority of smokers would like to quit (2) and that even simple advice from physicians has a positive effect on cessation rates (3). Federal and nonprofit agencies have recommended screening and identification of smokers by clinicians and health care delivery systems, as well as intervention and guidance on quitting (4–6). Studies suggest that older persons (2,7–11), women (2,7–9), heavier smokers, and those in poorer health (4,7,10–11) are more likely to receive medical advice to quit smoking. This report extends earlier research by identifying key population and health characteristics associated with those U.S. cigarette smokers aged 18 and over who had a health professional talk to them about their smoking.
Keywords: smoking, screening, prevention, National Health Interview Survey
About one-half of adult cigarette smokers had a doctor or other health professional talk to them about their smoking, although prevalence varied by population subgroup.
Figure 1. Percentage of adult cigarette smokers who had a doctor or other health professional talk to them about their smoking in the past 12 months, by selected demographic characteristics: United States, 2011–2013
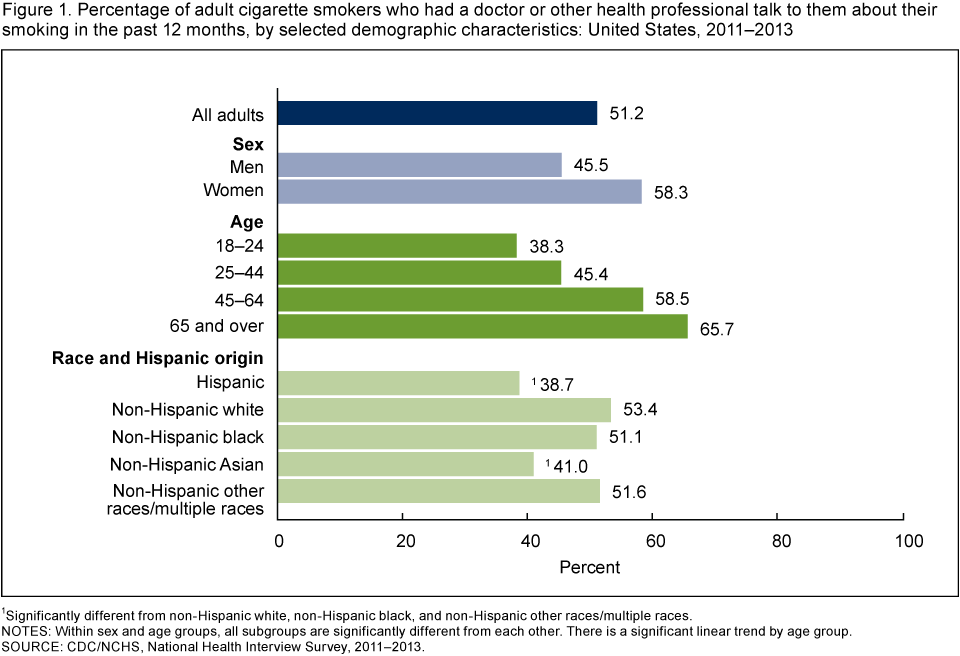
1Significantly different from non-Hispanic white, non-Hispanic black, and non-Hispanic other races/multiple races.
NOTES: Within sex and age groups, all subgroups are significantly different from each other. There is a significant linear trend by age group.
SOURCE: CDC/NCHS, National Health Interview Survey, 2011–2013.
- Male smokers (45.5%) were less likely than female smokers (58.3%) to have had a doctor or other health professional talk to them about their smoking in the past 12 months (Figure 1).
- The percentage of smokers who had a health professional talk to them about their smoking increased with age, from 38.3% of those aged 18–24 to 65.7% of those aged 65 and over.
- Hispanic smokers (38.7%) and non-Hispanic Asian smokers (41.0%) were less likely than smokers in other race/ethnicity groups to have had a health professional talk to them about their smoking.
For both women and men, the percentage of smokers who had a doctor or other health professional talk to them about their smoking in the past 12 months increased with age.
- Younger female smokers (aged 18–24 and 25–44) were less likely than older female smokers (aged 45–64 and 65 and over) to have had a doctor or other health professional talk to them about their smoking in the past 12 months (Figure 2).
- Less than one-third of male smokers aged 18–24 had a health professional talk to them about their smoking, compared with nearly two-thirds of men aged 65 and over.
- Among adult smokers under age 65, women were more likely than men to have had a health professional talk to them about their smoking.
- Among smokers aged 65 and over, men (66.1%) and women (65.2%) were equally likely to have had a health professional talk to them about their smoking.
Figure 2. Percentage of adult cigarette smokers who had a doctor or other health professional talk to them about their smoking in the past 12 months, by sex and age: United States, 2011–2013
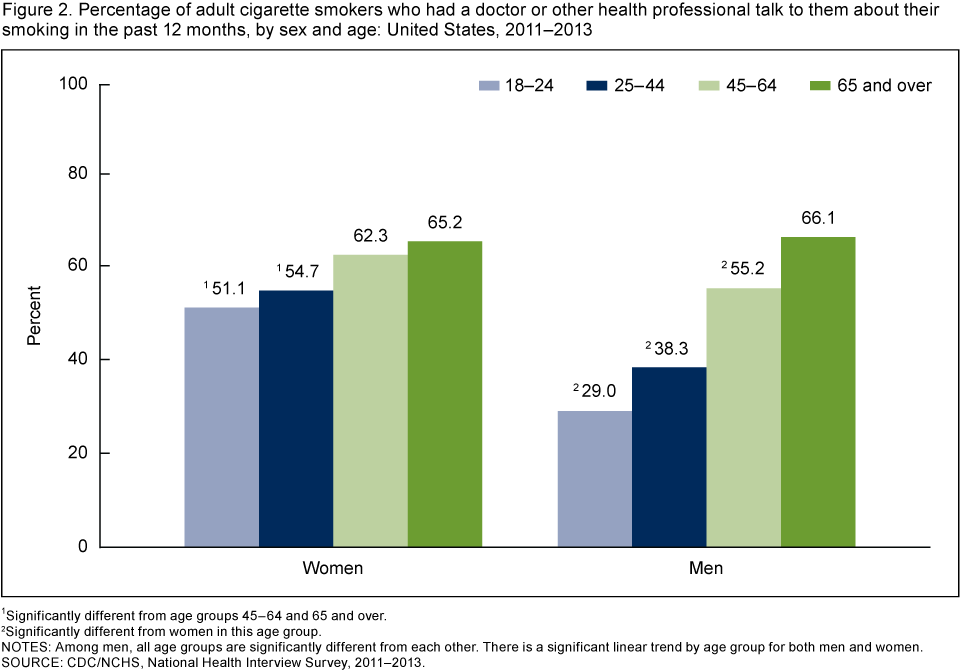
1Significantly different from age groups 45–64 and 65 and over.
2Significantly different from women in this age group.
NOTES: Among men, all age groups are significantly different from each other. There is a significant linear trend by age group for both men and women.
SOURCE: CDC/NCHS, National Health Interview Survey, 2011–2013.
Cigarette smokers in excellent or very good health were less likely than those in worse health to have had a health professional talk to them about their smoking, regardless of age.
- For each category of health status, the percentage of smokers who had a doctor or other health professional talk to them about their smoking in the past 12 months increased with age (Figure 3).
- Among those aged 45–64 and 65 and over, nearly three-quarters of those in fair or poor health had a doctor or other health professional talk to them about their smoking, compared with about one-half of those in excellent or very good health.
- Among smokers aged 18–24, just over one-half of those in fair or poor health (53.5%) had a health professional talk to them about their smoking, compared with 34.9% of those who were in excellent or very good health. Among smokers aged 25–44, those in fair or poor health (60.0%) were more likely than those in excellent or very good health (41.1%) to have been talked to by a health professional.
Figure 3. Percentage of adult cigarette smokers who had a doctor or other health professional talk to them about their smoking in the past 12 months, by age and health status: United States, 2011–2013
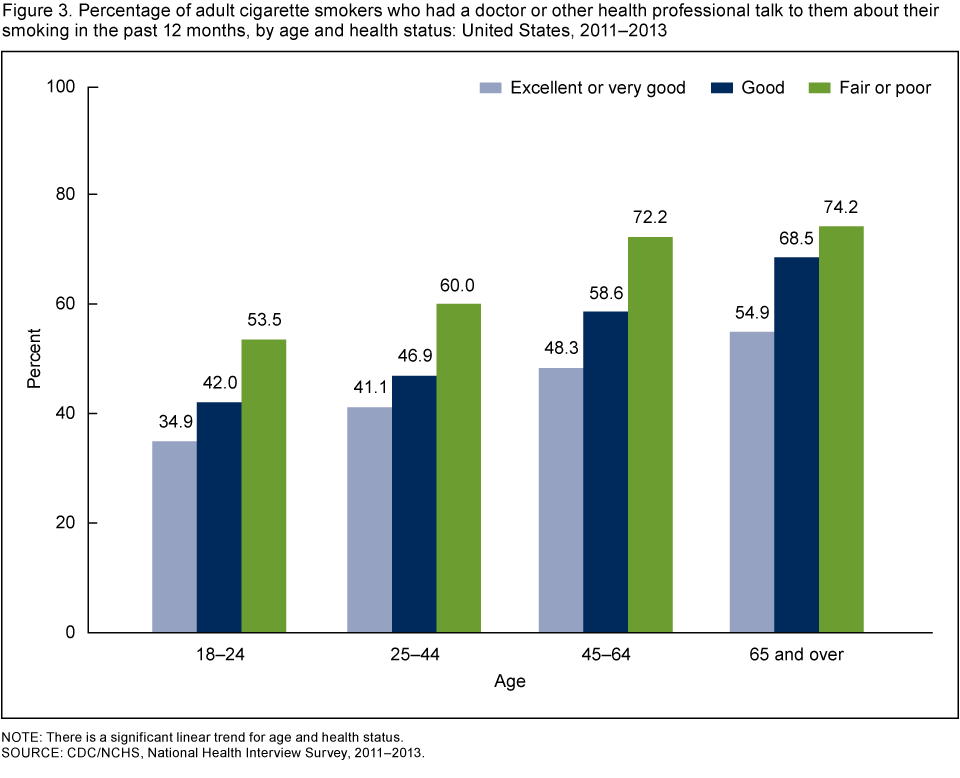
NOTE: There is a significant linear trend for age and health status.
SOURCE: CDC/NCHS, National Health Interview Survey, 2011–2013.
Cigarette smokers who smoked on some days were less likely than those who smoked every day to have had a health professional talk to them about their smoking, regardless of health status.
- Among both every day and some day smokers, those in excellent or very good health were less likely than those in good, fair, or poor health to have had a doctor or other health professional talk to them about their smoking in the past 12 months (Figure 4).
- The percentage of cigarette smokers who had a health professional talk to them about their smoking was highest for every day smokers in fair or poor health (71.0%) and lowest for some day smokers in excellent or very good health (31.9%).
Figure 4. Percentage of adult cigarette smokers who had a doctor or other health professional talk to them about their smoking in the past 12 months, by smoking frequency and health status: United States, 2011–2013
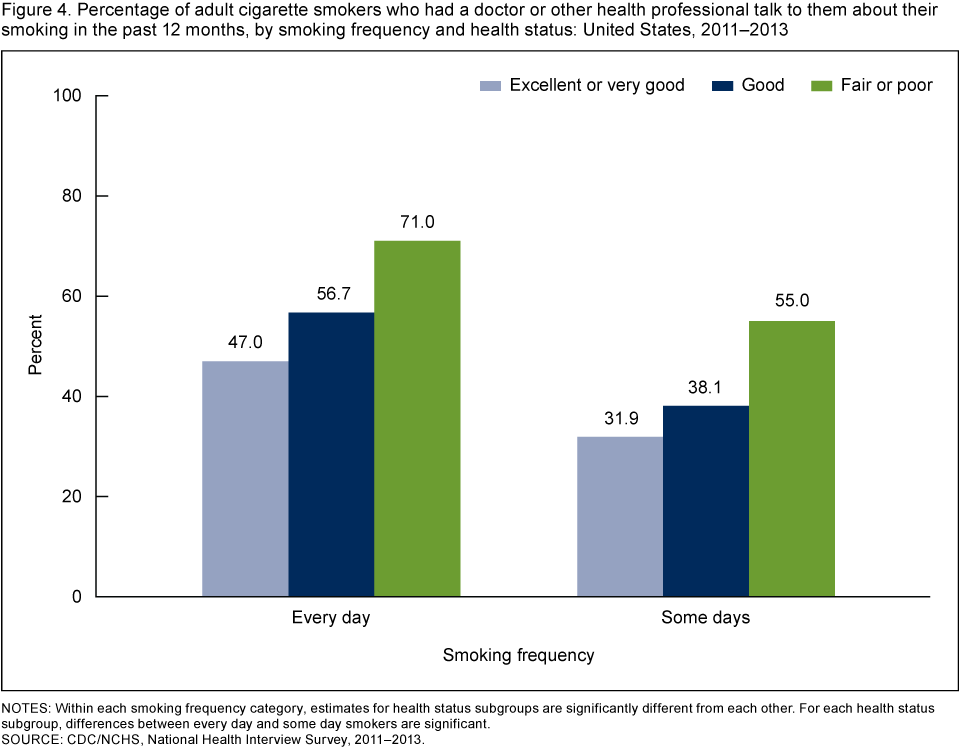
NOTES: Within each smoking frequency category, estimates for health status subgroups are significantly different from each other. For each health status subgroup, differences between every day and some day smokers are significant.
SOURCE: CDC/NCHS, National Health Interview Survey, 2011–2013.
Cigarette smokers with selected health conditions that have been linked to smoking were more likely than smokers without these conditions to have had a health professional talk to them about their smoking.
- Among cigarette smokers who had diabetes or a smoking-related cancer, more than three-quarters had a doctor or other health professional talk to them about their smoking in the past 12 months, compared with about one-half of smokers who did not have these conditions (Figure 5).
- Among smokers who had a respiratory condition or a heart condition, almost 70% had a health professional talk to them about their smoking, compared with less than 50% of smokers who did not have these conditions.
Figure 5. Percentage of adult cigarette smokers who had a doctor or other health professional talk to them about their smoking in the past 12 months, by selected health conditions: United States, 2011–2013
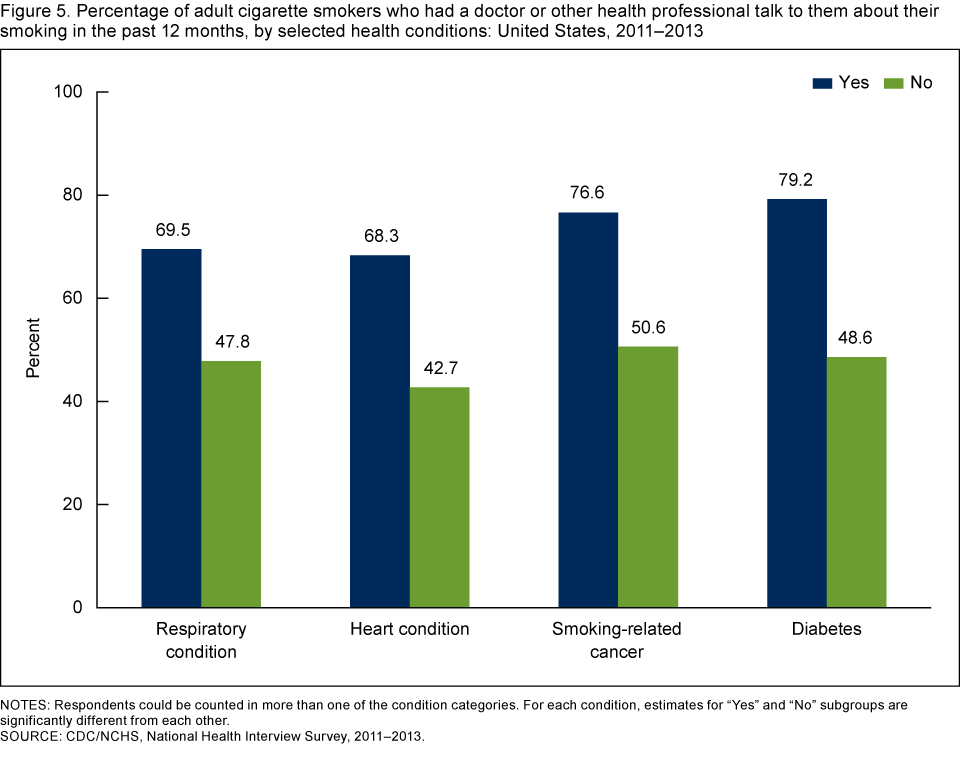
NOTES: Respondents could be counted in more than one of the condition categories. For each condition, estimates for “Yes” and “No” subgroups are significantly different from each other.
SOURCE: CDC/NCHS, National Health Interview Survey, 2011–2013.
Summary
Increasing tobacco screening in health care settings is a Healthy People 2020 objective (12). This report looks at adult cigarette smokers in the general household population and whether a doctor or other health professional had talked to them about their smoking in the past 12 months.
About one-half of all adult cigarette smokers (51.2%) had a doctor or other health professional talk to them about their smoking. Cigarette smokers who were male, younger, Hispanic, or non-Hispanic Asian were less likely than those who were female, older, non-Hispanic white, non-Hispanic black, or non-Hispanic other races/multiple races to have had a doctor or other health professional talk to them about their smoking. Despite the public health significance of reducing smoking among women who either are or may become pregnant (1), women of childbearing age (18–44 years) were no more likely than the population overall to have been talked to about their smoking. Nondaily smokers, smokers in good or better general health, and those without selected health conditions linked to smoking, were less likely than those who smoked daily, were in fair or poor health, or had selected health conditions linked to smoking to have had a doctor or other health professional talk to them about their smoking.
Overall, results reveal that cigarette smokers are not all treated the same when it comes to health professionals talking to them about their smoking. Clinical practice guidelines suggest that tobacco interventions delivered in a timely manner can greatly reduce the risk that smokers will suffer from smoking-related diseases (4). The present results identify apparent gaps in the application of recommendations for the screening of cigarette smokers by health care professionals.
Definitions
Cigarette smoker: An adult aged 18 or over who has smoked at least 100 cigarettes in his or her lifetime and now smokes cigarettes every day or some days.
Health status: Family respondents were asked to assess the health of all family members, specifically, whether their “health in general is excellent, very good, good, fair, or poor?” When the sample adult is not the family respondent, this information is proxy-reported.
Heart condition: Includes ever having had coronary heart disease, angina, other heart condition, heart attack, stroke, or hypertension.
Lung condition: Includes current asthma, chronic bronchitis in the past year, and ever having had emphysema. Lung cancer was not included in this category.
Smoking-related cancer: Includes ever having had any of the following cancers for which the 50th Anniversary Surgeon General’s Report (1) lists a causal link to smoking: bladder, cervix, colon, esophagus, kidney, larynx, liver, lung, pancreas, rectum, stomach, and throat.
Data source and methods
The National Health Interview Survey (NHIS) is a nationally representative survey of the civilian noninstitutionalized population of the United States. It is conducted continuously throughout the year for the Centers for Disease Control and Prevention’s (CDC) National Center for Health Statistics (NCHS). NHIS is an in-person interview conducted in the respondent’s home. In some instances, follow-up to complete the interview is by telephone. The survey consists of (a) a Family Core component, with questions asked about all members of the family; (b) a Sample Adult component, which collects additional information from one randomly selected adult per family (self-response required); and (c) a Sample Child component, which collects additional information about one randomly selected child per family. Data for this analysis come from the Sample Adult and Family Core (person file) components of the 2011–2013 NHIS. For more information visit NHIS website.
All current cigarette smokers were asked, “During the past 12 months, has a doctor or other health professional talked to you about your smoking?” Figures show the percentage of current smokers who responded “yes” to this question, by selected characteristics. No additional questions were asked about the content of the smoking-related conversation. The study population included all current cigarette smokers, regardless of whether they had seen a doctor or other health professional in the past 12 months. The focus was on identifying cigarette smokers who had not had a conversation with a health professional about their smoking; this included both those who saw a professional but smoking was not discussed and those who did not seek medical care and thus were not exposed to such conversations.
NHIS is designed to yield a nationally representative sample, and this analysis used weights to produce national estimates. The sample design is described in more detail elsewhere (13). Point estimates and estimates of corresponding variances were calculated using the SUDAAN software package (14) to account for the complex sample design of NHIS. The Taylor series linearization method was used for variance estimation. All estimates shown meet the NCHS standard for reliability (having a relative standard error less than or equal to 30%). Linear trends and differences between percentages were evaluated using two-sided significance tests at the 0.05 level.
About the authors
Colleen N. Nugent, Charlotte A. Schoenborn, and Anjel Vahratian are with CDC’s National Center for Health Statistics, Division of Health Interview Statistics.
References
- HHS. The health consequences of smoking—50 years of progress: A report of the Surgeon General. Atlanta, GA: CDC, National Center for Chronic Disease Prevention and Health Promotion, Office on Smoking and Health. Printed with corrections, January 2014.
- CDC. Quitting smoking among adults—United States, 2001–2010. MMWR 60(44):1513–9. 2011.
- Stead LF, Buitrago D, Preciado N, Sanchez G, Hartmann-Boyce J, Lancaster T. Physician advice for smoking cessation [review]. Cochrane Database Syst Rev 5:CD000165. 2013.
- Fiore MC, Jaén CR, Baker TB, et al. Treating tobacco use and dependence: 2008 update [PDF – 2.04 MB]. Clinical Practice Guideline. Rockville, MD: HHS, Public Health Service. 2008.
- Institute of Medicine. Ending the tobacco problem: A blueprint for the nation. Washington, DC: National Academies Press. 2007.
- CDC. Best practices for comprehensive tobacco control programs—2014 [PDF – 2.20 MB]. Atlanta, GA: National Center for Chronic Disease Prevention and Health Promotion, Office on Smoking and Health. 2014.
- CDC. Physician and other health-care professional counseling of smokers to quit—United States, 1991. MMWR 42(44):854–7. 1993.
- Denny CH, Serdula MK, Holtzman D, Nelson DE. Physician advice about smoking and drinking: Are U.S. adults being informed? Am J Prev Med 24(1):71–4. 2003.
- Doescher MP, Saver BG. Physicians’ advice to quit smoking: The glass remains half empty. J Fam Pract 49(6):543–7. 2000.
- Frank E, Winkleby MA, Altman DG, Rockhill B, Fortmann SP. Predictors of physicians’ smoking cessation advice. JAMA 266(22):3139–44. 1991.
- Gilpin EA, Pierce JP, Johnson M, Bal D. Physician advice to quit smoking: Results from the 1990 California Tobacco Survey. J Gen Intern Med 8(10):549–53. 1993.
- HHS, Office of Disease Prevention and Health Promotion. Healthy People 2020. Washington, DC. 2014.
- Parsons VL, Moriarity C, Jonas K, et al. Design and estimation for the National Health Interview Survey, 2006–2015 [PDF – 1.38 MB]. National Center for Health Statistics. Vital Health Stat 2(165). 2014.
- RTI International. SUDAAN (Release 11.0.0) [computer software]. 2012.
Suggested citation
Nugent CN, Schoenborn CA, Vahratian A. Discussions between health care providers and their patients who smoke cigarettes. NCHS data brief, no 174. Hyattsville, MD: National Center for Health Statistics. 2014.
Copyright information
All material appearing in this report is in the public domain and may be reproduced or copied without permission; citation as to source, however, is appreciated.
National Center for Health Statistics
Charles J. Rothwell, M.S., M.B.A., Director
Jennifer H. Madans, Ph.D., Associate Director for Science
Division of Health Interview Statistics
Marcie L. Cynamon, Acting Director