Use of Selected Nonmedication Mental Health Services by Adolescent Boys and Girls With Serious Emotional or Behavioral Difficulties: United States, 2010–2012
- Key findings
- Approximately 4% of adolescents aged 12–17 have a serious emotional or behavioral difficulty and have received nonmedication mental health services in the past 6 months.
- About one in three adolescents aged 12–17 with serious emotional or behavioral difficulties (37% of boys and 33% of girls) received both school and nonschool nonmedication mental health services.
- Boys with serious emotional or behavioral difficulties were more likely to receive services in all school settings.
- Of all the nonschool providers, the emergency department was the only setting where there was a difference in use by sex, with a higher percentage of girls (9.3%) than boys (4.6%) receiving services.
- Summary
- Definitions
- Data sources and methods
- About the authors
- References
- Suggested citation
NCHS Data Brief No. 163, August 2014
PDF Version (580 KB)
Lindsey I. Jones, M.P.H.; Patricia N. Pastor, Ph.D.; Alan E. Simon, M.D.; and Cynthia A. Reuben, M.A.
Key findings
Data from the National Health Interview Survey, 2010–2012
- About 4% of adolescents aged 12–17 had a serious emotional or behavioral difficulty and received nonmedication mental health services in the past 6 months.
- Nearly 71% of adolescents with serious emotional or behavioral difficulties received nonmedication mental health services in the past 6 months.
- Among adolescents with serious emotional or behavioral difficulties, boys were more likely than girls to receive nonmedication mental health services.
- Boys with serious emotional or behavioral difficulties were more likely than girls to receive services in school settings.
- The percentage of boys and girls with serious emotional or behavioral difficulties receiving nonschool services was similar for all settings except for the emergency department.
Mental health is a key component of a child’s overall wellbeing. Previous research using data from the National Health Interview Survey (NHIS) found that about 6% of adolescents have serious emotional or behavioral difficulties (1). Both medication and nonmedication services have been found to be effective for treatment (2–8). Two recent reports from the National Center for Health Statistics have presented estimates of medication use among U.S. adolescents (9–10). The use of prescription medication for emotional or behavioral difficulties was higher among boys than girls (10). This report describes differences between boys and girls in the use of nonmedication mental health services in various school and nonschool settings among adolescents aged 12–17 with serious emotional or behavioral difficulties.
Keywords: mental health treatment, mental health care utilization, children, National Health Interview Survey
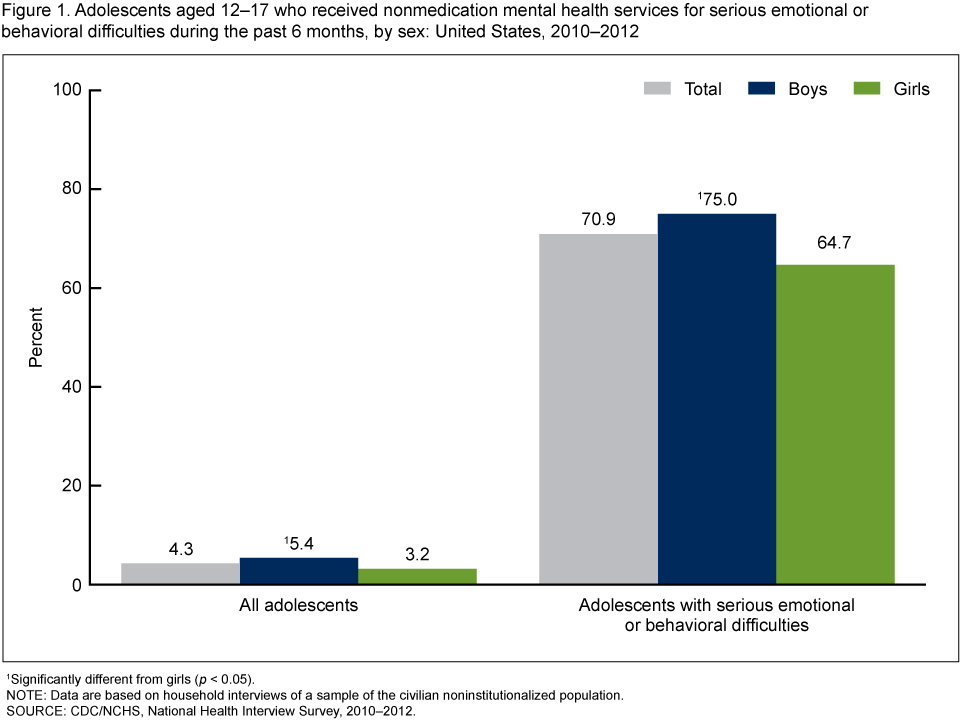
Approximately 4% of adolescents aged 12–17 have a serious emotional or behavioral difficulty and have received nonmedication mental health services in the past 6 months.
Figure 1. Adolescents aged 12–17 who received nonmedication mental health services for serious emotional or behavioral difficulties during the past 6 months, by sex: United States, 2010–2012
1Significantly different from girls (p < 0.05).
NOTE: Data are based on household interviews of a sample of the civilian noninstitutionalized population.
SOURCE: CDC/NCHS, National Health Interview Survey, 2010–2012.
- Among adolescents aged 12–17, boys (5.4%) were more likely than girls (3.2%) to have a serious emotional or behavioral difficulty and receive nonmedication mental health services in the past 6 months (Figure 1).
- Among adolescents with serious emotional or behavioral difficulties, 70.9% received nonmedication mental health services in the past 6 months.
- Among adolescents with serious emotional or behavioral difficulties, boys (75.0%) were more likely than girls (64.7%) to receive nonmedication mental health services.
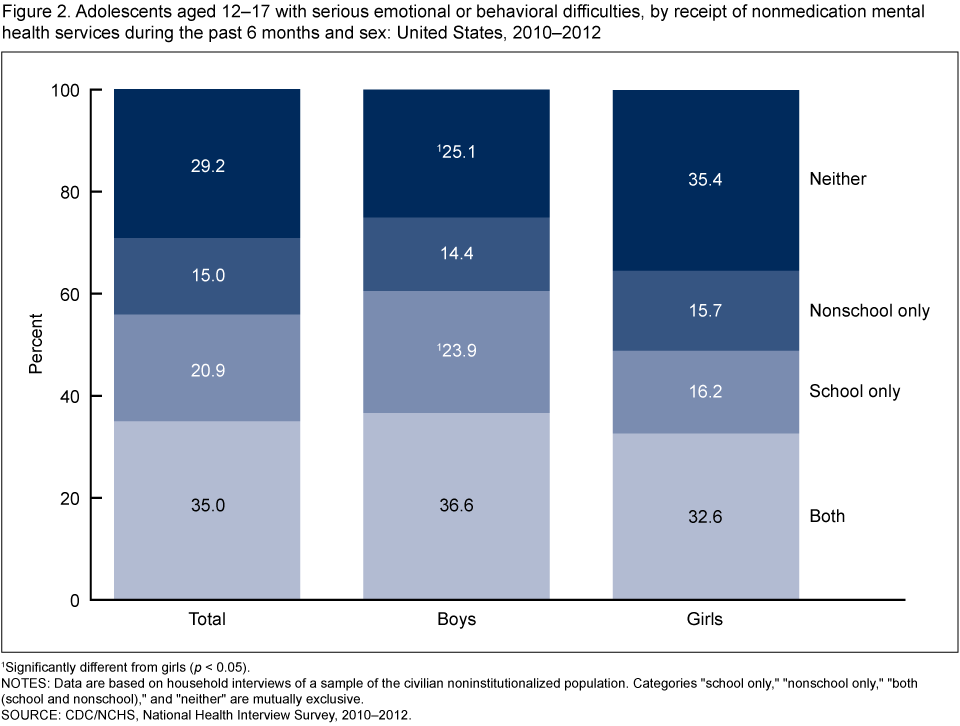
About one in three adolescents aged 12–17 with serious emotional or behavioral difficulties (37% of boys and 33% of girls) received both school and nonschool nonmedication mental health services.
- Approximately 21% of adolescents received school services only, and 15% received nonschool services only (Figure 2).
- Boys (23.9%) were more likely to have received school services only compared with girls (16.2%).
- Girls (35.4%) were more likely to receive neither school nor nonschool services compared with boys (25.1%).
Figure 2. Adolescents aged 12–17 with serious emotional or behavioral difficulties, by receipt of nonmedication mental health services during the past 6 months and sex: United States, 2010–2012
1Significantly different from girls (p < 0.05).
NOTES: Data are based on household interviews of a sample of the civilian noninstitutionalized population. Categories “school only,” “nonschool only,” “both (school and nonschool),” and “neither” are mutually exclusive.
SOURCE: CDC/NCHS, National Health Interview Survey, 2010–2012.
- There was no difference between the percentages of boys and girls receiving both school and nonschool services, and there was no difference between the percentages of boys and girls receiving nonschool services only.
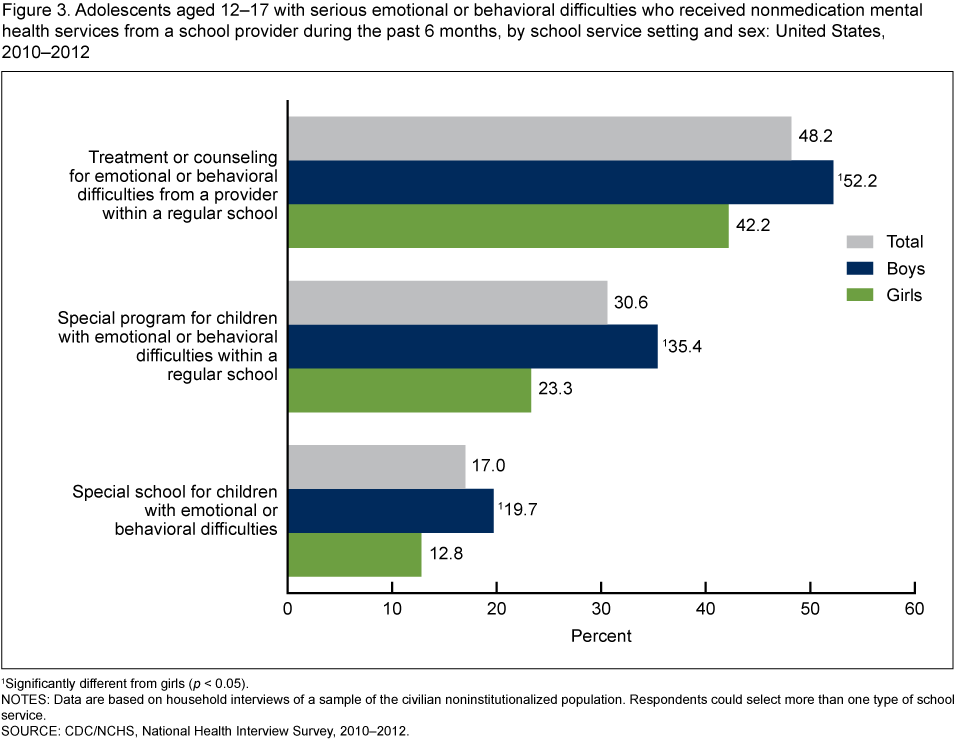
Boys with serious emotional or behavioral difficulties were more likely to receive services in all school settings.
- In 2010–2012, boys (52.2%) were more likely to receive services for emotional or behavioral difficulties from a provider within a regular school compared with girls (42.2%) (Figure 3).
- Boys (35.4%) were more likely to receive services from a special program for children with emotional or behavioral difficulties within a regular school compared with girls (23.3%).
- Boys (19.7%) were more likely to attend a special school for children with emotional or behavioral difficulties compared with girls (12.8%).
Figure 3. Adolescents aged 12–17 with serious emotional or behavioral difficulties who received nonmedication mental health services from a school provider during the past 6 months, by school service setting and sex: United States, 2010–2012
1Significantly different from girls (p < 0.05).
NOTES: Data are based on household interviews of a sample of the civilian noninstitutionalized population. Respondents could select more than one type of school service.
SOURCE: CDC/NCHS, National Health Interview Survey, 2010–2012.
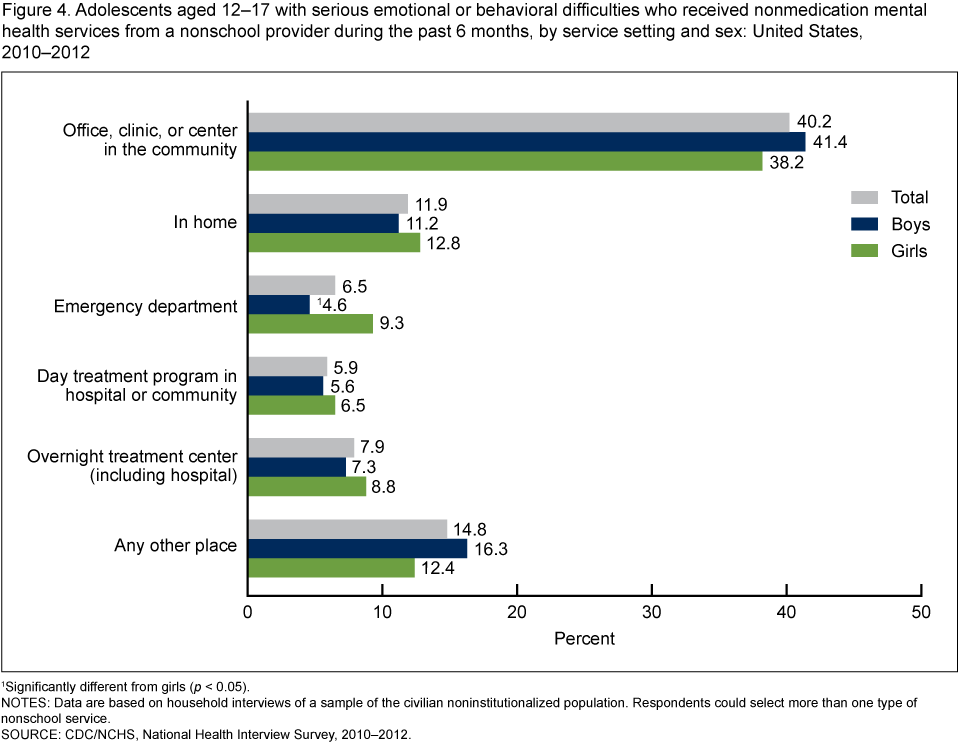
Of all the nonschool providers, the emergency department was the only setting where there was a difference in use by sex, with a higher percentage of girls (9.3%) than boys (4.6%) receiving services.
- More than one-third of adolescents (40.2%) with serious emotional or behavioral difficulties received nonmedication mental health services in an office, clinic, or center in the community in the past 6 months (Figure 4).
- A lower percentage of adolescents also received nonmedication mental health services in the home (11.9%), emergency departments (6.5%), day treatment programs in a hospital or community (5.9%), overnight treatment centers (7.9%), or other places (14.8%).
- There was no difference by sex in the percentage of adolescents receiving nonmedication mental health services provided in an office, clinic, or center in the community; the home; day treatment programs in a hospital or community; overnight treatment centers (including hospitals); or other places.
Figure 4. Adolescents aged 12–17 with serious emotional or behavioral difficulties who received nonmedication mental health services from a nonschool provider during the past 6 months, by service setting and sex: United States, 2010–2012
1Significantly different from girls (p < 0.05).
NOTES: Data are based on household interviews of a sample of the civilian noninstitutionalized population. Respondents could select more than one type of nonschool service.
SOURCE: CDC/NCHS, National Health Interview Survey, 2010–2012.
Summary
An estimated 6% of adolescents have serious emotional or behavioral difficulties (1). During 2010–2012, approximately 71% of adolescents aged 12–17 with serious emotional or behavioral difficulties received nonmedication mental health services in the past 6 months. In general, boys (75.0%) were more likely than girls (64.7%) to have received nonmedication mental health services. Overall, just over 55% of adolescents with serious emotional or behavioral difficulties received school services. Among adolescents with serious emotional or behavioral difficulties, boys (60.5%) were more likely to have received school nonmedication mental health services compared with girls (48.9%).
Compared with girls, boys were more likely to receive services in each of the three school settings: regular school (52.2% compared with 42.2%), special school (19.7% compared with 12.8%), and special program (35.4% compared with 23.3%). Overall, boys and girls did not differ in their use of nonschool nonmedication mental health services. When the settings for the nonschool services were examined individually, only one setting—the emergency department—showed a difference between boys and girls. Girls (9.3%) were more likely than boys (4.6%) to receive nonmedication mental health services in the emergency department. There was no difference between boys and girls in their use of services in an office, home, day treatment program, overnight treatment center, or other location.
Among adolescents with serious emotional or behavioral difficulties, a higher percentage of boys than girls received services in school settings. This finding may be due, in part, to the higher prevalence among boys of externalizing and developmental conditions such as attention deficit hyperactivity disorder (ADHD) and autism spectrum disorders, which negatively affect their school achievement and participation (11–13).
Definitions
Serious emotional or behavioral difficulties: Based on a response of “yes, definite difficulties” or “yes, severe difficulties” to the question, “Overall, do you think that [sample child’s name] has difficulties in any of the following areas: emotions, concentration, behavior, or being able to get along with other people?”
Receipt of nonmedication mental health services: Based on a positive response to use of at least one of the three school mental health services or one of the seven nonschool mental health services. There was no direct question on receipt of nonmedication mental health services; information was obtained from the questions on school and nonschool mental health services (see definitions below).
Receipt of school mental health services: Based on a positive response to any one of the following three questions: “During the past 6 months, did [sample child’s name] a) receive treatment or counseling for these difficulties from school personnel; b) attend a school for students with difficulties with emotions, concentration, behavior, or being able to get along with others; or c) participate in a school program that was just for students with difficulties with emotions, concentration, behavior or being able to get along with others.”
Receipt of nonschool mental health services: Based on a positive response to any one of the following seven questions: “During the past 6 months, did [sample child’s name] receive treatment or counseling for these difficulties: a) from daycare, child care, or play group; b) in an office, clinic, or center in the community; c) in the child’s home; d) in a hospital emergency room or emergency department, crisis center, or emergency shelter; e) at a day treatment program in a hospital or the community; f) at an overnight facility (e.g., hospital, group home, juvenile detention center, foster care home, or other special type of center); or g) other.”
Data sources and methods
This analysis used data from the 2010–2012 NHIS. Interviewers from the U.S. Census Bureau collect NHIS data continuously throughout the year for the Centers for Disease Control and Prevention’s National Center for Health Statistics (NCHS). NHIS includes questions about the health and health care of the civilian noninstitutionalized U.S. population. Interviews are conducted in respondents’ homes. In some instances, follow-ups to complete interviews may be conducted over the telephone. Questions for this analysis are from the household composition section and the Family Core and Sample Child components of the 2010–2012 NHIS. From each family in NHIS, a sample child is randomly selected, and information about the sample child is obtained from an adult residing in the household who is knowledgeable about the child’s health. From 2010 through 2012, information on the sample child was collected for 13,175 adolescents aged 12–17. For more information about NHIS, visit the website.
NHIS is designed to yield a nationally representative sample, and this analysis uses weights to produce national estimates. Data weighting procedures are described in more detail elsewhere (14). Point estimates and estimates of corresponding variances for this analysis were calculated using the SUDAAN software package (15) to account for the complex sample design of NHIS. The Taylor series linearization method was chosen for variance estimation. All estimates shown in this report meet NCHS standards of reliability (relative standard error less than or equal to 30%). Differences between percentages were evaluated using two-sided significance tests at the 0.05 level.
About the authors
Lindsey I. Jones is with CDC’s National Center for Health Statistics, Division of Health Interview Statistics; and Patricia N. Pastor, Alan E. Simon, and Cynthia A. Reuben are with NCHS Office of Analysis and Epidemiology.
References
- Federal Interagency Forum on Child and Family Statistics. America’s children: Key national indicators of well-being, 2013. Washington, DC: U.S. Government Printing Office.
- Silverman WK, Hinshaw SP. The second special issue on evidence-based pyschosocial treatments for children and adolescents: A 10-year update. J Clin Child Adolesc Psychol 37(1):1–7. 2008.
- Jensen PS, Hoagwood K, Petti T. Outcomes of mental health care for children and adolescents: II. Literature review and application of a comprehensive model. J Am Acad Child Adolesc Psychiatry 35(8):1064–77. 1996.
- Durlak JA, Wells AM. Evaluation of indicated preventive intervention (secondary prevention) mental health programs for children and adolescents. Am J Community Psychol 26(5):775–802. 1998.
- Jones D, Godwin J, Dodge KA, Bierman KL, Coie JD, Greenberg MT, et al. Impact of the fast track prevention program on health services use by conduct-problem youth. Pediatrics 125(1):e130–6. 2010.
- Pelham WE, Jr., Fabiano GA. Evidence-based psychosocial treatments for attention-deficit/hyperactivity disorder. J Clin Child Adolesc Psychol 37(1):184–214. 2008.
- Charach A, Dashti B, Carson P, Booker L, Lim CG, Lillie E, et al. Attention deficit hyperactivity disorder: Effectiveness of treatment in at-risk preschoolers; long-term effectiveness in all ages; and variability in prevalence, diagnosis, and treatment. Agency for Healthcare Research and Quality. Rockville, MD. 2011.
- Maalouf FT, Brent DA. Child and adolescent depression intervention overview: what works, for whom and how well? Child Adolesc Psychiatr Clin N Am 21(2):299–312. 2012.
- Jonas BS, Gu Q, Albertorio-Diaz JR. Psychotropic medication use among adolescents: United States, 2005–2010. NCHS data brief, no 135. Hyattsville, MD: National Center for Health Statistics. 2013.
-
Howie LD, Pastor PN, Lukacs SL. Use of medication prescribed for emotional or behavioral difficulties among children aged
6–17 years in the United States, 2011–2012. NCHS data brief, no 148. Hyattsville, MD: National Center for Health Statistics. 2014. - CDC. Prevalence of autism spectrum disorder among children aged 8 years—autism and developmental disabilities monitoring network, 11 sites, United States, 2010. MMWR Surveill Summ 63(2):1–21. 2014.
- Bloom B, Jones LI, Freeman G. Summary health statistics for U.S. children: National Health Interview Survey, 2012. National Center for Health Statistics. Vital Health Stat 10(258). 2013.
- He JP, Burstein M, Schmitz A, Merikangas KR. The strengths and difficulties questionnaire (SDQ): The factor structure and scale validation in U.S. adolescents. J Abnorm Child Psychol 41(4):583–95. 2013.
- Parsons VL, Moriarity C, Jonas K, et al. Design and estimation for the National Health Interview Survey, 2006–2015. National Center for Health Statistics. Vital Health Stat 2(165). 2014.
- RTI International. SUDAAN (Release 11.0.0) [computer software]. 2012.
Suggested citation
Jones LI, Pastor PN, Simon AE, Reuben CA. Use of selected nonmedication mental health services by adolescent boys and girls with serious emotional or behavioral difficulties: United States, 2010–2012. NCHS data brief, no 163. Hyattsville, MD: National Center for Health Statics. 2014.
Copyright information
All material appearing in this report is in the public domain and may be reproduced or copied without permission; citation as to source, however, is appreciated.
National Center for Health Statistics
Charles J. Rothwell, M.S., M.B.A., Director
Jennifer H. Madans, Ph.D., Associate Director for Science
Division of Health Interview Statistics
Jane F. Gentleman, Ph.D., Director