TV Watching and Computer Use in U.S. Youth Aged 12–15, 2012
- Key findings
- What percentage of youth watched TV or used a computer daily?
- Were there differences by sex in the percentage of youth who watched TV or used a computer for 2 hours or less daily?
- Were there differences by race and Hispanic origin in the percentage of youth who watched TV or used a computer for 2 hours or less daily?
- Were there differences by weight status in the percentage of youth who watched TV or used a computer for 2 hours or less daily?
- Summary
- Definitions
- Data sources and methods
- About the authors
- References
- Suggested citation
NCHS Data Brief No. 157, July 2014
PDF Version (628 KB)
Kirsten A. Herrick, Ph.D., M.Sc.; Tala H.I. Fakhouri, Ph.D., M.P.H.; Susan A. Carlson, Ph.D.; and Janet E. Fulton, Ph.D.
Key findings
Data from the National Health and Nutrition Examination Survey (NHANES) and the NHANES National Youth Fitness Survey, 2012
- Nearly all (98.5%) youth aged 12–15 reported watching TV daily.
- More than 9 in 10 (91.1%) youth aged 12–15 reported using the computer daily outside of school.
- In 2012, 27.0% of youth aged 12–15 had 2 hours or less of TV plus computer use daily.
- Among youth aged 12–15, girls (80.4%) were more likely to use the computer 2 hours or less daily when compared with boys (69.4%).
- Fewer non-Hispanic black youth aged 12–15 (53.4%) reported watching 2 hours or less of TV daily than non-Hispanic white (65.8%) and Hispanic (68.7%) youth.
Excessive screen-time behaviors, such as using a computer and watching TV, for more than 2 hours daily have been linked with elevated blood pressure, elevated serum cholesterol, and being overweight or obese among youth (1–3). Additionally, screen-time behavior established in adolescence has been shown to track into adulthood (4). The National Heart, Lung, and Blood Institute-supported Expert Panel and the American Academy of Pediatrics (AAP) recommend that children limit leisure screen time to 2 hours or less daily (5,6). This report presents national estimates of TV watching and computer use outside of the school day.
Keywords: screen time, NHANES National Youth Fitness Survey, National Health and Nutrition Examination Survey
What percentage of youth watched TV or used a computer daily?
Almost all (98.5%) youth aged 12–15 reported watching TV, and 91.1% reported using the computer daily in the past 30 days. More than one-quarter of youth (26.5%) reported some daily computer use but for less than 1 hour a day. Almost one-third of youth (29.5%) watched TV for 2 hours a day. The percentage of youth watching TV for 5 hours or more a day was 6.9%, and 5.1% of youth used a computer for 5 hours or more a day (Figure 1).
Figure 1. Percentage of youth aged 12–15 reporting TV watching and computer use daily, by number of hours: United States, 2012
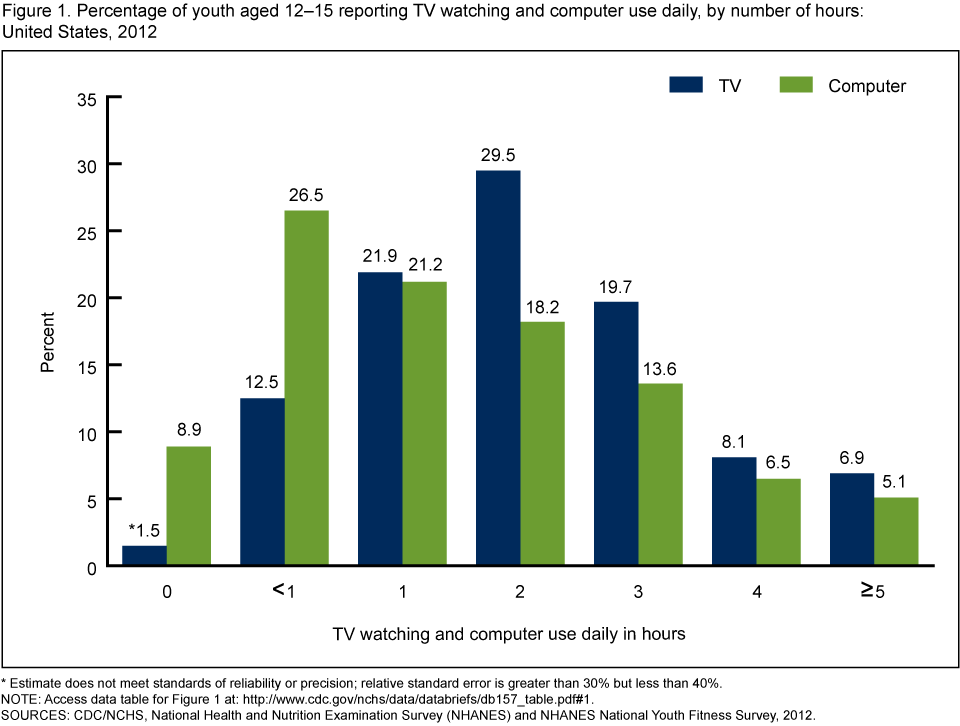
* Estimate does not meet standards of reliability or precision; relative standard error is greater than 30% but less than 40%.
NOTE: Access data table for Figure 1 [PDF – 131KB].
SOURCES: CDC/NCHS, National Health and Nutrition Examination Survey (NHANES) and NHANES National Youth Fitness Survey, 2012.
Were there differences by sex in the percentage of youth who watched TV or used a computer for 2 hours or less daily?
Over one-quarter (27.0%) of youth aged 12–15 met the recommended limit of 2 hours or less of TV plus computer use daily. The percentage of youth reporting 2 hours or less of TV plus computer use did not differ by sex. No sex differences were observed in the percentage of youth who watched TV for 2 hours or less daily; however, computer use did show a sex difference: 8 in 10 (80.4%) girls and almost 7 in 10 (69.4%) boys reported using a computer for 2 hours or less daily (Figure 2).
Figure 2. Percentage of youth aged 12–15 reporting 2 hours or less of TV viewing and computer use daily, by sex: United States, 2012
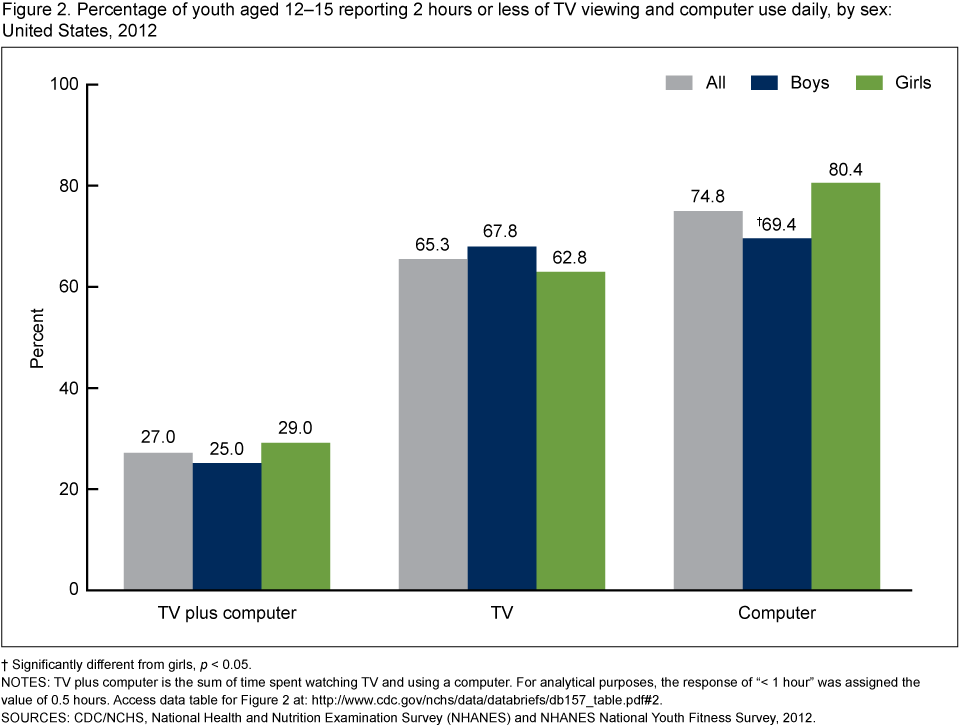
† Significantly different from girls, p < 0.05.
NOTES: TV plus computer is the sum of time spent watching TV and using a computer. For analytical purposes, the response of “< 1 hour” was assigned the value of 0.5 hours. Access data table for Figure 2 [PDF – 131KB].
SOURCES: CDC/NCHS, National Health and Nutrition Examination Survey (NHANES) and NHANES National Youth Fitness Survey, 2012.
Were there differences by race and Hispanic origin in the percentage of youth who watched TV or used a computer for 2 hours or less daily?
The percentage of youth reporting TV plus computer use for 2 hours or less daily was higher for non-Hispanic white (29.4%) than non-Hispanic black (20.0%) youth. There were differences by race and Hispanic origin in the percentage of youth who watched TV for 2 hours or less, but not for computer use. Just over one-half (53.4%) of non-Hispanic black youth reported 2 hours or less of TV watching daily compared with roughly two-thirds of non-Hispanic white (65.8%) and Hispanic (68.7%) youth (Figure 3).
Figure 3. Percentage of youth aged 12–15 reporting 2 hours or less of TV viewing and computer use daily, by race and Hispanic origin: United States, 2012
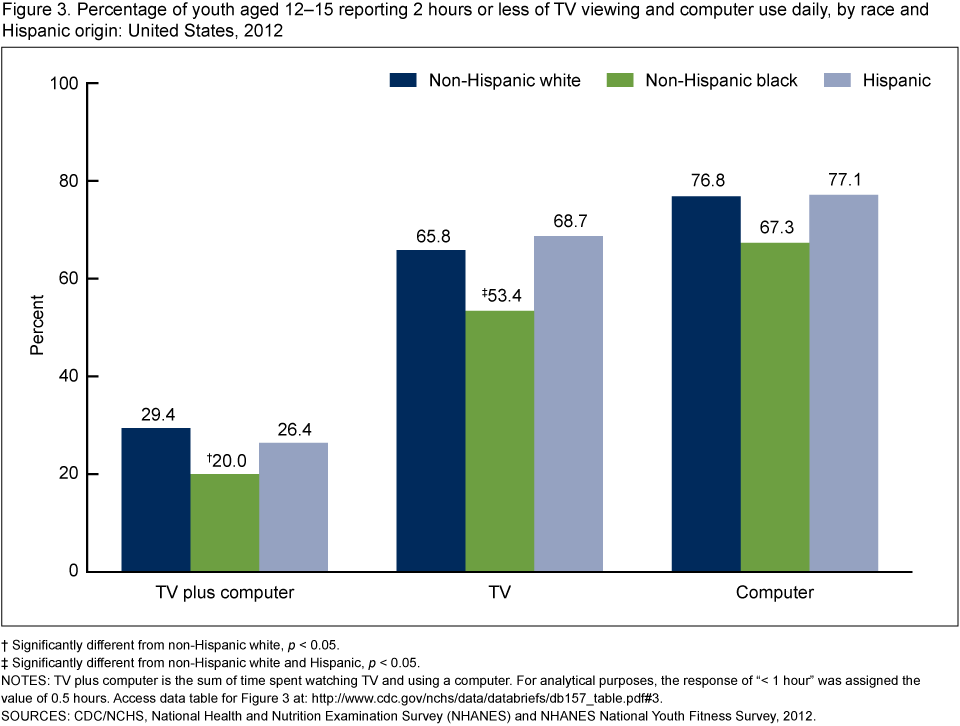
† Significantly different from non-Hispanic white, p < 0.05.
‡ Significantly different from non-Hispanic white and Hispanic, p < 0.05.
NOTES: TV plus computer is the sum of time spent watching TV and using a computer. For analytical purposes, the response of “< 1 hour” was assigned the value of 0.5 hours. Access data table for Figure 3 [PDF – 131KB].
SOURCES: CDC/NCHS, National Health and Nutrition Examination Survey (NHANES) and NHANES National Youth Fitness Survey, 2012.
Were there differences by weight status in the percentage of youth who watched TV or used a computer for 2 hours or less daily?
As weight status increased, the percentage of youth aged 12–15 who reported 2 hours or less of TV plus computer use decreased. Among underweight or normal-weight youth, 30.6% reported 2 hours or less of TV plus computer use daily compared with 23.1% and 20.0% for their overweight and obese peers, respectively. As weight status increased, the percentage of youth who watched TV for 2 hours or less daily decreased. No differences in computer use by weight status were found (Figure 4).
Figure 4. Percentage of youth aged 12–15 reporting 2 hours or less of TV viewing and computer use daily, by weight status: United States, 2012
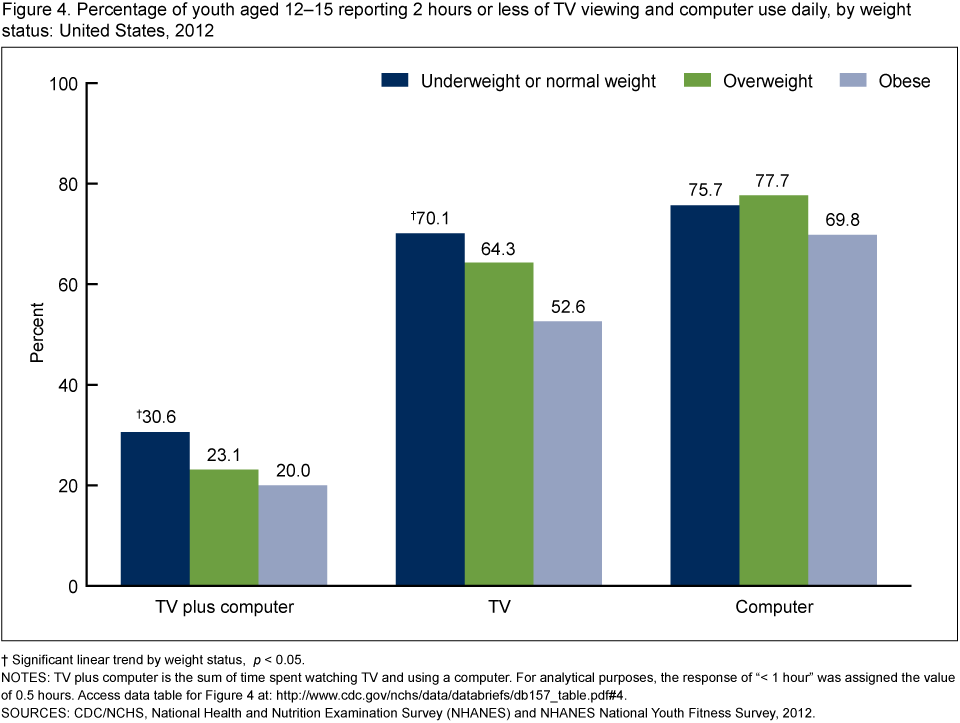
† Significant linear trend by weight status, p < 0.05.
NOTES: TV plus computer is the sum of time spent watching TV and using a computer. For analytical purposes, the response of “< 1 hour” was assigned the value of 0.5 hours. Access data table for Figure 4 [PDF -131KB].
SOURCES: CDC/NCHS, National Health and Nutrition Examination Survey (NHANES) and NHANES National Youth Fitness Survey, 2012.
Summary
In 2012, one-quarter of boys (25.0%) and less than one-third of girls (29.0%) aged 12–15 met the AAP-recommended limit of 2 hours or less of screen time daily. This estimate was based on reported TV watching and computer use outside of school and included video games. One-fifth (20.0%) of non-Hispanic black youth met the recommended limit compared with more than one-quarter (29.4%) of non-Hispanic white and about one-quarter (26.4%) of Hispanic youth. As weight status increased, the proportion of youth who met the recommended limit of 2 hours or less of daily screen time decreased from 30.6% among underweight or normal weight youth to 20.0% in obese youth.
The majority of U.S. youth watched TV or used a computer daily. However, the patterns of TV and computer use were different for demographic and weight status groups. TV use varied by race and Hispanic origin and weight status. The proportion of non-Hispanic black youth reporting 2 hours or less of TV watched daily was smaller compared with non-Hispanic white and Hispanic youth. Additionally, as weight status increased, the proportion of youth who reported watching 2 hours or less of TV daily decreased. The only difference in computer use was found by sex, with fewer boys than girls using a computer for 2 hours or less daily.
Definitions
TV watching and computer use: Respondents were asked, “Over the past 30 days, on average how many hours per day did you sit and watch TV or videos?” Response categories included: “I don’t watch TV or videos,” “< 1 hour,” “1 hour,” “2 hours,” “3 hours,” “4 hours,” and “5 or more hours.” Similarly, for computer use, respondents were asked, “Over the past 30 days, on average how many hours per day did you use a computer or play computer games outside of school? Include PlayStation, Nintendo DS, or other portable video games.” The same response categories used for watching TV were employed for computer use. Time spent watching TV and using a computer was summed to examine combined TV plus computer use. For analytical purposes, the response of “< 1 hour” was assigned the value of 0.5 hours. Responses were dichotomized to report the percentage of respondents with 2 hours or less of TV plus computer use in a typical day.
The TV watching and computer-use questionnaire provided response options that were in 1-hour increments (except for “< 1 hour”). Respondents had to choose the response category that best matched their answers and may have rounded their values up or down. This could result in an under- or overestimation in the percentages of youth reporting 2 hours or less. This limitation may be compounded when combining the amount of TV watching and computer use. Future work that examines the reliability and validity of these questions in categorizing youth into an indicator of 2 hours or less may be warranted.
Weight status: Body mass index (BMI) is calculated as weight in kilograms divided by height in meters squared. Underweight or normal weight is a BMI less than the age- and sex-specific 85th percentiles on the 2000 CDC Growth Charts. Overweight is a BMI greater than or equal to the 85th percentiles, but less than the 95th age- and sex-specific percentiles on the growth charts. Obesity is a BMI greater than or equal to the 95th age- and sex-specific percentiles (7).
Data sources and methods
Data from the 2012 National Health and Nutrition Examination Survey (NHANES) and the 2012 NHANES National Youth Fitness Survey (NNYFS) were used for these analyses. NHANES and NNYFS were conducted by the Centers for Disease Control and Prevention’s National Center for Health Statistics. NHANES assesses the health and nutritional status of the entire civilian noninstitutionalized U.S. population. The 2012 NNYFS was a nationally representative survey of physical fitness in the resident noninstitutionalized U.S. population aged 3–15 years. NNYFS excluded all children in supervised care or custody in institutional settings and any other U.S. citizens residing outside the 50 states and the District of Columbia. Both NHANES and NNYFS collected TV watching and computer use through a questionnaire administered in the home. Participants were then asked to attend a standardized physical examination in specially equipped mobile centers.
Both NHANES and NNYFS samples were selected using a complex, multistage, probability sampling design. NNYFS was conducted in conjunction with the 2012 NHANES, with the NNYFS sample selected from an independent sample of dwelling units within the segments selected for NHANES. The sample design of NNYFS did not include oversampling by race and ethnicity.
Sample weights, which account for the differential probabilities of selection, nonresponse, and noncoverage, were incorporated into the estimation process. The standard errors of the percentages were estimated using Taylor series linearization, a method that incorporates the sample design.
Differences between groups were evaluated using a t statistic at the p < 0.05 significance level. Test for trends by weight status were evaluated using linear regression, and the significance level was set at p < 0.05. All differences reported are statistically significant unless otherwise indicated. Statistical analyses were conducted using the SAS System for Windows (release 9.3; SAS Institute Inc, Cary, N.C.) and SUDAAN (release 11.0; RTI International, Research Triangle Park, N.C.).
About the authors
Kirsten A. Herrick and Tala H.I. Fakhouri are with CDC’s National Center for Health Statistics, Division of Health and Nutrition Examination Surveys. Susan A. Carlson and Janet E. Fulton are with CDC’s National Center for Chronic Disease Prevention and Health Promotion, Division of Nutrition, Physical Activity, and Obesity.
References
- Tremblay MS, LeBlanc AG, Kho ME, Saunders TJ, Larouche R, Colley RC, et al. Systematic review of sedentary behaviour and health indicators in school-aged children and youth. Int J Behav Nutr Phys Act 8:98. 2011.
- Goldfield GS, Saunders TJ, Kenny GP, Hadjiyannakis S, Phillips P, Alberga AS, et al. Screen viewing and diabetes risk factors in overweight and obese adolescents. Am J Prev Med 44(4 Suppl 4):S364–70. 2013.
- Mark AE, Janssen I. Relationship between screen time and metabolic syndrome in adolescents. J Public Health (Oxf) 30(2):153–60. 2008.
- Grøntved A, Ried-Larsen M, Møller NC, Kristensen PL, Wedderkopp N, Froberg K, et al. Youth screen-time behaviour is associated with cardiovascular risk in young adulthood: The European Youth Heart Study. Eur J Prev Cardiol 21(1):49–56. 2014.
- Expert Panel on Integrated Guidelines for Cardiovascular Health Risk Reduction in Children and Adolescents. Expert panel on integrated guidelines for cardiovascular health and risk reduction in children and adolescents: Summary report. Pediatrics 128 Suppl 5:S213–56. 2011.
- American Academy of Pediatrics Council on Communications and Media. Children, adolescents, and the media. Pediatrics 132(5):958–61. 2013.
- Kuczmarski RJ, Ogden CL, Guo SS, et al. 2000 CDC growth charts for the United States: Methods and development. National Center for Health Statistics. Vital Health Stat 11(246). 2002.
Suggested citation
Herrick KA, Fakhouri THI, Carlson SA, Fulton JE. TV watching and computer use in U.S. youth aged 12–15, 2012. NCHS data brief, no 157. Hyattsville, MD: National Center for Health Statistics. 2014.
Copyright information
All material appearing in this report is in the public domain and may be reproduced or copied without permission; citation as to source, however, is appreciated.
National Center for Health Statistics
Charles J. Rothwell, M.S., M.B.A., Director
Jennifer H. Madans, Ph.D., Associate Director for Science
Division of Health and Nutrition Examination Surveys
Kathryn S. Porter, M.D., M.S., Director