Recent Declines in Induction of Labor by Gestational Age
- Key findings
- After increasing nearly every year since 1990, the induction of labor rate for singleton births declined in 2011 and 2012.
- From 2006 through 2012, induction rates declined at each gestational week 35–38, with the greatest decline at 38 weeks.
- From 2006 through 2012, induction rates at 38 weeks of gestation declined for all maternal age groups under 40.
- Changes in induction rates at 35–38 weeks varied by race and Hispanic origin.
- From 2006 through 2012, induction rates at 38 weeks declined in nearly three-quarters of all states.
- Summary
- Definitions
- Data source and methods
- About the authors
- References
- Suggested citation
NCHS Data Brief No. 155, June 2014
PDF Version (728 KB)
Michelle J.K. Osterman, M.H.S, and Joyce A. Martin, M.P.H.
Key findings
Data from the Natality Data File, National Vital Statistics System
- After nearly 20 years of consecutive increases, induction of labor for singleton births reached a high of 23.8% in 2010, then declined in 2011 (23.7%) and 2012 (23.3%).
- Trends in induction rates vary by gestational age, with rates for most gestational age groups declining since 2010. Induction rates for births at 36, 37, and 38 weeks have declined since 2006, with the largest decrease at 38 weeks.
- From 2006 through 2012, induction rates at 38 weeks of gestation declined for all maternal age groups under 40 and for each of the largest race and Hispanic origin groups.
- Induction rates at 38 weeks declined for 36 states and the District of Columbia (DC) from 2006 through 2012, with declines ranging from 5% to 48%; rates for 31 states and DC declined at least 10%.
During the 1980s, 1990s, and through 2006, the length of pregnancies in the United States shortened (1). From 1981 through 2006, the proportion of infants born at less than 39 completed weeks of gestation increased nearly 60%, while births at 39 weeks or more declined more than 20%. This shift in the gestational age distribution has been associated with greater use of cesarean delivery and induction of labor prior to full term (2–4). In more recent years, however, the trend towards shorter gestational ages has partially reversed. Since 2006, births delivered at less than 39 weeks have declined (down 12%), and births at 39 weeks or more have increased (up 9%) (1). This report explores trends in induction of labor for singleton births by gestational age, maternal age, race and Hispanic origin, and state for 2006–2012.
Keywords: race, Hispanic origin, maternal age
After increasing nearly every year since 1990, the induction of labor rate for singleton births declined in 2011 and 2012.
Figure 1. Induction of labor, by gestational age: United States, 1990–2012
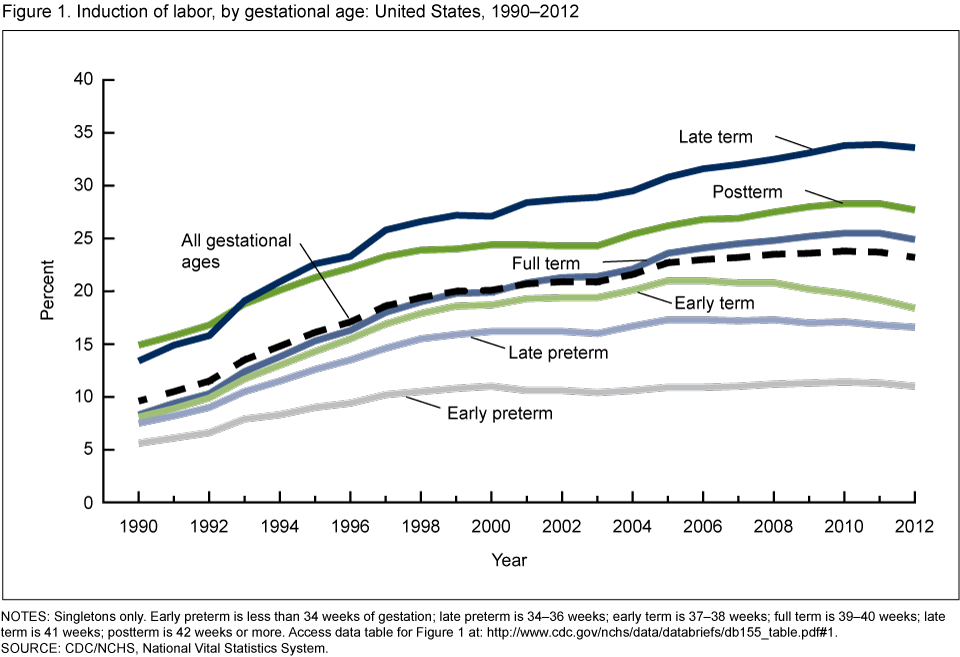
NOTES: Singletons only. Early preterm is less than 34 weeks of gestation; late preterm is 34–36 weeks; early term is 37–38 weeks; full term is 39–40 weeks; late term is 41 weeks; postterm is 42 weeks or more. Access data table for Figure 1 [PDF – 142KB].
SOURCE: CDC/NCHS, National Vital Statistics System.
The rate of induction of labor more than doubled from 1990 through 2010, from 9.6% to 23.8% (Figure 1). Induction rates were at least twice as high in 2010 as in 1990 for all gestational age groups except postterm births, which rose 90%.
The overall induction rate declined slightly in 2011, to 23.7% (from 23.8% in 2010), and then declined again in 2012, to 23.3%.
There has been some variation in the year in which the decline in rates of labor induction began. Induction rates for late preterm and early-term births declined for the first time in 2007 and have done so nearly every year since. From 2006 through 2012, induction rates declined 4% for late preterm births (17.3% to 16.6%) and 12% for early-term births (21.0% to 18.4%). In contrast, rates for early preterm, and full-, late-, and postterm births were unchanged from 2010 to 2011, but declined in 2012 (1% to 3%).
From 2006 through 2012, induction rates declined at each gestational week 35–38, with the greatest decline at 38 weeks.
Different patterns emerged in induction rate trends from 2006 through 2012 for late preterm and early-term births (Figure 2). The largest changes occurred among early-term births, with induction rates declining at both 37 (down 6%) and 38 (down 16%) weeks.
Figure 2. Induction of labor at each gestational week 34–38: United States,
2006–2012
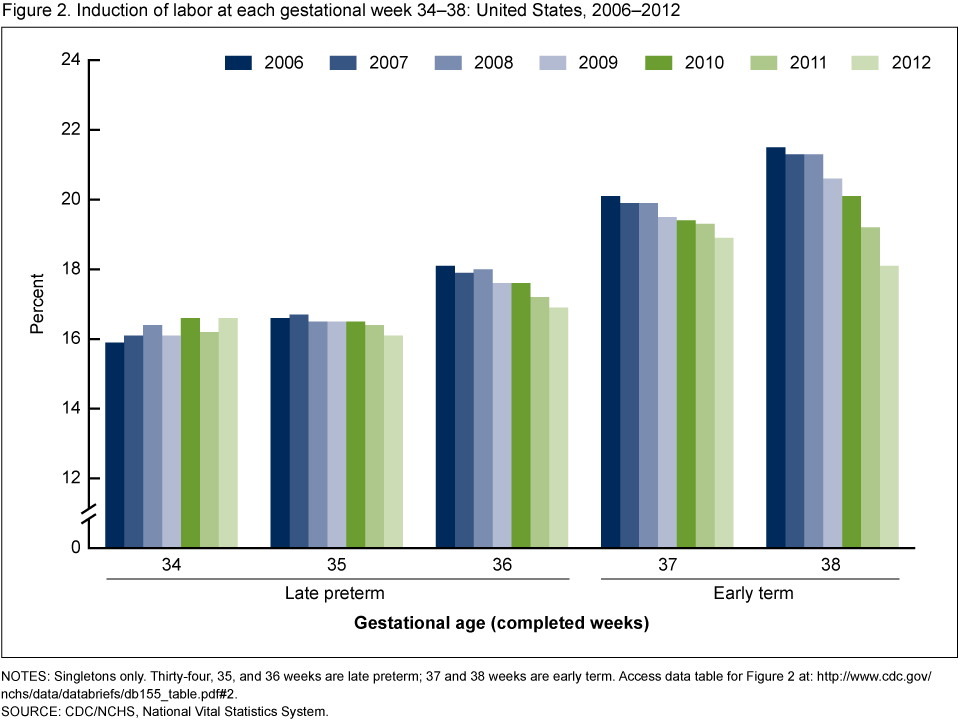
NOTES: Singletons only. Thirty-four, 35, and 36 weeks are late preterm; 37 and 38 weeks are early term. Access data table for Figure 2 [PDF – 142KB].
SOURCE: CDC/NCHS, National Vital Statistics System.
Among late preterm births, induction rates at 35 weeks declined 3%. At 36 weeks, the rate was down 7%. In contrast, induction rates at 34 weeks fluctuated from 15.9% (2006) to 16.6% (2010 and 2012), increasing 4% during the study period.
For each week 36–38, most of the decline has occurred since 2008.
From 2006 through 2012, induction rates at 38 weeks of gestation declined for all maternal age groups under 40.
Trends in induction rates at each week 35–38 varied by maternal age from 2006 through 2012 (Figure 3). At 38 weeks, induction rates declined for all maternal age groups under 40, dropping 13%–19% for women in their 20s and 30s.
Figure 3. Change in induction rates at each gestational week 35–38, by age of mother: United States, 2006 and 2012
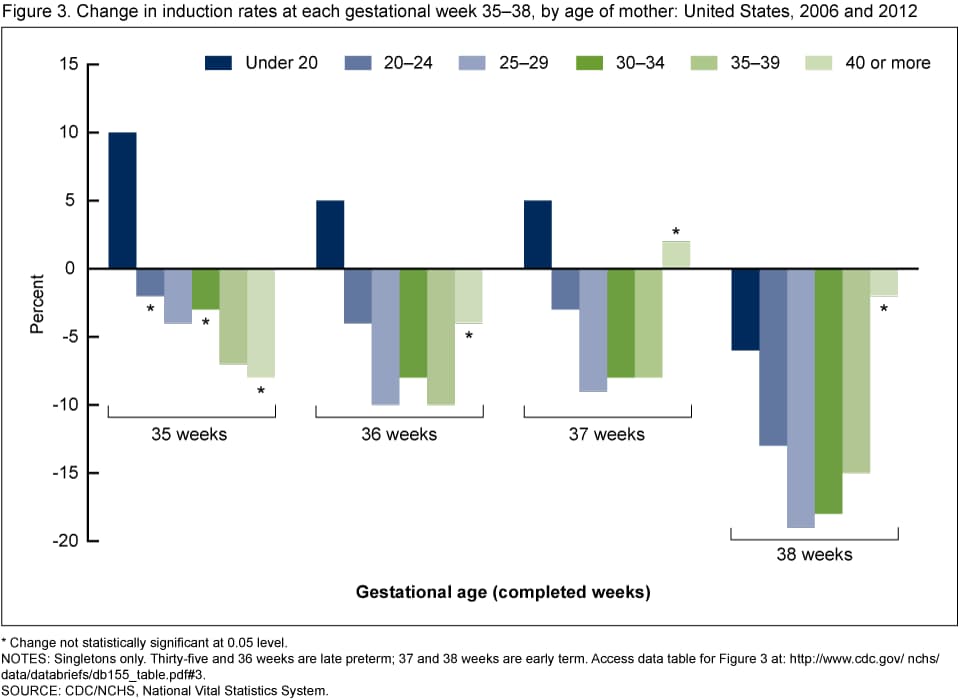
*Change not statistically significant at 0.05 level.
NOTES: Singletons only. Thirty-five and 36 weeks are late preterm; 37 and 38 weeks are early term. Access data table for Figure 3 [PDF – 142KB].
SOURCE: CDC/NCHS, National Vital Statistics System.
At 36 and 37 weeks, induction rates also declined among women in their 20s and 30s, with rates for women aged 25–29 dropping 9%–10% from 2006 through 2012.
Induction rates at 35 weeks declined for women aged 25–29 (4%) and 35–39 (7%) from 2006 through 2012.
Patterns varied for the youngest and oldest moms. Whereas induction rates at 38 weeks declined for women under 20 from 2006 through 2012, rates at 35, 36, and 37 weeks increased 5%–10% for this age group. Induction rates for women aged 40 and over were essentially unchanged for all weeks 35–38 during this time.
Changes in induction rates at 35–38 weeks varied by race and Hispanic origin.
The largest changes for all groups from 2006 through 2012 were at 38 weeks (Figure 4). Induction rates were down for all three race and ethnicity groups: non-Hispanic white (down 19%), non-Hispanic black (down 3%), and Hispanic (down 7%). For non-Hispanic white women, the induction rate at 38 weeks dropped from 25.9% to 21.1%.
Figure 4. Change in induction rates at each gestational week 35–38, by race and Hispanic origin: United States, 2006 and 2012
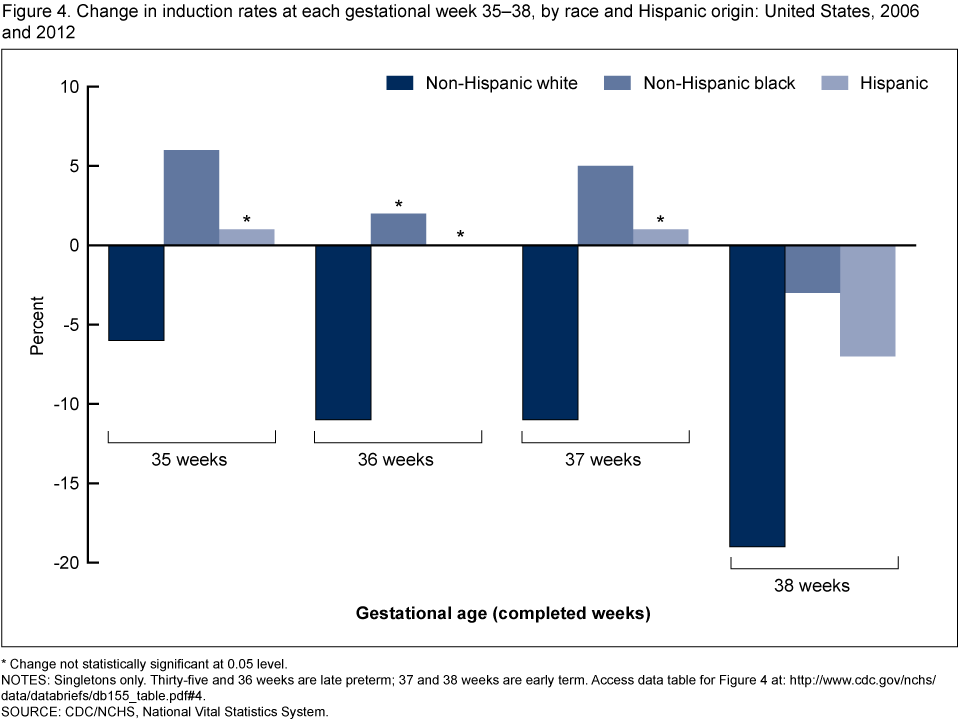
*Change not statistically significant at 0.05 level.
NOTES: Singletons only. Thirty-five and 36 weeks are late preterm; 37 and 38 weeks are early term. Access data table for Figure 4 [PDF – 142KB].
SOURCE: CDC/NCHS, National Vital Statistics System.
Changes at weeks 35–37 were less consistent by race and Hispanic origin. Rates for non-Hispanic white women decreased 6%–11% for all three gestational weeks. In contrast, rates for non-Hispanic black women increased at least 5% at 35 and 37 weeks and were unchanged at 36 weeks. Rates for Hispanic women were unchanged at 35, 36, and 37 weeks.
From 2006 through 2012, induction rates at 38 weeks declined in nearly three-quarters of all states.
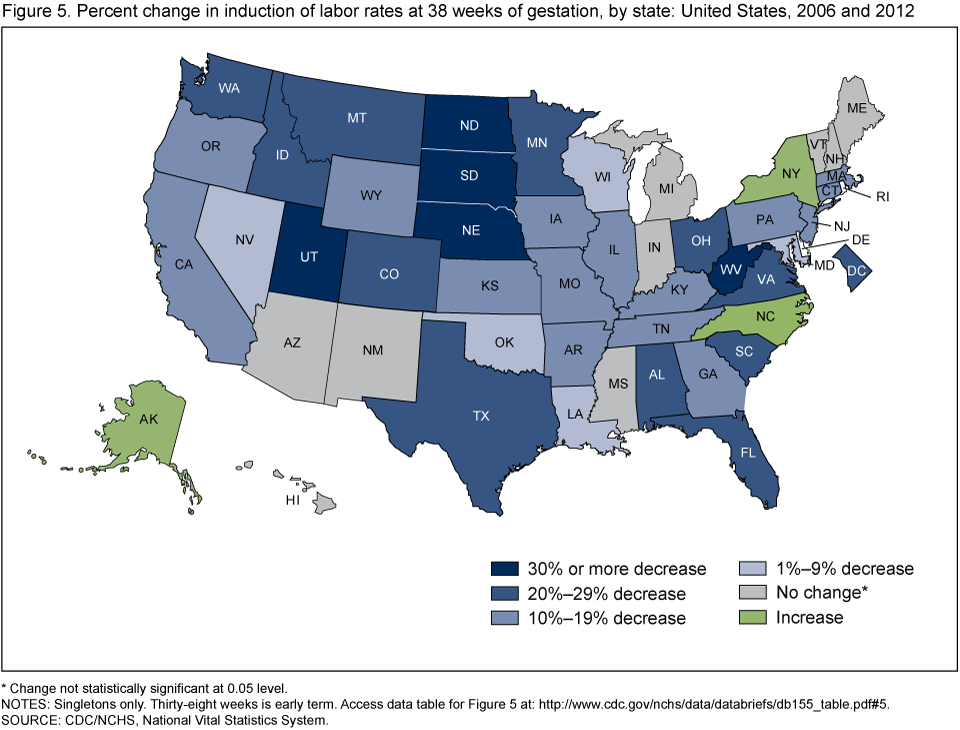
The largest declines in labor induction for the nation occurred at 38 weeks of gestation (Figure 5). Declines in labor induction occurred for almost 3 out of 4 states over the study period. For 36 states and the District of Columbia (DC), induction rates at 38 weeks were lower in 2012 than in 2006. Declines ranged from 5% in Maryland to 48% in Utah. Rates declined at least 10% in 31 states and DC; rates in 5 states dropped at least 30% during this time.
Rates at 38 weeks increased for Alaska (33%), New York (11%), and North Carolina (9%) from 2006 through 2012; rates for the remaining 11 states were unchanged.
Figure 5. Percent change in induction of labor rates at 38 weeks of gestation, by state: United States, 2006 and 2012
*Change not statistically significant at 0.05 level.
NOTES: Singletons only. Thirty-eight weeks is early term. Access data table for Figure 5 [PDF – 142KB].
SOURCE: CDC/NCHS, National Vital Statistics System.
Summary
Following nearly 2 decades of steady increases during which the rate of induction of labor nearly doubled, the use of medical or surgical means to stimulate labor before spontaneous labor fell slightly in 2011, and again in 2012. Induction rates were down for all gestational age categories from 2010 through 2012. The onset of the decline varied by gestational age, with rates for 35–38 weeks beginning to trend earlier than rates for other gestational ages.
Declines in induction rates at 35–38 weeks were observed for all maternal age groups 20–39, with the largest declines by gestational age reported at 38 weeks. Changes in induced labor for weeks 35–37 by race and Hispanic origin were limited to non-Hispanic white women; however, rates at 38 weeks declined among each of the race and Hispanic origin groups studied, with declines ranging from 3% to 19%. Rates of induction of labor at 38 weeks also fell for most states (36 states and DC) from 2006 through 2012, with declines by at least one-fifth reported for 16 states and DC. An earlier report that examined changes in cesarean delivery rates by gestational age for 2009–2011 found similar declines in cesarean delivery at 38 weeks (5).
The decline in induction rates at 35–38 weeks from 2006 is concurrent with the decline in overall rates of late preterm (34–36 weeks) and early-term (37–38 weeks) births (1). Changes in induction of labor, particularly at 35–38 weeks, may be associated with changes in obstetric practice, as research has demonstrated greater risks of morbidity and mortality among infants delivered during these weeks compared with those delivered later in pregnancy (3,6,7).
Definitions
Induction of labor: Initiation of uterine contractions by medical and/or surgical means for the purpose of delivery before the spontaneous onset of labor (i.e., before labor has begun).
Induction rate: Births with induction of labor per 100 births.
Singleton birth: Individual live birth in a singleton (one fetus) pregnancy.
Singleton induction rate: Number of labor inductions for singleton births per 100 singleton births.
Gestational age categories:
Early preterm: Births prior to 34 completed weeks of gestation.
Late preterm: Births at 34–36 completed weeks of gestation.
Early term: Births at 37–38 completed weeks of gestation.
Full term: Births at 39–40 completed weeks of gestation.
Late term: Births at 41 completed weeks of gestation.
Postterm: Births at 42 or more completed weeks of gestation.
Data source and methods
This report is based on data from the Natality Data File from the National Vital Statistics System. The vital statistics natality file includes information on a wide range of maternal and infant demographic and health characteristics for all births occurring in the United States. Final data may also be accessed from the interactive data access tool, VitalStats (8).
This data brief focuses on births in singleton deliveries, which make up the bulk of all newborns (96.6% in 2012). Births in multiple deliveries are excluded because of differences in the way labor and delivery is managed for multiple gestation pregnancies.
The primary measure used to determine gestational age is the interval between the first day of the mother’s last normal menstrual period (LMP) and the date of birth. The clinical or obstetric estimate of gestation is substituted where the LMP is missing or inconsistent with birthweight (9).
References to rate increases or decreases indicate statistically significant differences. Computations exclude records with missing data.
Levels of missing data for induction of labor have been consistently low during the study period, ranging only from 0.2% to 0.6% (10). It is important to note, however, that induction of labor is underreported on the birth certificate. According to a validity study in two states, the sensitivity of the induction of labor question was substantial (86.0% chance that what was captured on the birth certificate was actually in the medical record) for one state and low (45.9%) for the other. For more details, see “Assessing the Quality of Medical and Health Data From the 2003 Birth Certificate Revision: Results From Two States” (11).
About the authors
Michelle J.K. Osterman and Joyce A. Martin are with CDC’s National Center for Health Statistics, Division of Vital Statistics, Reproductive Statistics Branch.
References
- Martin JA, Hamilton BE, Osterman MJK, et al. Births: Final data for 2012. National vital statistics reports; vol 62 no 9. Hyattsville, MD: National Center for Health Statistics. 2013.
- MacDorman MF, Declercq E, Zhang J. Obstetrical intervention and the singleton preterm birth rate in the United States from 1991–2006. Am J Public Health 100(11):2241–7. 2010.
- Engle WA, Kominiarek MA. Late preterm infants, early term infants, and timing of elective deliveries. Clin Perinatol 35(2):325–41. 2008.
- Ehrenthal DB, Hoffman MK, Jiang X, Ostrum G. Neonatal outcomes after implementation of guidelines limiting elective delivery before 39 weeks of gestation. Obstet Gynecol 118(5):1047–55. 2011.
- Osterman MJK, Martin JA. Changes in cesarean delivery rates by gestational age: United States, 1996–2011. NCHS data brief, no 124. Hyattsville, MD: National Center for Health Statistics. 2013.
- Ashton DM. Elective delivery at less than 39 weeks. Curr Opin Obstet Gynecol 22(6):506–10. 2010.
- American College of Obstetricians and Gynecologists. ACOG committee opinion no. 561: Nonmedically indicated early-term deliveries. Obstet Gynecol 121(4):911–5. 2013.
- NCHS. VitalStats.
- NCHS. User guide to the 2012 natality public use file [PDF – 1.40MB]. Annual product 2013.
- NCHS. User guide to the 2006–2011 natality public use files. Annual products 2013.
- Martin JA, Wilson EC, Osterman MJK, et al. Assessing the quality of medical and health data from the 2003 birth certificate revision: Results from two states. National vital statistics reports; vol 62 no 2. Hyattsville, MD: National Center for Health Statistics. 2013.
Suggested citation
Osterman MJK, Martin JA. Recent declines in induction of labor by gestational age. NCHS data brief, no 155. Hyattsville, MD: National Center for Health Statistics. 2014.
Copyright information
All material appearing in this report is in the public domain and may be reproduced or copied without permission; citation as to source, however, is appreciated.
National Center for Health Statistics
Charles J. Rothwell, M.S., M.B.A., Director
Jennifer H. Madans, Ph.D., Associate Director for Science
Division of Vital Statistics
Delton Atkinson, M.P.H., M.P.H., P.M.P., Director