First Births to Older Women Continue to Rise
- Key findings
- First birth rates for women 35–39 generally increased from the mid-1970s to 2012, while steady increases for women 40–44 began later in the early-1980s.
- First birth rates for women aged 35–39 rose among all race and Hispanic origin groups from 1990 to 2012.
- First birth rates for women aged 40–44 increased steadily among all race and Hispanic origin groups from 1990 to 2012.
- First birth rates for women aged 35–39 rose in nearly all states from 2000 to 2012.
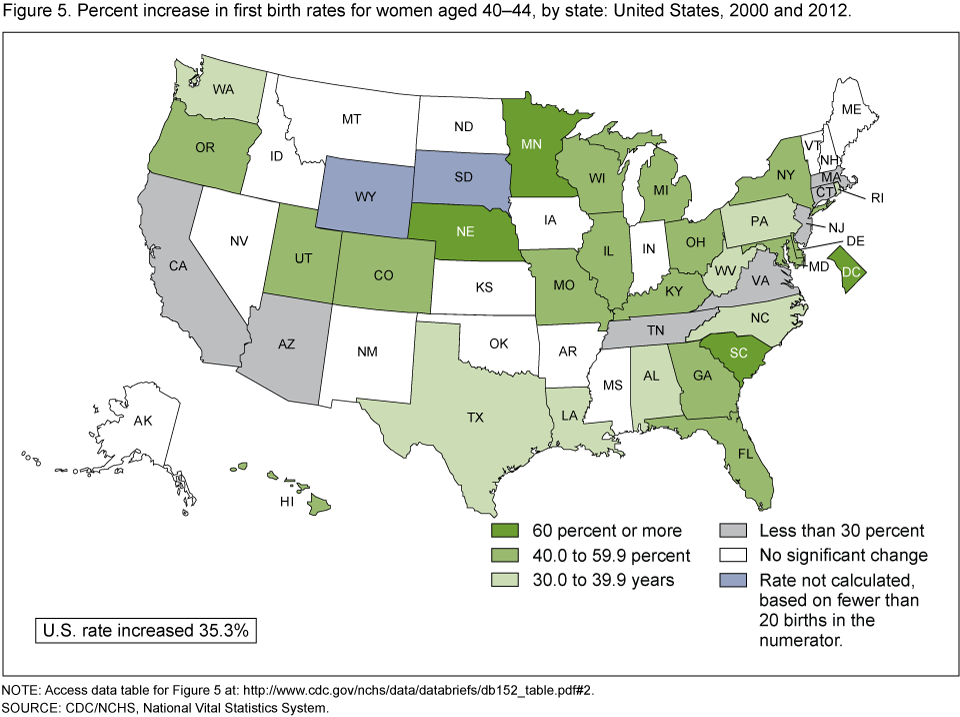
- Thirty-three states and DC had an increase in the first birth rates for women aged 40–44 from 2000 to 2012.
- Summary
- Definitions
- Data sources and methods
- About the authors
- References
- Suggested citation
NCHS Data Brief No. 152, May 2014
PDF Version (691 KB)
T.J. Mathews, M.S.; and Brady E. Hamilton, Ph.D.
Key findings
Data from the National Vital Statistics System
- The first birth rate for women aged 35–39 increased from 1970 to 2006, decreased from 2006 to 2010, and increased again in both 2011 and 2012.
- The first birth rate for women aged 40–44 was steady in the 1970s and started increasing in the 1980s. The rate more than doubled from 1990 to 2012.
- For women aged 35–39 and 40–44 all race and Hispanic origin groups had increasing first birth rates from 1990 to 2012.
- Since 2000, 46 states and DC had an increase in the first birth rate for women aged 35–39. For women aged 40–44, rates increased in 31 states and DC.
The average age of women at first birth has risen over the past 4 decades (1–3). This increase is in part a reflection of the shift in first births to women 35 years and older. Delayed childbearing affects the size, composition, and future growth of the population in the United States (2). Increased health risks to older mothers, especially those 40 years and older, and their infants are well documented (4–7), first time older mothers are generally better educated and more likely to have more resources including higher incomes than those at the youngest reproductive ages (8). This report explores trends in first births to women aged 35–39 and 40–44 years from 1970 to 2012, and by race and Hispanic origin from 1990 to 2012 (the most recent year for which comparable data are available). Trends in first births for older women by state are examined for the recent period, 2000 to 2012.
Keywords: first births, older women
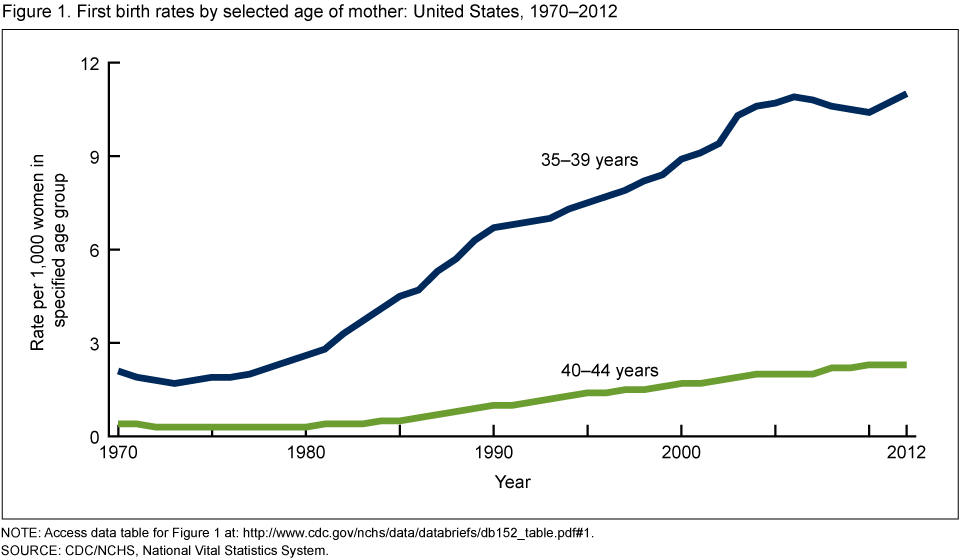
First birth rates for women 35–39 generally increased from the mid-1970s to 2012, while steady increases for women 40–44 began later in the early-1980s.
Figure 1. First birth rates by selected age of mother: United States, 1970–2012
NOTE: Access data table for Figure 1 [PDF – 123 KB].
SOURCE: CDC/NCHS, National Vital Statistics System.
- First birth rates for women aged 35–39 started to increase in the mid-1970s and rose six-fold from 1973 to 2006 (from 1.7 to 10.9 per 1,000) (Figure 1). The rate for women aged 35–39 decreased slightly from 2006 to 2010 (10.4 per 1,000 in 2010) but then increased to 11.0 in 2012.
- First birth rates for women aged 40–44 were essentially stable during the 1970s and early 1980s, but increased more than four-fold from 1985 through 2012 (from 0.5 to 2.3).
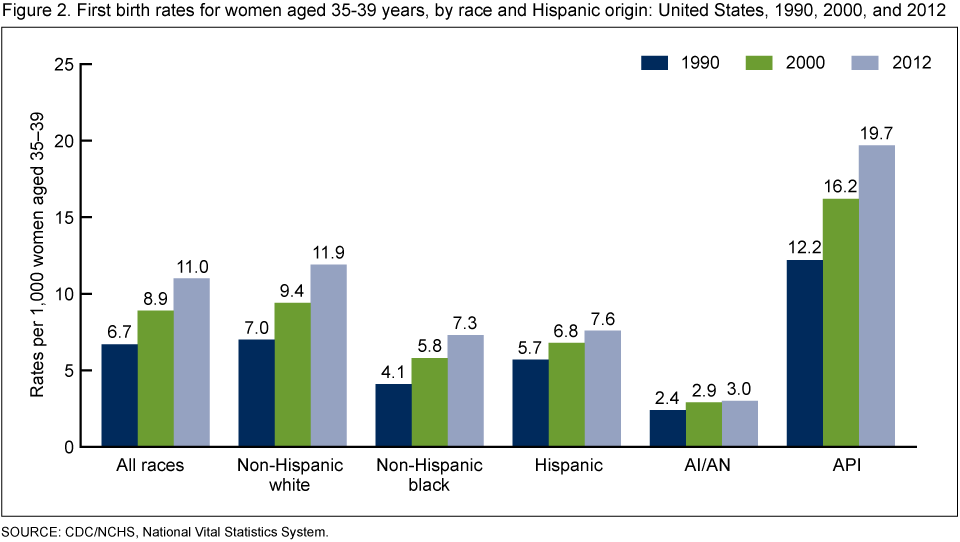
First birth rates for women aged 35–39 rose among all race and Hispanic origin groups from 1990 to 2012.
- First birth rates increased for women aged 35–39 for all race and Hispanic origin groups from 1990 to 2000; the largest increases were seen for non-Hispanic black (41%), non-Hispanic white (34%), and Asian or Pacific Islander (API) (33%) women (Figure 2).
- First birth rates increased for all but one group for the most recent time period, 2000 to 2012; increases were largest among non-Hispanic white (27%), non-Hispanic black (26%), and API (22%) women. The rate was essentially unchanged for American Indian or Alaska Native (AI/AN) women.
- AI/AN women aged 35–39 had the lowest first birth rates from 1990 to 2012 and API women had the highest rates. In 2012, the first birth rate for API (19.7) was more than six times as high as for AI/AN women (3.0).
Figure 2. First birth rates for women aged 35–39 years, by race and Hispanic origin: United States, 1990, 2000, and 2012
SOURCE: CDC/NCHS, National Vital Statistics System.
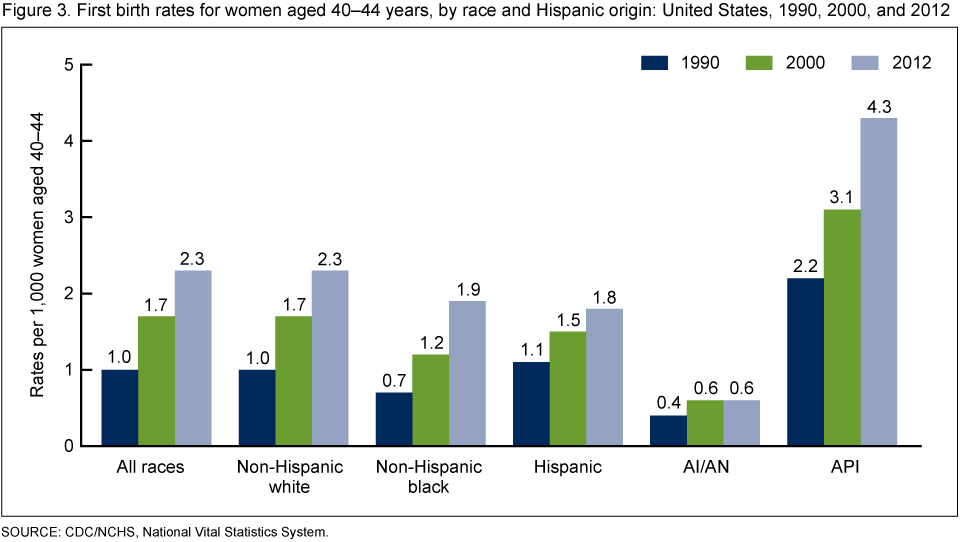
First birth rates for women aged 40–44 increased steadily among all race and Hispanic origin groups from 1990 to 2012.
- Among the oldest mothers, increases in first birth rates were largest for non-Hispanic black (171%) and for non-Hispanic white (130%) women (Figure 3).
- Of all race and Hispanic origin groups, API women at age 40–44 had the highest first birth rates from 1990 to 2012.
Figure 3. First birth rates for women aged 40–44 years, by race and Hispanic origin: United States, 1990, 2000, and 2012
SOURCE: CDC/NCHS, National Vital Statistics System.
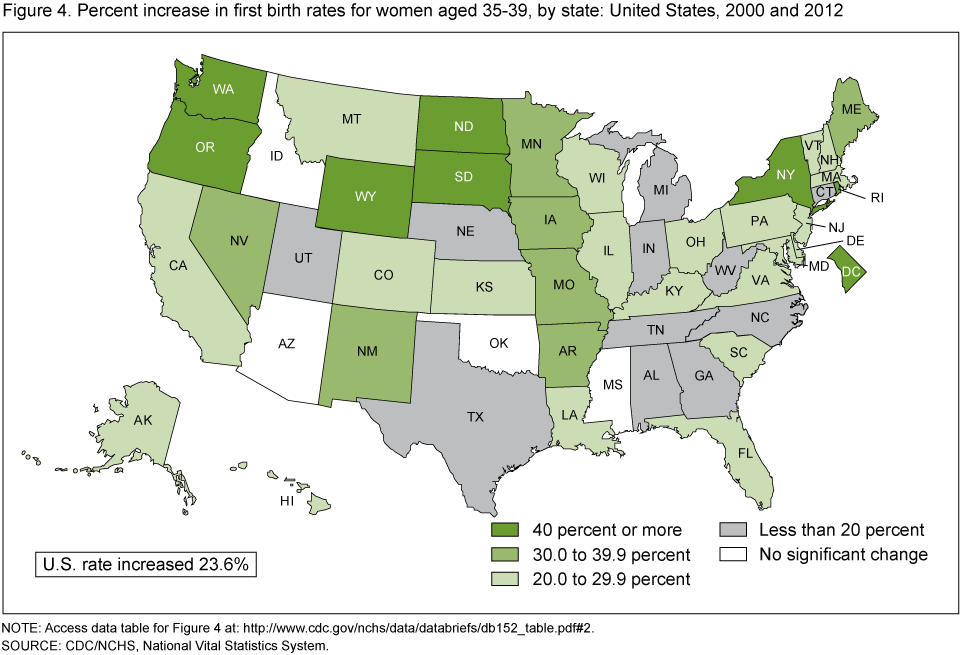
First birth rates for women aged 35–39 rose in nearly all states from 2000 to 2012.
- The first birth rate for women aged 35–39 rose 40% or more in the District of Columbia, New York, North Dakota, Oregon, Rhode Island, South Dakota, Washington, and Wyoming from 2000 to 2012 (Figure 4).
- During this same time period the first birth rate for women aged 35–39 increased 30.0 to 39.9% in 9 states and from 20.0 to 29.9% in 21 states.
- First birth rates were essentially unchanged in Arizona, Idaho, Mississippi, and Oklahoma from 2000 to 2012.
Figure 4. Percent increase in first birth rates for women aged 35–39, by state: United States, 2000 and 2012
NOTE: Access data table for Figure 4 [PDF – 123KB].
SOURCE: CDC/NCHS, National Vital Statistics System.
Thirty-three states and DC had an increase in the first birth rates for women aged 40–44 from 2000 to 2012.
- The first birth rate for women aged 40–44 rose 60% or more in the District of Columbia, Minnesota, Nebraska, and South Carolina from 2000 to 2012 (Figure 5).
- Fifteen states, many in the mid-west, had rises of 40.0 to 59.9% in first birth rates among women in this age group; rates rose 30.0 to 39.9% in eight states.
- In contrast to the states with increases for women 40–44, first birth rates were unchanged in fifteen states during 2000 to 2012.
Figure 5. Percent increase in first birth rates for women aged 40–44, by state: United States, 2000 and 2012.
NOTE: Access data table for Figure 5 [PDF – 123KB].
SOURCE: CDC/NCHS, National Vital Statistics System.
Summary
Increases in the number, percentage, and rate of first births to older women have been observed over the last 4 decades. In 2012 there were more than 9 times as many first births to women aged 35 years and older than there were 4 decades earlier. Over the past two decades first birth rates rose for older women of all race and Hispanic origins. For the more recent period, 2000–2012, first birth rates for women 35–39 years rose 24% and 35% for women aged 40–44. Increases in first birth rates among women 35–39 years were observed in all but four states; two-thirds of the states had increases for women aged 40–44.
While first birth rates for women 35 and over have increased over the past few decades, first birth rates for women aged 30–34 by comparison have increased but not as steadily since the early 2000s (4). First birth rates for women aged less than 30, particularly those aged less than 20, have declined in the past decade. However, the increase in first births to older mothers from 2000 to 2012 has persisted even as total births declined (4). Changing US trends in first births to older women has an important impact on population structure such as lower total fertility and family size.
Definitions
First birth rate: The number of first births per 1,000 women.
Older women: Women aged 35 and over.
Data sources and methods
This report contains data from the Natality Data File from the National Vital Statistics System (NVSS). The vital statistics natality file includes information for all births occurring in the United States. The natality files include information on a wide range of maternal and infant demographic and health characteristics for babies born in the United States. The natality files are available from NCHS. Data for 2012 and earlier years may also be accessed from the interactive data access tool, VitalStats.
Percentage of first births and first birth rates, for 2012 and earlier years are based on final birth data. Information on the 2012 data is available elsewhere (5). Population data for computing birth rates for 2012 were provided by the U.S. Census Bureau and are projected based on the April 1, 2010 census (9). See, Births: Final Data for 2012, for more information on the rates (4). Rates shown here may differ from rates computed on the basis of other population estimates (10). Rates for Hispanic, non-Hispanic white, and non-Hispanic black women in 1990 exclude data for New Hampshire and Oklahoma, which did not report Hispanic origin. These two states accounted for 1.6% of births in 1990 (11).
About the authors
T.J. Mathews and Brady E. Hamilton are with CDC’s NCHS, Division of Vital Statistics, Reproductive Statistics Branch.
References
- Ventura SJ. Trends and variations in first births to older women, United States, 1970–86. Vital health stat vol 21 no 47. Hyattsville, MD: National Center for Health Statistics. 1989.
- Mathews TJ, Hamilton BE. Delayed childbearing: More women are having their first child later in life. NCHS data brief, no 21. Hyattsville, MD: National Center for Health Statistics. 2009.
- Gregory E. Ready: Why women are embracing the new later motherhood, with a new preface. Basic Books. 2012.
- Martin JA, Hamilton BE, Osterman MJK et al. Births: Final Data for 2012. National vital statistics reports; vol 62 no 9. Hyattsville, MD: National Center for Health Statistics. 2013.
- Mathews TJ, MacDorman MF. Infant mortality statistics from the 2009 period linked birth/infant death data set. National vital statistics reports; vol 61 no 8. Hyattsville, MD: National Center for Health Statistics. 2013.
- Nabukera S, Wingate MS, Alexander GS, Salihu HM. First-time births among women 30 years and older in the United States: patterns and risk of adverse outcomes. J Reprod Med Vol 51(9). 2006.
- Balasch J, Gratacos E. Delayed childbearing: Effects on fertility and the outcome of pregnancy. Fetal Diagn Ther Vol 29. 2011.
- Martinez GM, Daniels K, Chandra A. Fertility of men and women aged 15–44 years in the United States: National Survey of Family Growth, 2006–2010. National health statistics reports; no 51. Hyattsville, MD: National Center for Health Statistics. 2012.
- National Center for Health Statistics, Postcensal estimates of the resident population of the United States for July 1, 2011 and national intercensal estimates of the resident population of the United States for July 1, 2000–July 1, 2009, by year, county, single year of age, bridged race, Hispanic origin, and sex. Prepared under a collaborative arrangement with the U.S. Census Bureau.
- Martin JA, Hamilton BE, Ventura SJ, et al. Births: Final Data for 2010. National vital statistics reports; vol 61 no 1. Hyattsville, MD: National Center for Health Statistics. 2012.
- National Center for Health Statistics. Advance Report of Final Natality Statistics, 1990. Monthly vital statistics report; vol 41 no 9 suppl. Hyattsville, MD: Public Health Service. 1993.
Suggested citation
Mathews TJ, Hamilton BE. First births to older women continue to rise. NCHS data brief, no 152. Hyattsville, MD: National Center for Health Statistics. 2014.
Copyright information
All material appearing in this report is in the public domain and may be reproduced or copied without permission; citation as to source, however, is appreciated.
National Center for Health Statistics
Charles J. Rothwell, M.S., M.B.A., Director
Jennifer H. Madans, Ph.D., Associate Director for Science
Division of Vital Statistics
Delton Atkinson, M.P.H., M.P.H., P.M.P., Director