Injury-related Emergency Department Visits by Children and Adolescents: United States, 2009–2010
- Key findings
- What were the injury-related ED visit rates for children and adolescents, and did they vary by age?
- Did the injury-related ED visit rates for children and adolescents vary by sex?
- Did the injury-related ED visit rates for children and adolescents vary by race and ethnicity?
- What were the leading causes of injury-related ED visits among children and adolescents, and did visit rates for these causes vary by sex?
- What were the primary expected sources of payment for injury-related ED visits by children and adolescents?
- Summary
- Definitions
- Data source and methods
- About the authors
- References
- Suggested citation
NCHS Data Brief No. 150, May 2014
PDF Version (689 KB)
Michael Albert, M.D., M.P.H.; and Linda F. McCaig, M.P.H.
Key findings
Data from the National Hospital Ambulatory Medical Care Survey, 2009–2010
- In 2009–2010, an annual average of 11.9 million injury-related emergency department (ED) visits were made by children and adolescents aged 18 years and under in the United States.
- The injury-related ED visit rate was 151 per 1,000 persons aged 18 years and under, and rates were higher for males than for females for all age groups (0–4 years, 5–12 years, and 13–18 years).
- The injury-related ED visit rates among persons aged 5–12 years and 13–18 years were higher for non-Hispanic black persons than for other race and ethnicity groups.
- Leading causes of injury-related ED visits among both males and females included falls and striking against or being struck unintentionally by objects or persons. Visit rates were higher for males than for females for both of these causes.
Injury is the leading cause of death and a major source of morbidity among children and adolescents in the United States (1,2). The emergency department (ED) plays an important role in the care of injuries, and these visits often represent the initial contact with a provider for the injury (3). This report examines nationally representative data on injury-related ED visits by children and adolescents aged 18 years and under in the United States during 2009–2010. Injury-related ED visit rates were also compared for the age groups 0–4, 5–12, and 13–18 years, as these correspond to the preschool, school-age, and teen life periods respectively.
Keywords: health care utilization, injury, child health, National Hospital Ambulatory Medical Care Survey
What were the injury-related ED visit rates for children and adolescents, and did they vary by age?
- In 2009–2010, there were an estimated 33.7 million annual average ED visits by persons aged 18 years and under in the United States, and 11.9 million (35.3%) of these visits were injury related (Figure 1).
Figure 1. Number and rate of injury-related emergency department visits for persons aged 18 years and under: United States, 2009–2010
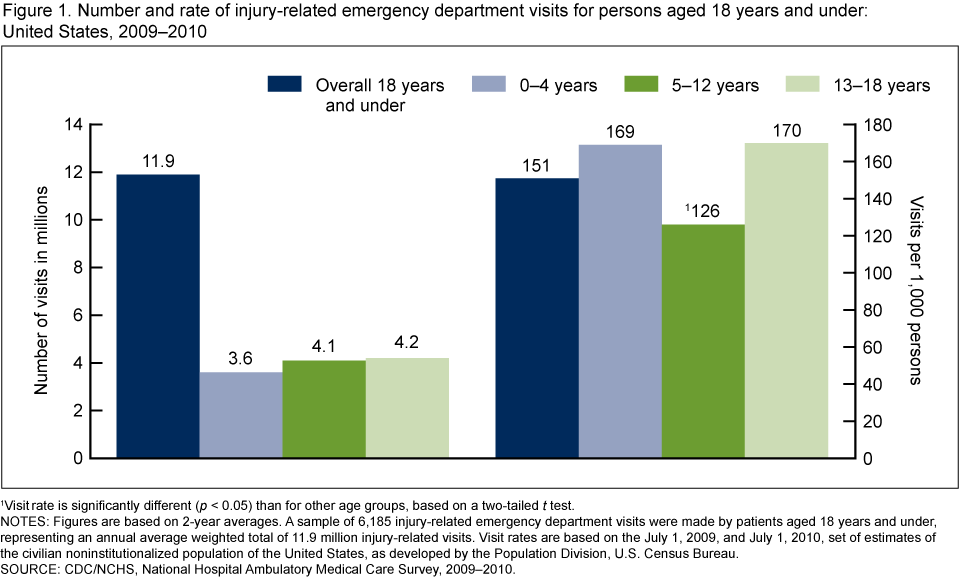
1Visit rate is significantly different (p < 0.05) than for other age groups, based on a two-tailed t test.
NOTES: Figures are based on 2-year averages. A sample of 6,185 injury-related emergency department visits were made by patients aged 18 years and under, representing an annual average weighted total of 11.9 million injury-related visits. Visit rates are based on the July 1, 2009, and July 1, 2010, set of estimates of the civilian noninstitutionalized population of the United States, as developed by the Population Division, U.S. Census Bureau.
SOURCE: CDC/NCHS, National Hospital Ambulatory Medical Care Survey, 2009–2010.
- The annual average ED visit rate was 151 per 1,000 persons aged 18 years and under.
- A “u-shaped” curve was observed for the injury-related ED visit rates by children and adolescents, which was lowest in the 5–12 year age group compared with the 0–4 and 13–18 year age groups.
Did the injury-related ED visit rates for children and adolescents vary by sex?
- In 2009–2010, the injury-related ED visit rate was higher among males than females in all age groups (Figure 2).
- Among both males and females, the visit rate was lowest in the 5–12 year age group compared with the 0–4 and 13–18 year age groups.
Figure 2. Injury-related emergency department visit rates by sex for persons aged 18 years and under: United States, 2009–2010
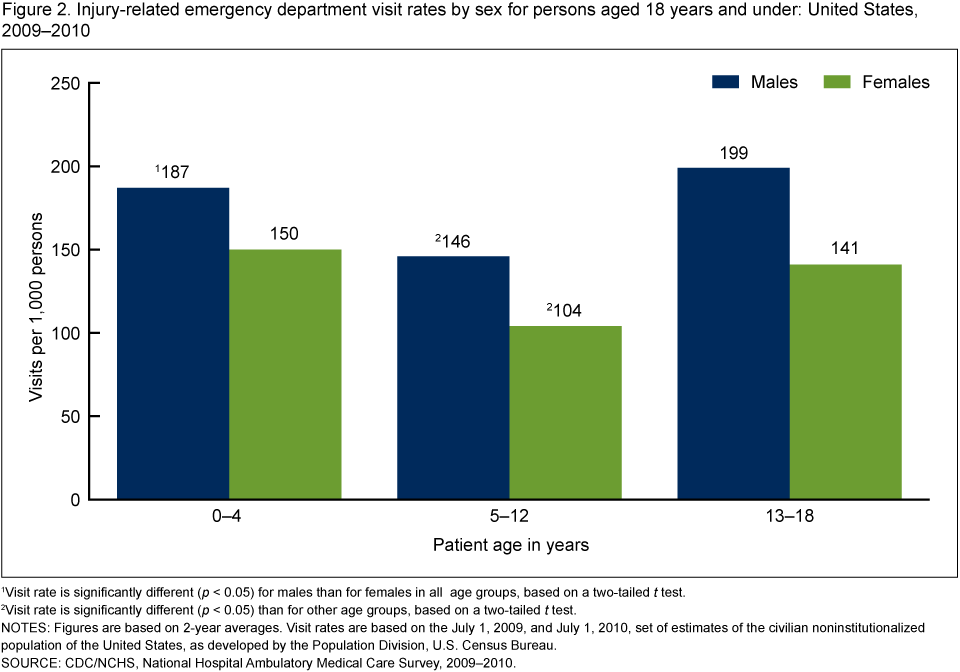
1Visit rate is significantly different (p < 0.05) for males than for females in all age groups, based on a two-tailed t test.
2Visit rate is significantly different (p < 0.05) than for other age groups, based on a two-tailed t test.
NOTES: Figures are based on 2-year averages. Visit rates are based on the July 1, 2009, and July 1, 2010, set of estimates of the civilian noninstitutionalized population of the United States, as developed by the Population Division, U.S. Census Bureau.
SOURCE: CDC/NCHS, National Hospital Ambulatory Medical Care Survey, 2009–2010.
Did the injury-related ED visit rates for children and adolescents vary by race and ethnicity?
- In both the 5–12 and 13–18 year age groups, the injury-related ED visit rate was highest among non-Hispanic black persons, followed by non-Hispanic white persons, and Hispanic persons (Figure 3).
- In the 0–4 year age group, the injury-related ED visit rate was higher among non-Hispanic black persons compared with Hispanic persons. The observed difference between non-Hispanic black persons and non-Hispanic white persons did not reach statistical significance.
Figure 3. Injury-related emergency department visit rates by race and ethnicity for persons aged 18 years and under: United States, 2009–2010
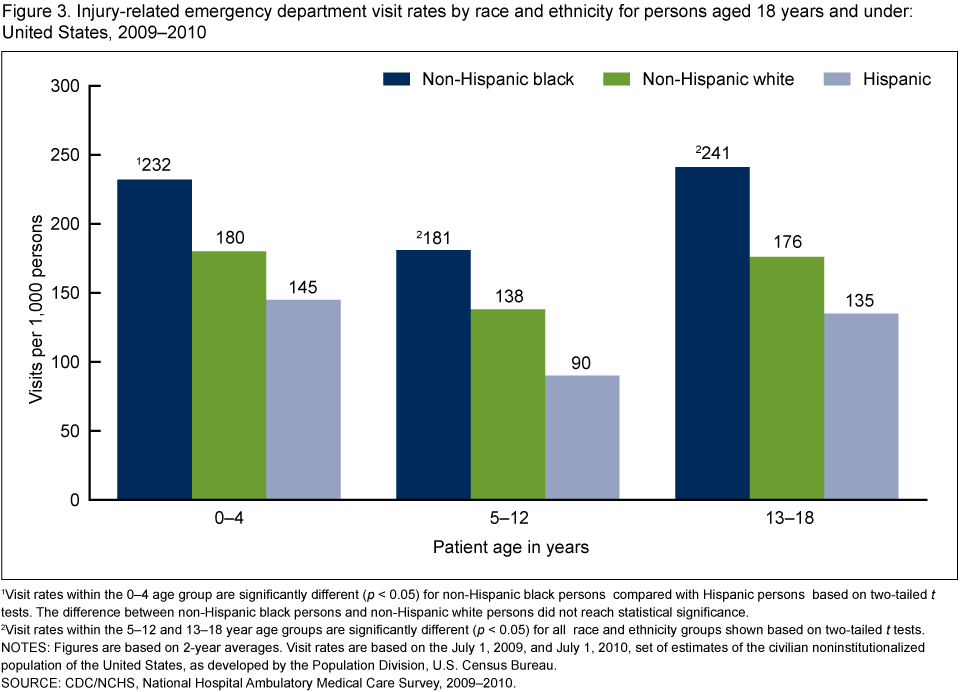
1Visit rates within the 0–4 age group are significantly different (p < 0.05) for non-Hispanic black persons compared with Hispanic persons based on two-tailed t tests. The difference between non-Hispanic black persons and non-Hispanic white persons did not reach statistical significance.
2Visit rates within the 5–12 and 13–18 year age groups are significantly different (p < 0.05) for all race and ethnicity groups shown based on two-tailed t tests.
NOTES: Figures are based on 2-year averages. Visit rates are based on the July 1, 2009, and July 1, 2010, set of estimates of the civilian noninstitutionalized population of the United States, as developed by the Population Division, U.S. Census Bureau.
SOURCE: CDC/NCHS, National Hospital Ambulatory Medical Care Survey, 2009–2010.
What were the leading causes of injury-related ED visits among children and adolescents, and did visit rates for these causes vary by sex?
- Leading causes of injury-related ED visits among both males and females aged 18 years and under included falls and striking against or being struck unintentionally by objects or persons (Figure 4).
- Injury-related ED visit rates were higher for males than for females aged 18 years and under for unintentional injuries caused by falls, striking against or being struck by objects or persons, and cutting or piercing instruments or objects.
Figure 4. Emergency department visit rates for leading causes of injury by sex for persons aged 18 years and under: United States, 2009–2010
1Visit rate is significantly different (p < 0.05) for males than for females based on a two-tailed t test.
NOTES: Based on “Supplementary Classification of External Cause of Injury and Poisoning” in the International Classification of Diseases, Ninth Revision, Clinical Modification (ICD–9–CM). Causes shown are unintentional with the exception of assault. Figures are based on 2-year averages. Visit rates are based on the July 1, 2009, and July 1, 2010, set of estimates of the civilian noninstitutionalized population of the United States, as developed by the Population Division, U.S. Census Bureau.
SOURCE: CDC/NCHS, National Hospital Ambulatory Medical Care Survey, 2009–2010.
What were the primary expected sources of payment for injury-related ED visits by children and adolescents?
- The most frequently recorded primary expected sources of payment for injury-related ED visits by children and adolescents were Medicaid or Children’s Health Insurance Program (CHIP) (41.7%) and private insurance (40.7%) (Figure 5).
- Injury-related ED visits by children and adolescents with no insurance comprised 8.6% of visits.
Figure 5. Percentage of injury-related emergency department visits by primary expected source of payment for persons aged 18 years and under: United States, 2009–2010
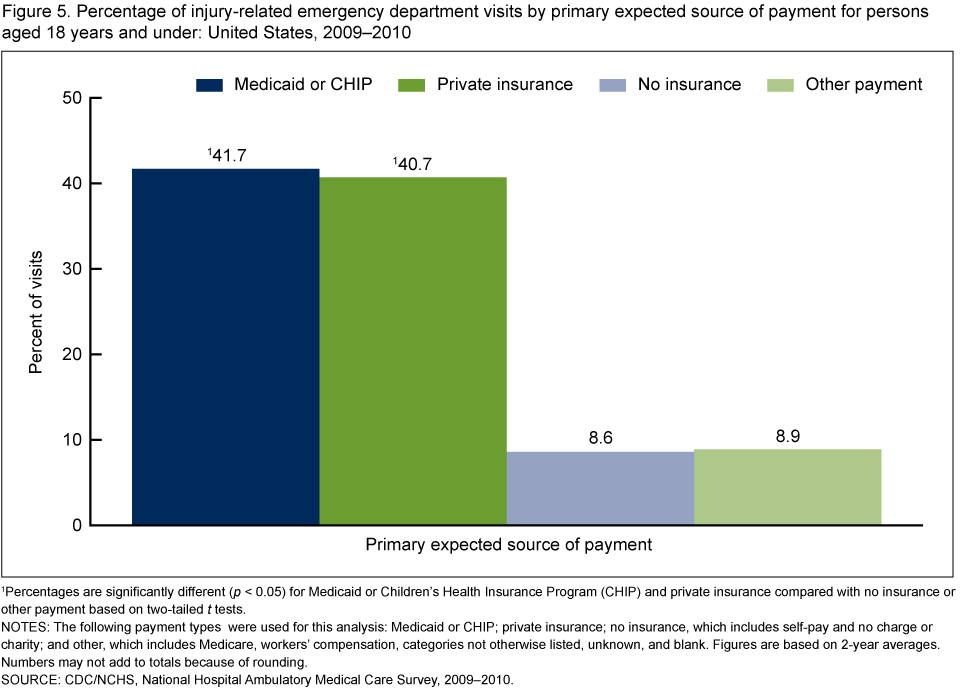
1Percentages are significantly different (p < 0.05) for Medicaid or Children’s Health Insurance Program (CHIP) and private insurance compared with no insurance or other payment based on two-tailed t tests.
NOTES: The following payment types were used for this analysis: Medicaid or CHIP; private insurance; no insurance, which includes self-pay and no charge or charity; and other, which includes Medicare, workers’ compensation, categories not otherwise listed, unknown, and blank. Figures are based on 2-year averages. Numbers may not add to totals because of rounding.
SOURCE: CDC/NCHS, National Hospital Ambulatory Medical Care Survey, 2009–2010.
Summary
Child and adolescent injuries represent a serious public health problem in the United States. Over one-third of ED visits made by persons aged 18 years and under—an average of 11.9 million visits annually—were injury related in 2009–2010. The annual average injury-related ED visit rate was 151 per 1,000 persons aged 18 years and under. A number of findings related to injury-related ED visits during that time period were identified. The injury-related ED visit rate was lower in the 5–12 year age group compared with the 0–4 and 13–18 year age groups, and the rate was higher among males compared with females in each age group. Among persons aged 5–12 and 13–18 years, the injury-related ED visit rate was highest among non-Hispanic black persons compared with other race and ethnicity groups analyzed. Leading causes of injury-related ED visits among both males and females aged 18 years and under included falls and striking against or being struck unintentionally by objects or persons. Males had higher visit rates for unintentional injuries caused by falls, striking against or being struck by objects or persons, and cutting or piercing instruments or objects.
Injury prevention objectives covering a broad range of issues have recently been outlined for Healthy People 2020 with the goal of preventing injury and violence and reducing their consequences (4). National Hospital Ambulatory Medical Care Survey (NHAMCS) data are used to track the injury prevention objectives related to reducing ED visits for nonfatal injuries overall and for nonfatal traumatic brain injuries (4). Monitoring and evaluating data related to child and adolescent injuries will remain important for informing injury prevention efforts in this population.
Definitions
Emergency department (ED): A hospital facility that provides unscheduled outpatient services to patients whose conditions require immediate care, and is staffed 24 hours a day. Onsite and offsite EDs that are open fewer than 24 hours are included, if staffed by the hospital.
Emergency department visit: Direct, in-person exchange between a patient seeking ED care and a health-care provider.
Injury-related visit: A visit that met one of the following three conditions: a “yes” was marked in response to the question, “Is this visit related to an injury, poisoning, or adverse effect of medical treatment?”; a cause of injury or a nature of injury diagnosis was provided; or an injury-related reason for visit was reported.
Data source and methods
Data are from the 2009–2010 NHAMCS, an annual nationally representative survey of nonfederal, general, and short-stay hospitals, which is conducted by the Centers for Disease Control and Prevention’s National Center for Health Statistics. NHAMCS uses a multistage probability design with samples of primary sampling units (PSUs), hospitals within PSUs, and patient visits within EDs. Each year, approximately 480 hospitals are selected for inclusion in NHAMCS, and data are collected on approximately 35,000 ED visits. Additional information on the methodology of NHAMCS is available (5,6).
Data were imputed for patient age, sex, race, and ethnicity. Of these variables, the imputation rates were highest for the variables of race and ethnicity: 10.4% for race and 13.1% for ethnicity in 2009, and 10.5% for race and 12.8% for ethnicity in 2010 (5,6). Race and ethnicity data were combined in (Figure 3) to form the categories of Hispanic, non-Hispanic white, and non-Hispanic black; visits by other race and ethnicity groups are not shown in this figure. Multiple expected sources of payment may be indicated for a visit, and the following hierarchy was used to identify the primary expected payment source for this analysis: Medicare, Medicaid or CHIP, private insurance, workers’ compensation, self-pay, no charge or charity, other, and unknown. In (Figure 5), the category “no insurance” includes self-pay and no charge or charity, and the category “other payment type” includes Medicare, workers’ compensation, categories not otherwise listed, unknown, and blank. Cause of injury was determined based on the first-listed external cause-of-injury code from the International Classification of Diseases, Ninth Revision, Clinical Modification (ICD–9–CM) (7). A detailed description of the ICD–9–CM E-codes used to create the groupings in (Figure 4) has been previously described (8).
Data analyses were performed using the statistical packages SAS version 9.3 (SAS Institute, Cary, N.C.) and SAS-callable SUDAAN version 11.0 (RTI International, Research Triangle Park, N.C.). Differences among subgroups were evaluated using a two-tailed t test. Comparisons reported in the text are statistically significant (p < 0.05) unless otherwise indicated. A lack of comment regarding the difference between any two estimates does not indicate that the difference was tested and found to be not significant.
About the authors
Michael Albert and Linda F. McCaig are with the Centers for Disease Control and Prevention’s National Center for Health Statistics, Division of Health Care Statistics, Ambulatory and Hospital Care Statistics Branch.
References
- Centers for Disease Control and Prevention. Protect the ones you love: Child injuries are preventable.
- Borse NN, Gilchrist J, Dellinger AM, Rudd RA, Ballesteros MF, Sleet DA. CDC childhood injury report: Patterns of unintentional injuries among 0–19 year olds in the United States, 2000–2006. Atlanta, GA: Centers for Disease Control and Prevention, National Center for Injury Prevention and Control. 2008.
- Burt CW, McCaig LF, Rechtsteiner EA. Ambulatory medical care utilization estimates for 2005. Advance data from vital and health statistics; no 388. Hyattsville, MD: National Center for Health Statistics. 2007.
- Centers for Disease Control and Prevention. HealthyPeople.gov. 2020 topics and objectives: Injury and violence prevention overview.
- National Center for Health Statistics. 2009 NHAMCS micro-data file documentation [PDF – 1.47 MB]. 2009.
- National Center for Health Statistics. 2010 NHAMCS micro-data file documentation [PDF – 1.52 MB]. 2010.
- U.S. Department of Health and Human Services, Centers for Disease Control and Prevention, Medicare & Medicaid Services. International classification of diseases, ninth revision, clinical modification, 6th ed. DHHS Pub No. (PHS) 06–1260. 2006.
- McCaig LF, Burt CW. National Hospital Ambulatory Medical Care Survey: 2003 emergency department summary. Advance data from vital and health statistics; no 358. Hyattsville, MD: National Center for Health Statistics. 2005.
Suggested citation
Albert M, McCaig LF. Injury-related emergency department visits by children and adolescents: United States, 2009–2010. NCHS data brief, no 150. Hyattsville, MD: National Center for Health Statistics. 2014.
Copyright information
All material appearing in this report is in the public domain and may be reproduced or copied without permission; citation as to source, however, is appreciated.
National Center for Health Statistics
Charles J. Rothwell, M.S., M.B.A., Director
Jennifer H. Madans, Ph.D., Associate Director for Science
Division of Health Care Statistics
Clarice Brown, M.S., Director