Trends in Out-of-Hospital Births in the United States, 1990–2012
- Key findings
- In 2012, 1.36% of U.S. births were born outside a hospital, up from 1.26% in 2011.
- In 2012, 1 in 49 births to non-Hispanic white women were out-of-hospital births.
- The percentage of out-of-hospital births was generally higher in the northwestern United States and lower in the southeastern United States.
- Out-of-hospital births generally had a lower risk profile than hospital births.
- The risk profile of out-of-hospital births declined from 2004 through 2012.
- Summary
- Definitions
- Data sources and methods
- About the authors
- References
- Suggested citation
NCHS Data Brief No. 144, March, 2014
PDF Version (679 KB)
Marian F. MacDorman, Ph.D.; T.J. Mathews, M.S.; and Eugene Declercq, Ph.D.
Key findings
- The percentage of out-of-hospital births increased from 1.26% of U.S. births in 2011 to 1.36% in 2012, continuing an increase that began in 2004.
- In 2012, out-of-hospital births comprised 2.05% of births to non-Hispanic white women, 0.49% to non-Hispanic black women, 0.46% to Hispanic women, 0.81% to American Indian women, and 0.54% to Asian or Pacific Islander women.
- In 2012, out-of-hospital births comprised 3%–6% of births in Alaska, Idaho, Montana, Oregon, Pennsylvania, and Washington, and between 2% and 3% of births in Delaware, Indiana, Utah, Vermont, and Wisconsin. Rhode Island (0.33%), Mississippi (0.38%), and Alabama (0.39%) had the lowest percentages of out-of-hospital births.
- In 2012, the risk profile of out-of-hospital births was lower than for hospital births, with fewer births to teen mothers, and fewer preterm, low birthweight, and multiple births.
In 1900, almost all U.S. births occurred outside a hospital; however the proportion of out-of-hospital births fell to 44% by 1940 and to 1% by 1969, where it remained through the 1980s (1–3). Although out-of-hospital births are still rare in the United States, they have been increasing recently (4). If this increase continues, it has the potential to affect patterns of facility usage, clinician training, and resource allocation, as well as health care costs (5–8). This report updates previous analyses (2,9) to examine recent trends and characteristics of out-of-hospital births, including home and birthing center births, in the United States from 1990–2012, and compares selected characteristics with hospital births.
Keywords: home birth, birthing center birth, birth certificates
In 2012, 1.36% of U.S. births were born outside a hospital, up from 1.26% in 2011.
- After a gradual decline from 1990–2004, the percentage of out-of-hospital births increased from 0.87% of U.S. births in 2004 to 1.36% of U.S. births in 2012 (Figure 1), its highest level since 1975. In 2012, 53,635 births in the United States occurred out of a hospital, including 35,184 home births and 15,577 birthing center births.
Figure 1. Percentage of births occurring out-of-hospital: United States, 1990–2012
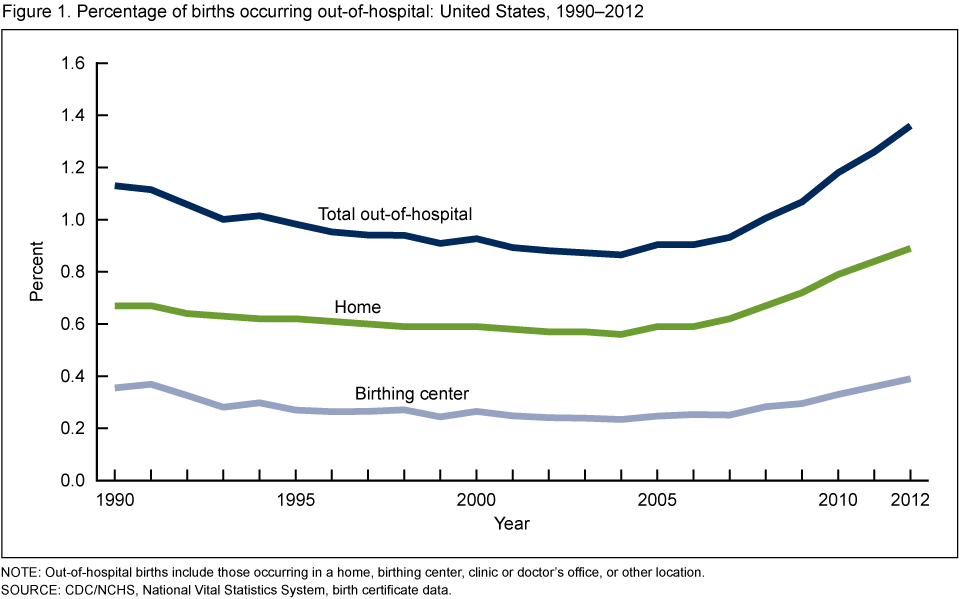
NOTE: Out-of-hospital births include those occurring in a home, birthing center, clinic or doctor’s office, or other location.
SOURCE: CDC/NCHS, National Vital Statistics System, birth certificate data.
- In 2012, two-thirds (66%) of out-of-hospital births occurred at home, and another 29% occurred in a freestanding birthing center. (The remaining 5% of out-of-hospital births occurred in a clinic or doctor’s office or other location.)
- The percentage of home births increased from 0.84% in 2011 to 0.89% in 2012. This percentage has been increasing since 2004 (0.56%).
- The percentage of birthing center births increased from 0.36% in 2011 to 0.39% in 2012. This percentage has been increasing since 2004 (0.23%).
In 2012, 1 in 49 births to non-Hispanic white women were out-of-hospital births.
- There were large differences in the percentage of out-of-hospital births by maternal race and ethnicity (Figure 2). In 2012, the percentage of out-of-hospital births was two to four times higher for non-Hispanic white women than for any other racial or ethnic group.
- From 2011–2012, the percentage of out-of-hospital births increased significantly for non-Hispanic white (from 1.89% to 2.05%), Hispanic (from 0.44% to 0.46%), and Asian or Pacific Islander [API (from 0.49% to 0.54%)] women. Increases from 2011–2012 were not statistically significant for non-Hispanic black and American Indian women.
Figure 2. Percentage of births occurring out-of-hospital, by race and Hispanic origin of mother: United States, 1990–2012

NOTE: Non-Hispanic white, non-Hispanic black, and Hispanic data exclude New Hampshire in 1990–1992 and Oklahoma in 1990; these states did not report Hispanic origin on their birth certificates for these years.
SOURCE: CDC/NCHS, National Vital Statistics System, birth certificate data.
- When the longer-term trend is examined, the percentage of out-of-hospital births increased for all racial and ethnic groups from 2004–2012. The increase was largest for non-Hispanic white women, whose percentage of out-of-hospital births increased from 1.20% in 2004 to 2.05% in 2012. From 2004–2012, the percentage of out-of-hospital births increased from 0.45% to 0.49% for non-Hispanic black women, from 0.38% to 0.46% for Hispanic women, from 0.64% to 0.81% for American Indian women, and from 0.38% to 0.54% for API women.
- About 89% of the total increase in out-of-hospital births from 2004–2012 was due to the increase among non-Hispanic white women.
- Hispanic women had the highest proportion of out-of-hospital births in 1990 but the lowest proportion in 2012.
The percentage of out-of-hospital births was generally higher in the northwestern United States and lower in the southeastern United States.
- More than 3% of births occurred outside a hospital in 2012 for six states: Alaska (6.0%), Montana (3.9%), Oregon (3.8%), Washington (3.4%), Idaho (3.4%), and Pennsylvania (3.1%). Between 2% and 3% of births occurred outside a hospital for five states (Utah, Vermont, Indiana, Wisconsin, and Delaware) (Figure 3).
- In contrast, the percentage of out-of-hospital births was less than 1% for southeastern states from Louisiana to Georgia, as well as for a few other states throughout the country.
Figure 3. Percentage of births occurring out-of-hospital, by state: United States, 2012
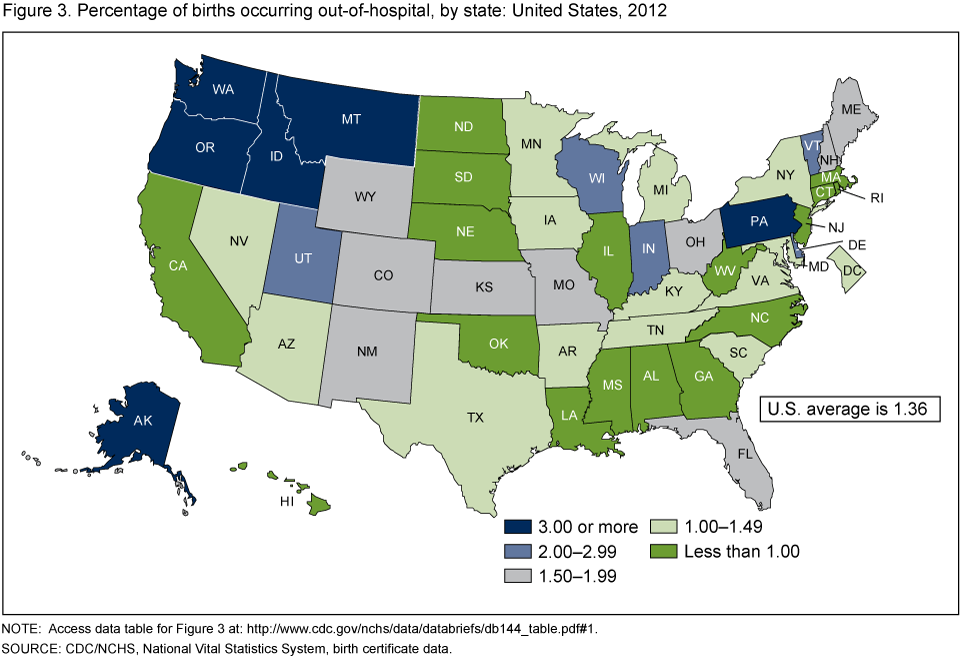
NOTE: Access data table for Figure 3 [PDF – 108KB].
SOURCE: CDC/NCHS, National Vital Statistics System, birth certificate data.
- Overall, 45 states had statistically significant increases in the percentage of out-of-hospital births from 2004–2012, and for 27 states, the percent increase was 50% or more. No states had statistically significant declines in the percentage of out-of-hospital births from 2004–2012. Regional patterns were similar to those for 2011.
Out-of-hospital births generally had a lower risk profile than hospital births.
- In 2012, 1.9% of out-of-hospital births were to teen mothers, compared with 7.9% of hospital births (Figure 4). However, a greater percentage of out-of-hospital (19.0%) than hospital births (14.9%) were to mothers aged 35 and over.
- About 4.4% of out-of-hospital births were born preterm (less than 37 completed weeks of gestation), compared with 11.6% of hospital births.
- Similarly, 3.2% of out-of-hospital births were low birthweight in 2012, compared with 8.1% of hospital births.
- Multiple births comprised 0.8% of out-of-hospital births and 3.5% of hospital births.
Figure 4. Percentage of births occurring in- and out-of-hospital, by selected risk factors: United States, 2012
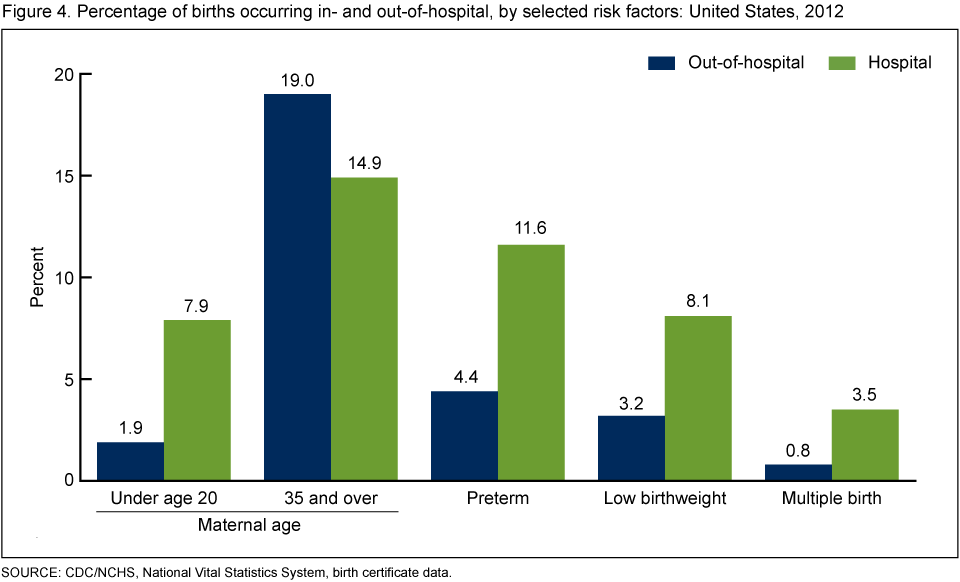
SOURCE: CDC/NCHS, National Vital Statistics System, birth certificate data.
The risk profile of out-of-hospital births declined from 2004 through 2012.
- The proportion of out-of-hospital births to teen mothers declined from 4.3% in 2004 to 1.9% in 2012, and the proportion of these births to mothers aged 35 and over declined from 20.0% in 2004 to 19.0% in 2012 (Figure 5).
- The proportion of out-of-hospital births that were born preterm declined from 6.7% in 2004 to 4.4% in 2012, and the proportion born at low birthweight declined from 4.8% to 3.2%. The proportion with a multiple birth remained about the same at less than 1.0%.
Figure 5. Change in risk profile for births occurring out-of-hospital: United States, 2004 and 2012
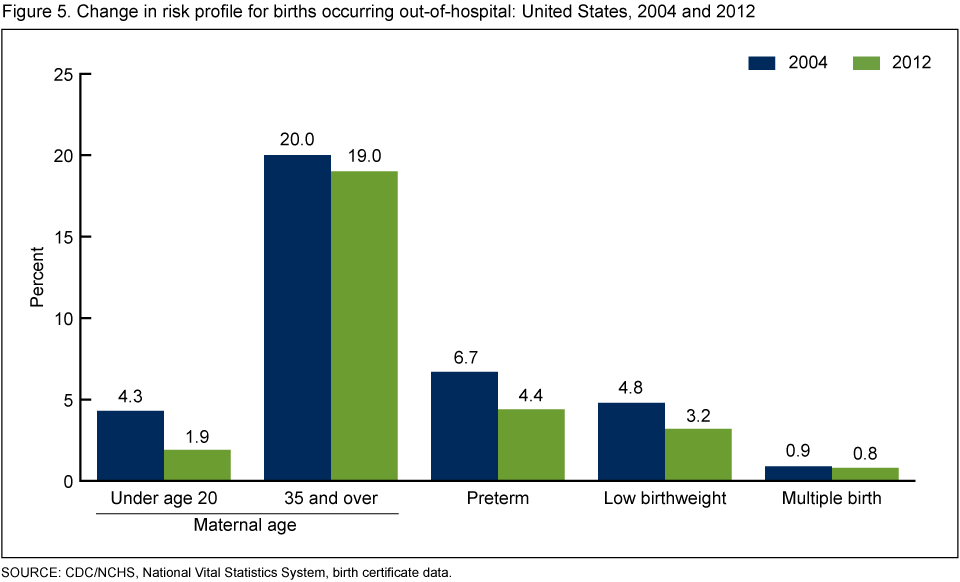
SOURCE: CDC/NCHS, National Vital Statistics System, birth certificate data.
Summary
Although still relatively rare, out-of-hospital births have accounted for a growing share of U.S. births since 2004. In 2012, 1.36% of U.S. births were born outside a hospital, up from 1.26% in 2011 and 0.87% in 2004. The 2012 level is the highest level since 1975 (3). Most of the total increase in out-of-hospital births from 2004–2012 was a result of the increase among non-Hispanic white women, and by 2012, 1 in 49 births to non-Hispanic white women (2.05%) occurred outside a hospital.
In 2012, six states had 3%–6% of their births occur outside a hospital. For an additional five states, between 2% and 3% of their births were out-of-hospital births. Variations in the percentages of out-of-hospital births by state may be influenced by differences in state laws pertaining to midwifery practice or out-of-hospital births (10–11), as well as by the availability of a nearby birthing center (8). The number of U.S. birthing centers increased from 170 in 2004 to 195 in 2010 and to 248 in January 2013; 13 states still did not have a birthing center in the most recent period (8).
Compared with hospital births, home and birthing center births tended to have lower risk profiles, with fewer births to teen mothers and fewer preterm, low birthweight, and multiple births. From 2004 through 2012, there was a decline in the risk profile of out-of-hospital births, with fewer births in 2012 than in 2004 to teen and older mothers and fewer preterm and low birthweight births (3,4). The lower risk profile of out-of-hospital than hospital births suggests that appropriate selection of low-risk women as candidates for out-of-hospital birth is occurring (9).
Although not representative of all U.S. births, 88% of home births in a 36-state reporting area (comprising 71% of U.S. births) were planned in 2012 (3). Unplanned home births are more likely than planned home births to be born preterm and at low birthweight (12).
Definitions
Out-of-hospital birth: Birth that occurs outside a hospital. This includes births occurring in a home, birthing center, clinic or doctor’s office, or other location.
Home birth: Birth that takes place in a residence (home).
Birthing center birth: Birth that takes place in a freestanding birthing center not attached to a hospital.
Preterm birth: Birth occurring before 37 completed weeks of gestation.
Low birthweight: Infant weighing less than 2,500 grams at birth.
Multiple birth: Refers to an individual live birth from a multiple (for example, twin, triplet, or higher-order multiple) pregnancy.
Data sources and methods
This report is based on data from the Centers for Disease Control and Prevention’s National Center for Health Statistics National Vital Statistics System, Birth Data Files for 1990–2012. These data files include data for all births occurring in the United States and include information on a wide range of maternal and infant demographic and health characteristics (3). The birth data files are available for download. Data may also be accessed through the interactive data tool, VitalStats.
Reporting of separate data on home and birthing center births began with the 1989 revision of the U.S. Standard Certificate of Birth. Prior to 1989, births were reported as occurring in or out of a hospital, with no detailed breakdown of type of out-of-hospital birth.
The 2003 revision of the U.S. Standard Certificate of Birth added a data item on planning status of home birth. However, due to the staggered implementation of the 2003 revision among U.S. states, only 36 states (comprising 71% of U.S. births) reported data on planning status of home birth in 2012 (3). The 36-state area is not representative of the overall U.S. population because it is not a random sample of U.S. births.
About the authors
Marian F. MacDorman and T.J. Mathews are with CDC’s National Center for Health Statistics, and Eugene Declercq is with Boston University School of Public Health.
References
- Wertz RW, Wertz DC. Lying-in: A history of childbirth in America. New York: The Free Press. 1977.
- MacDorman MF, Menacker F, Declercq E. Trends and characteristics of home and other out-of-hospital births in the United States, 1990–2006. National vital statistics reports; vol 58 no 11. Hyattsville, MD: National Center for Health Statistics. 2010.
- National Center for Health Statistics. VitalStats–Births.
- Martin JA, Hamilton BE, Osterman MJK, et al. Births: Final data for 2012. National vital statistics reports; vol 62 no 9. Hyattsville, MD: National Center for Health Statistics. 2013.
- Boucher D, Bennett C, McFarlin B, Freeze R. Staying home to give birth: Why women in the United States choose home birth. J Midwifery Womens Health 54(2):119–26. 2009.
- Health Management Associates. Midwifery licensure and discipline program in Washington State: Economic costs and benefits. Washington State Department of Health. October 31, 2007.
- Stapleton SR, Osborne C, Illuzzi J. Outcomes of care in birth centers: Demonstration of a durable model. J Midwifery Womens Health 58(1):3–14. 2013.
- American Association of Birth Centers. AABC Press Kit [Accessed December 5, 2013].
- MacDorman MF, Declercq E, Mathews TJ. Recent trends in out-of-hospital births in the United States. J Midwifery Womens Health 58(5):494–501. 2013.
- Midwives Alliance of North America. Legal status of U.S. midwives [Accessed December 5, 2013].
- Declercq E, Stotland NE. Planned home birth In: Lockwood CJ, Rose BD (editors). UpToDate. Waltham, MA. 2009 [Accessed December 8, 2013].
- Declercq E, MacDorman MF, Menacker F, Stotland N. Characteristics of planned and unplanned home births in 19 states. Obstet Gynecol 116(1):93–9. 2010.
Suggested citation
MacDorman MF, Mathews TJ, Declercq E. Trends in out-of-hospital births in the United States, 1990–2012. NCHS data brief, no 144. Hyattsville, MD: National Center for Health Statistics. 2014.
Copyright information
All material appearing in this report is in the public domain and may be reproduced or copied without permission; citation as to source, however, is appreciated.
National Center for Health Statistics
Charles J. Rothwell, M.S., M.B.A., Director
Jennifer H. Madans, Ph.D., Associate Director for Science
Division of Vital Statistics
Delton Atkinson, M.P.H., M.P.H., P.M.P., Director