Hypertension, Abnormal Cholesterol, and High Body Mass Index Among Non-Hispanic Asian Adults: United States, 2011–2012
- Key findings
- During 2011–2012, most non-Hispanic Asian adults in the United States were foreign-born.
- The prevalence of hypertension among non-Hispanic Asian adults increased with age and decreased with education.
- During 2011–2012, the prevalence of high total cholesterol among non-Hispanic Asian adults did not differ by sex, age, education, or foreign-born status.
- The prevalence of low high-density lipoprotein (HDL) cholesterol was five times greater among non-Hispanic Asian men than women.
- The prevalence of high BMI differed by sex and age among non-Hispanic Asian adults.
- Summary
- Definitions
- Data source and methods
- About the authors
- References
- Suggested citation
NCHS Data Brief No. 140, January 2014
PDF Version (1.13 MB)
Yutaka Aoki, Ph.D., M.S., M.H.S.; Sung Sug Yoon, Ph.D., R.N.; Yinong Chong, Ph.D.; and Margaret D. Carroll, M.S.P.H.
Key findings
Data from the National Health and Nutrition Examination Survey, 2011–2012
- One-quarter (25.6%) of non-Hispanic Asian adults aged 20 and over had hypertension in 2011–2012.
- Approximately 1 in 10 non-Hispanic Asian adults had high total cholesterol.
- Just over 14% of non-Hispanic Asian adults had low levels of high-density lipoprotein cholesterol.
- Just under 40% of non-Hispanic Asian adults had a body mass index greater than 25 kilograms per square meter.
The number of Asian persons in the United States grew by more than 40% between 2000 and 2010 (1). Asian persons now make up 4.9% of the population (2). To address the scarcity of health information based on physical measurements of Asian persons, non-Hispanic Asian persons were oversampled for the first time in the National Health and Nutrition Examination Survey (NHANES) 2011–2012. This report presents the prevalence of hypertension, abnormal cholesterol, and high body mass index (BMI) in non-Hispanic Asian adults aged 20 and over. Abnormal cholesterol and high BMI are defined based solely on measurements, while hypertension is defined based on blood pressure measurement and reported medication use.
Keywords: prevalence, education, foreign-born, National Health and Nutrition Examination Survey
During 2011–2012, most non-Hispanic Asian adults in the United States were foreign-born.
Figure 1. Selected demographic characteristics of non-Hispanic Asian and non-Hispanic white adults: United States, 2011–2012
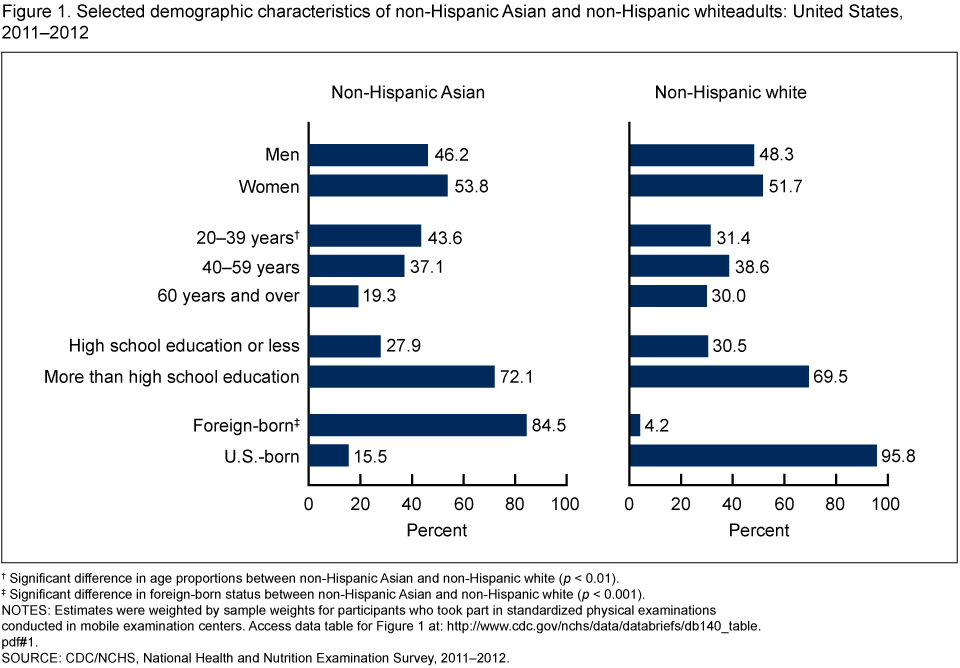
†Significant difference in age proportions between non-Hispanic Asian and non-Hispanic white (p < 0.01).
‡Significant difference in foreign-born status between non-Hispanic Asian and non-Hispanic white (p < 0.001).
NOTES: Estimates were weighted by sample weights for participants who took part in standardized physical examinations conducted in mobile examination centers. Access data table for Figure 1 [PDF – 525KB].
SOURCE: CDC/NCHS, National Health and Nutrition Examination Survey, 2011–2012.
Similar to non-Hispanic white adults, slightly more than one-half (53.8%) of non-Hispanic Asian adults were women, and 72.1% had more than a high school education (Figure 1). Non-Hispanic Asian adults were slightly younger than non-Hispanic white adults, with 43.6% aged 20–39 and 19.3% aged 60 and over compared with 31.4% and 30.0%, respectively. The majority (84.5%) of non-Hispanic Asian adults were foreign-born.
The prevalence of hypertension among non-Hispanic Asian adults increased with age and decreased with education.
About one-quarter (25.6%) of non-Hispanic Asian adults had hypertension [defined as having blood pressure greater than or equal to 140/90 millimeters (mm) mercury (Hg) or taking blood pressure-lowering medications] during 2011–2012 (Figure 2). Men and women did not differ in the prevalence of hypertension, but prevalence increased with age: 5.0% for the 20–39 age group, 26.5% for the 40–59 age group, and 59.6% for the 60 and over age group. Hypertension was lower among those with more than a high school education (22.8%) than among those with a high school education or less (31.9%). The prevalence of hypertension did not differ significantly by foreign-born status.
Figure 2. Prevalence of hypertension among non-Hispanic Asian adults, by sex, age, education, and foreign-born status: United States, 2011–2012
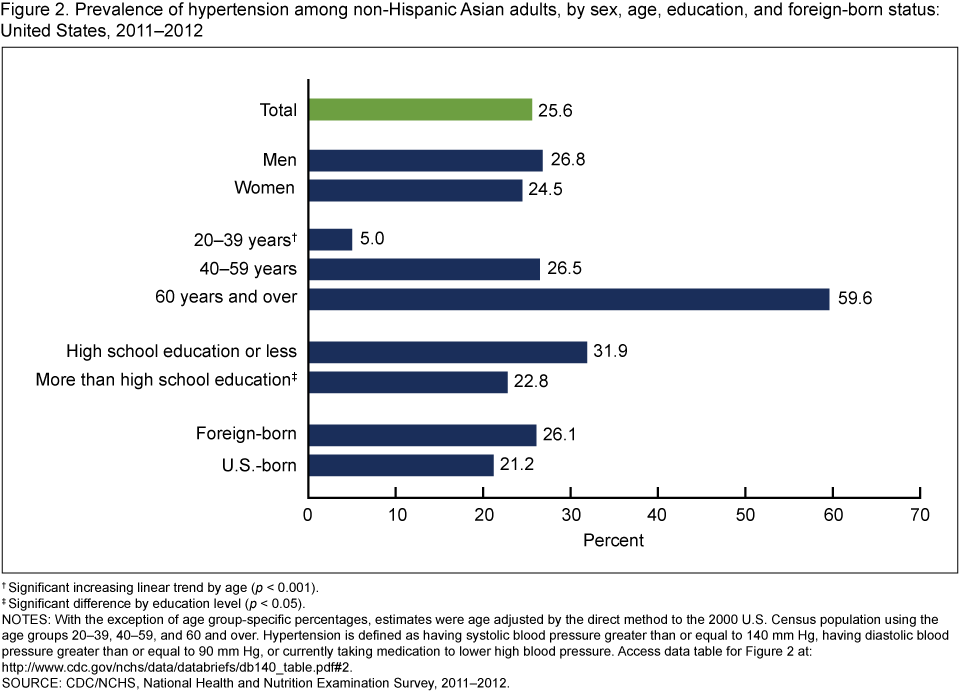
†Significant increasing linear trend by age (p < 0.001).
‡Significant difference by education level (p < 0.05).
NOTES: With the exception of age group-specific percentages, estimates were age adjusted by the direct method to the 2000 U.S. Census population using the age groups 20–39, 40–59, and 60 and over. Hypertension is defined as having systolic blood pressure greater than or equal to 140 mm Hg, having diastolic blood pressure greater than or equal to 90 mm Hg, or currently taking medication to lower high blood pressure. Access data table for Figure 2 [PDF – 525KB].
SOURCE: CDC/NCHS, National Health and Nutrition Examination Survey, 2011–2012.
During 2011–2012, the prevalence of high total cholesterol among non-Hispanic Asian adults did not differ by sex, age, education, or foreign-born status.
The prevalence of high total cholesterol [measured as serum total cholesterol of at least 240 milligrams per deciliter (mg/dL)] among non-Hispanic Asian adults was 10.3% (Figure 3). The prevalence of high total cholesterol did not differ significantly by sex, age, education, or foreign-born status.
Figure 3. Prevalence of measured high total cholesterol among non-Hispanic Asian adults, by sex, age, education, and foreign-born status: United States, 2011–2012
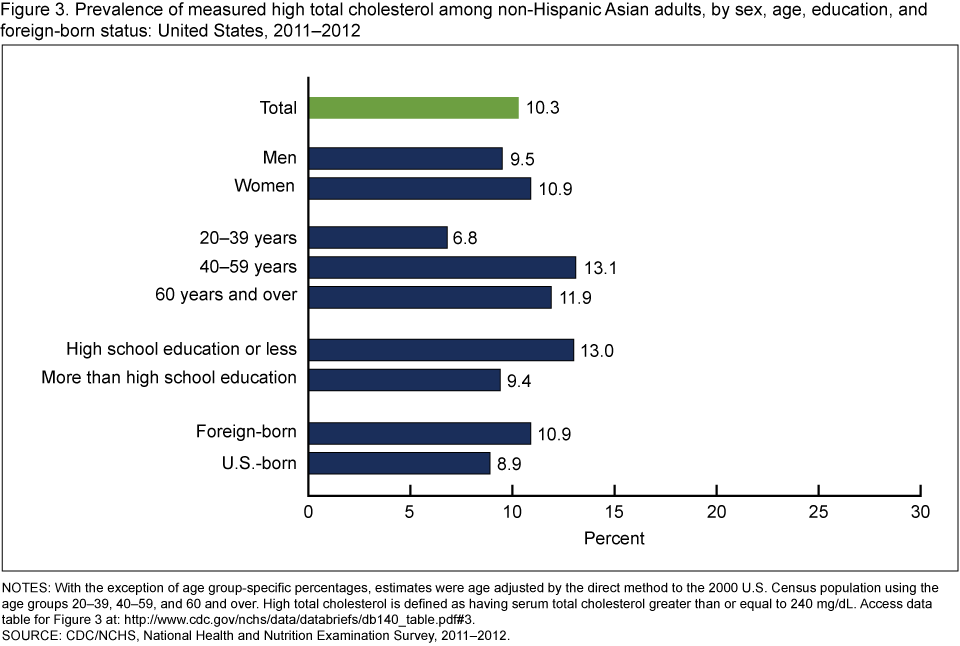
NOTES: With the exception of age group-specific percentages, estimates were age adjusted by the direct method to the 2000 U.S. Census population using the age groups 20–39, 40–59, and 60 and over. High total cholesterol is defined as having serum total cholesterol greater than or equal to 240 mg/dL. Access data table for Figure 3 [PDF – 525KB].
SOURCE: CDC/NCHS, National Health and Nutrition Examination Survey, 2011–2012.
The prevalence of low high-density lipoprotein (HDL) cholesterol was five times greater among non-Hispanic Asian men than women.
The prevalence of low HDL cholesterol (measured as serum HDL of less than 40 mg/dL) among non-Hispanic Asian adults was 14.3% (Figure 4). The prevalence of low HDL cholesterol was five times higher in men (24.5%) than in women (5.1%). Foreign-born adults had twice the prevalence of low HDL cholesterol compared with U.S.-born adults (15.4% and 7.7%, respectively). The prevalence of low HDL cholesterol did not differ significantly by age or education.
Figure 4. Prevalence of measured low HDL cholesterol among non-Hispanic Asian adults, by sex, age, education, and foreign-born status: United States, 2011–2012
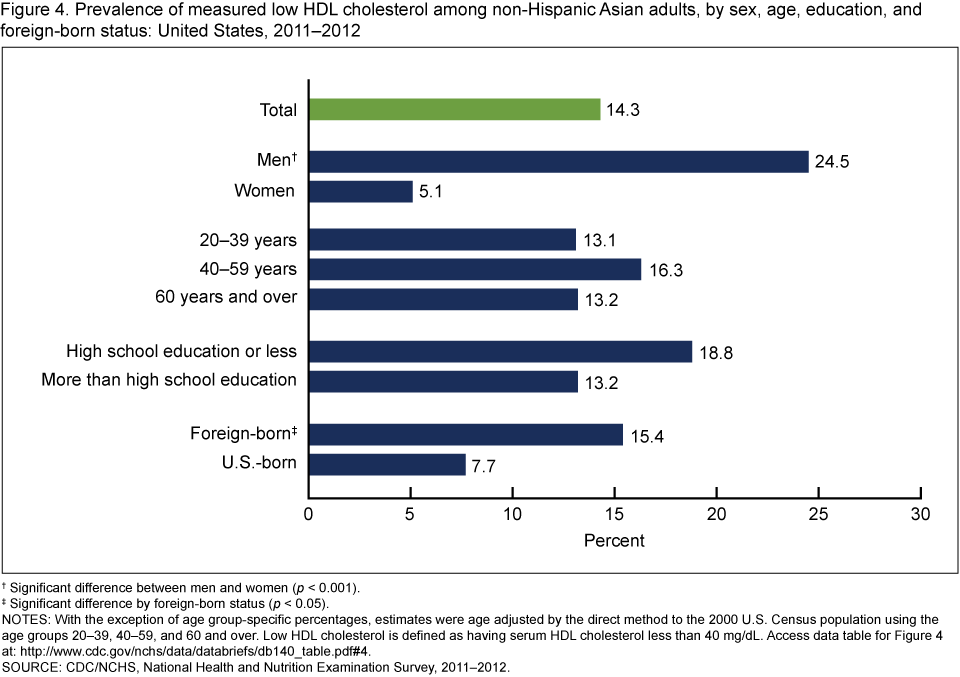
†Significant difference between men and women (p < 0.001).
‡Significant difference by foreign-born status (p < 0.05).
NOTES: With the exception of age group-specific percentages, estimates were age adjusted by the direct method to the 2000 U.S. Census population using the age groups 20–39, 40–59, and 60 and over. Low HDL cholesterol is defined as having serum HDL cholesterol less than 40 mg/dL. Access data table for Figure 4 [PDF – 525KB].
SOURCE: CDC/NCHS, National Health and Nutrition Examination Survey, 2011–2012.
The prevalence of high BMI differed by sex and age among non-Hispanic Asian adults.
The prevalence of high BMI [a BMI of at least 25 kilograms per square meter (kg/m2)] among non-Hispanic Asian adults was 38.6% (Figure 5). Adult men had a higher prevalence of high BMI (43.0%) than did adult women (34.7%). The prevalence of high BMI increased with age, such that adults aged 40–59 and those aged 60 and over had a prevalence almost 1.5 times higher than those aged 20–39. The prevalence of high BMI did not differ significantly by education or by foreign-born status.
Figure 5. Prevalence of high BMI among non-Hispanic Asian adults, by sex, age, education, and foreign-born status: United States, 2011–2012
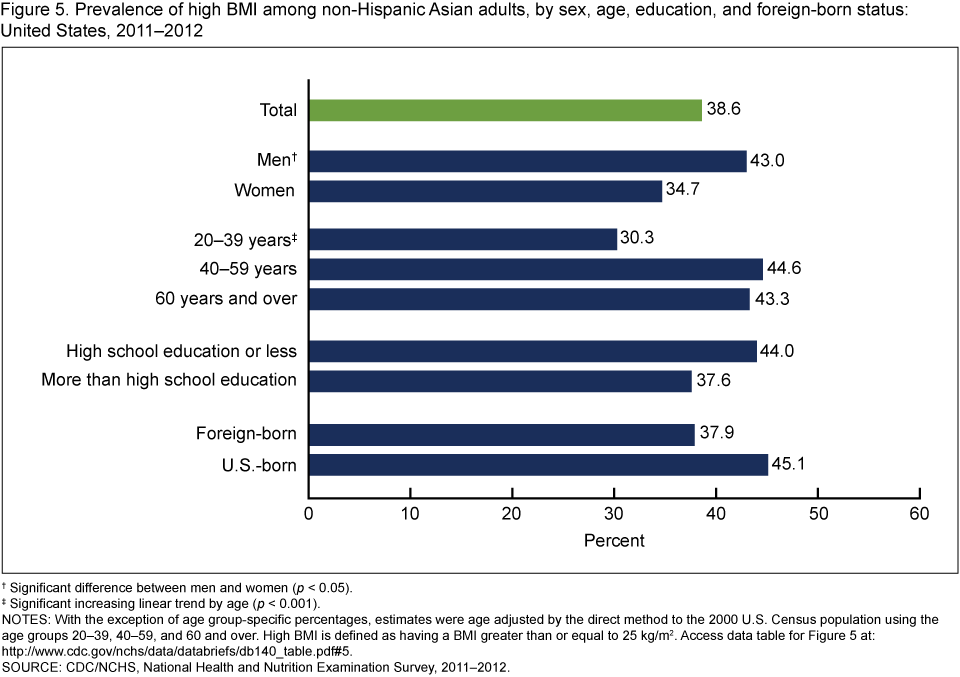
†Significant difference between men and women (p < 0.05).
‡Significant increasing linear trend by age (p < 0.001).
NOTES: With the exception of age group-specific percentages, estimates were age adjusted by the direct method to the 2000 U.S. Census population using the age groups 20–39, 40–59, and 60 and over. High BMI is defined as having a BMI greater than or equal to 25 kg/m2. Access data table for Figure 5 [PDF – 525KB].
SOURCE: CDC/NCHS, National Health and Nutrition Examination Survey, 2011–2012.
Summary
Non-Hispanic Asian adults constituted 4.9% of the U.S. population in 2012, corresponding to 15.4 million people (2). This group primarily comprises persons of Chinese, Asian Indian, Korean, Filipino, Vietnamese, and Japanese descent.
The prevalence of hypertension (defined as having blood pressure greater than or equal to 140/90 mm Hg or taking blood pressure-lowering medications) among non-Hispanic Asian adults aged 20 and over was 25.6%. As previously reported, this prevalence is similar to that of non-Hispanic white adults and Hispanic adults but lower than that of non-Hispanic black adults (3). Among non-Hispanic Asian adults, the prevalence of hypertension was higher among those who were older or had less education, similar to findings in U.S. adults overall (4,5).
The prevalence of high total cholesterol (measured as cholesterol of at least 240 mg/dL) among non-Hispanic Asian adults was similar to that among adults of other race and Hispanic origin groups (6). Non-Hispanic Asian adults had a lower prevalence of low HDL cholesterol (measured as HDL less than 40 mg/dL) than Hispanic persons (6). Non-Hispanic Asian adult men were almost five times more likely than non-Hispanic Asian adult women to have low HDL cholesterol. While adult men in general are known to have a higher prevalence of low HDL cholesterol than adult women (7), the sex difference was larger than in other race and Hispanic origin groups (6).
The prevalence of high BMI among non-Hispanic Asian adults (38.6%) was much lower than that previously reported for non-Hispanic white adults (66.7%), non-Hispanic black adults (76.7%), and Hispanic adults (78.8%) (8). BMI is widely used as a measure of body fat. However, at a given BMI level, body fat may vary by sex, age, and race and Hispanic origin. In particular, at a given BMI, Asian adults may have more body fat than white adults (9). Also, morbidity and mortality risk may be influenced by body composition and fat distribution in a manner that is not completely captured by BMI (10).
This report builds on recently published estimates of hypertension, cholesterol, and obesity from NHANES 2011–2012 (3,6,11) by providing related estimates for Asian adults by select demographic characteristics. Hypertension, abnormal cholesterol levels, and elevated body weight are important risk factors for major chronic diseases, for which differences by race as well as ethnicity have been reported. The Asian population includes many ethnic groups, and the majority of non-Hispanic Asian adults in the United States are immigrants (12). Note that these estimates are for non-Hispanic Asian persons overall and may not reflect patterns for specific subgroups of Asian persons.
Definitions
Hypertension: Indicated by having systolic blood pressure greater than or equal to 140 mm Hg, having diastolic blood pressure greater than or equal to 90 mm Hg, or currently taking medication to lower high blood pressure.
High total cholesterol: Indicated by having serum total cholesterol equal to or greater than 240 mg/dL.
Low HDL cholesterol: Indicated by having serum HDL cholesterol less than 40 mg/dL.
High BMI: Indicated by having a BMI (calculated as weight in kg divided by height in m2) of greater than or equal to 25 kg/m2.
Data source and methods
These analyses used NHANES data collected from 2011 through 2012. NHANES is a cross-sectional survey designed to monitor the health and nutritional status of the civilian noninstitutionalized U.S. population (13). The survey consists of interviews conducted in participants’ homes, standardized physical examinations conducted in mobile examination centers, and laboratory tests using blood and urine specimens provided by participants during the physical examination.
The NHANES sample is selected through a complex, multistage probability design that includes the selection of primary sampling units (counties), household segments within the counties, households within household segments, and sample persons from selected households. In 2011–2012, non-Hispanic black, Hispanic, and non-Hispanic Asian persons were oversampled to obtain reliable estimates of health and nutritional measures for these population subgroups. In 1999, NHANES became a continuous survey fielded on an ongoing basis. Each year of data collection is based on a representative sample covering all ages of the civilian noninstitutionalized population. Public-use data files are released in 2-year cycles.
Race and Hispanic origin were self-reported during the home interview. This report analyzed the non-Hispanic Asian group. Participants who reported an Asian race and another race are not included in this category.
The estimation process incorporates sample weights, which account for the differential probabilities of selection, nonresponse, and noncoverage. Variance estimates were calculated using Taylor series linearization to account for the complex survey design. Pregnant women were excluded from the analyses for hypertension and high BMI.
Estimates of proportions by sex, age, education, and foreign-born status shown in Figure 1 were not age adjusted. Estimates of prevalence for hypertension, abnormal cholesterol, and high BMI, shown in Figures 2–5, were age adjusted using the direct method to the 2000 U.S. Census population with the age groups 20–39, 40–59, and 60 and over. Differences between groups were tested using the Wald test at the p < 0.05 significance level. All differences reported are statistically significant unless otherwise indicated. Adjustments were not made for multiple comparisons. Statistical analyses were conducted using Stata version 12.0 (College Station, Tex.).
About the authors
Yutaka Aoki, Sung Sug Yoon, Yinong Chong, and Margaret D. Carroll are with CDC’s National Center for Health Statistics, Division of Health and Nutrition Examination Surveys.
References
- Hoeffel EM, Rastogi S, Kim MO, Shahid H. The Asian population: 2010. Washington, DC: U.S. Department of Commerce, Economics and Statistics Administration, U.S. Census Bureau. 2012.
- U.S. Census Bureau. 2012 American Community Survey 1-year estimates: DP05–ACS demographic and housing estimates. Washington, DC.
- Nwankwo T, Yoon SS, Burt V, Gu Q. Hypertension among adults in the United States: National Health and Nutrition Examination Survey, 2011–2012 [PDF – 778KB]. NCHS data brief, no 133. Hyattsville, MD: National Center for Health Statistics. 2013.
- Yoon SS, Burt V, Louis T, Carroll MD. Hypertension among adults in the United States, 2009–2010 [PDF – 752KB]. NCHS data brief, no 107. Hyattsville, MD: National Center for Health Statistics. 2012.
- Keenan NL, Rosendorf KA. Prevalence of hypertension and controlled hypertension—United States, 2005–2008. MMWR Surveill Summ 60(Suppl):94–7. 2011.
- Carroll MD, Kit BK, Lacher DA, Yoon SS. Total and high-density lipoprotein cholesterol in adults: National Health and Nutrition Examination Survey, 2011–2012 [PDF – 779KB]. NCHS data brief, no 132. Hyattsville, MD: National Center for Health Statistics. 2013.
- Carroll MD, Kit BK, Lacher DA. Total and high-density lipoprotein cholesterol in adults: National Health and Nutrition Examination Survey, 2009–2010 [PDF – 511KB]. NCHS data brief, no 92. Hyattsville, MD: National Center for Health Statistics. 2012.
- Flegal KM, Carroll MD, Kit BK, Ogden CL. Prevalence of obesity and trends in the distribution of body mass index among U.S. adults, 1999–2010. JAMA 307(5):491–7. 2012.
- Deurenberg P, Deurenberg-Yap M, Guricci S. Asians are different from Caucasians and from each other in their body mass index/body fat per cent relationship. Obes Rev 3(3):141–6. 2002.
- Despres JP. Body fat distribution and risk of cardiovascular disease: An update. Circulation 126(10):1301–13. 2012.
- Ogden CL, Carroll MD, Kit BK, Flegal KM. Prevalence of obesity among adults: United States, 2011–2012 [PDF – 782KB]. NCHS data brief, no 131. Hyattsville, MD: National Center for Health Statistics. 2013.
- Barnes PM, Adams PF, Powell-Griner E. Health characteristics of the Asian adult population: United States, 2004–2006 [PDF – 476KB]. Advance data from vital and health statistics; no 394. Hyattsville, MD: National Center for Health Statistics. 2008.
- National Center for Health Statistics. National Health and Nutrition Examination Survey. Questionnaires, datasets, and related documentation. Hyattsville, MD.
Suggested citation
Aoki Y, Yoon SS, Chong Y, Carroll MD. Hypertension, abnormal cholesterol, and high body mass index among non-Hispanic Asian adults: United States, 2011–2012. NCHS data brief, no 140. Hyattsville, MD: National Center for Health Statistics. 2014.
Copyright information
All material appearing in this report is in the public domain and may be reproduced or copied without permission; citation as to source, however, is appreciated.
National Center for Health Statistics
Charles J. Rothwell, M.S., M.B.A., Director
Jennifer H. Madans, Ph.D., Associate Director for Science
Division of Health and Nutrition Examination Surveys
Kathryn S. Porter, M.D., M.S., Director