Trends in Insurance Coverage and Source of Private Coverage Among Young Adults Aged 19–25: United States, 2008–2012
- Key findings
- The percentage of those aged 19–25 with private health insurance coverage has increased, and the percentage uninsured has decreased.
- The percentage of privately insured young adults aged 19–25 who had a gap in coverage in the past 12 months has decreased.
- The percentage of young adults who are the policyholders for their private coverage has decreased.
- The percentage of privately insured young adults with employer-sponsored coverage has increased since the last 6 months of 2010.
- Summary
- Definitions
- Data source and methods
- About the authors
- References
- Suggested citation
NCHS Data Brief No. 137, December 2013
PDF Version (957 KB)
Whitney K. Kirzinger, M.P.H., Robin A. Cohen, Ph.D., and Renee M. Gindi, Ph.D.
Key findings
Data from the National Health Interview Survey, 2008–2012
- The percentage of young adults with private health insurance coverage increased from the last 6 months of 2010 through the last 6 months of 2012 (52.0% to 57.9%).
- Except for an increase in the first 6 months of 2011, the percentage of privately insured young adults who had a gap in coverage during the past 12 months decreased from the first 6 months of 2008 through the last 6 months of 2012 (10.5% to 7.8%).
- The percentage of privately insured young adults with coverage in their own name decreased from 40.8% in the last 6 months of 2010 to 27.2% in the last 6 months of 2012.
- The percentage of privately insured young adults with employer-sponsored health insurance increased from the last 6 months of 2010 to the last 6 months of 2012 (85.6% to 92.5%).
Young adults often experience instability with regard to work, school, residential status, and financial independence. This could contribute to a lack of or gaps in insurance coverage (1,2). In September 2010, the Affordable Care Act (ACA) extended dependent health coverage to young adults up to age 26. This provision was expected to lead to increases in private coverage for young adults aged 19–25 when they became eligible for coverage through their parents’ employment (3,4). This report provides estimates describing the previous insurance status and sources of coverage among privately insured young adults aged 19–25, using data from the 2008–2012 National Health Interview Survey (NHIS). Comparisons are made with adults aged 26–34, the most similar age group that was not affected by the ACA provision.
Keywords: Affordable Care Act (ACA), private health insurance, policyholder
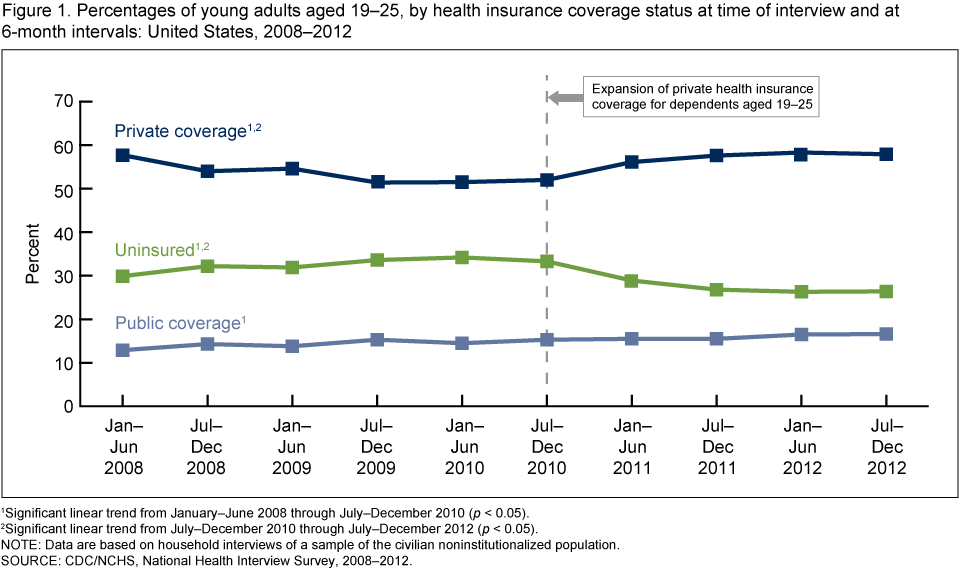
The percentage of those aged 19–25 with private health insurance coverage has increased, and the percentage uninsured has decreased.
Figure 1. Percentages of young adults aged 19–25, by health insurance coverage status at time of interview and at 6-month intervals: United States, 2008–2012
1Significant linear trend from January–June 2008 through July–December 2010 (p < 0.05).
2Significant linear trend from July–December 2010 through July–December 2012 (p < 0.05).
NOTE: Data are based on household interviews of a sample of the civilian noninstitutionalized population.
SOURCE: CDC/NCHS, National Health Interview Survey, 2008–2012.
- Among young adults aged 19–25, the percentage with private health insurance coverage increased from the last 6 months of 2010 through the last 6 months of 2012 (52.0% to 57.9%), after decreasing from the first 6 months of 2008 through the last 6 months of 2010 (57.7% to 52.0%) (Figure 1).
- Among young adults aged 19–25, the percentage who were uninsured decreased from the last 6 months of 2010 through the last 6 months of 2012 (33.3% to 26.4%), after significantly increasing from the first 6 months of 2008 through the last 6 months of 2010 (29.9% to 33.3%).
- The percentage of young adults with public coverage increased from the first 6 months of 2008 to the last 6 months of 2010 (12.9% to 15.3%) but remained stable from the last 6 months of 2010 to the last 6 months of 2012.
The percentage of privately insured young adults aged 19–25 who had a gap in coverage in the past 12 months has decreased.
- In the last 6 months of 2010, 9.7% of young adults aged 19–25 had been uninsured at some time in the past 12 months. This percentage increased sharply to 13.2% in the first 6 months of 2011, but by the last 6 months of 2012 it had been cut in half to 6.7% (Figure 2).
- In contrast, the percentage of adults aged 26–34 who had been uninsured at some time in the past 12 months remained stable from 2008 through 2012.
- For each 6-month interval from January–June 2008 through January–June 2011, the percentage of adults who had been uninsured at some time in the past 12 months was significantly higher among those aged 19–25 compared with those aged 26–34. From July–December 2011 to July–December 2012, the two age groups did not differ significantly.
Figure 2. Percentages of privately insured adults aged 19–34 who were uninsured at some point in the past 12 months, by age group and 6-month interval: United States, 2008–2012

1Significant linear trend from January–June 2008 through July–December 2010 (p < 0.05).
2Significant linear trend from July–December 2010 through July–December 2012 (p < 0.05).
NOTE: Data are based on household interviews of a sample of the civilian noninstitutionalized population.
SOURCE: CDC/NCHS, National Health Interview Survey, 2008–2012.
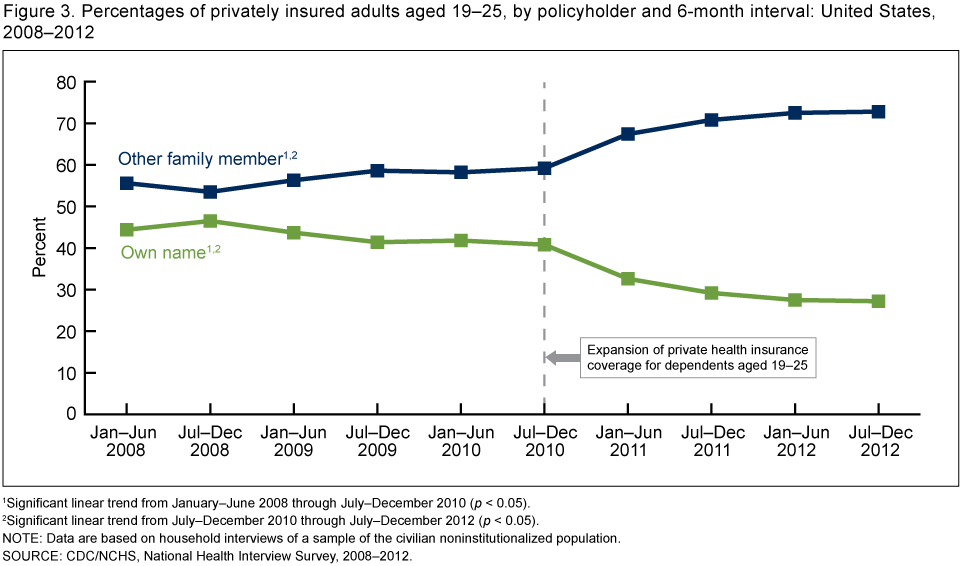
The percentage of young adults who are the policyholders for their private coverage has decreased.
- Privately insured young adults aged 19–25 were less likely to have coverage in their own names in the last 6 months of 2012 (27.2%) compared with the last 6 months of 2010 (40.8%) (Figure 3).
- The proportion of privately insured young adults who obtained their coverage through some other family member increased by 14 percentage points (59.2% in the last 6 months of 2010 to 72.8% in the last 6 months of 2012). This came after a slight increase from the first
6 months of 2008 to the last 6 months of 2010 (55.6% to 59.2%).
Figure 3. Percentages of privately insured adults aged 19–25, by policyholder and 6-month interval: United States, 2008–2012
1Significant linear trend from January–June 2008 through July–December 2010 (p < 0.05).
2Significant linear trend from July–December 2010 through July–December 2012 (p < 0.05).
NOTE: Data are based on household interviews of a sample of the civilian noninstitutionalized population.
SOURCE: CDC/NCHS, National Health Interview Survey, 2008–2012.
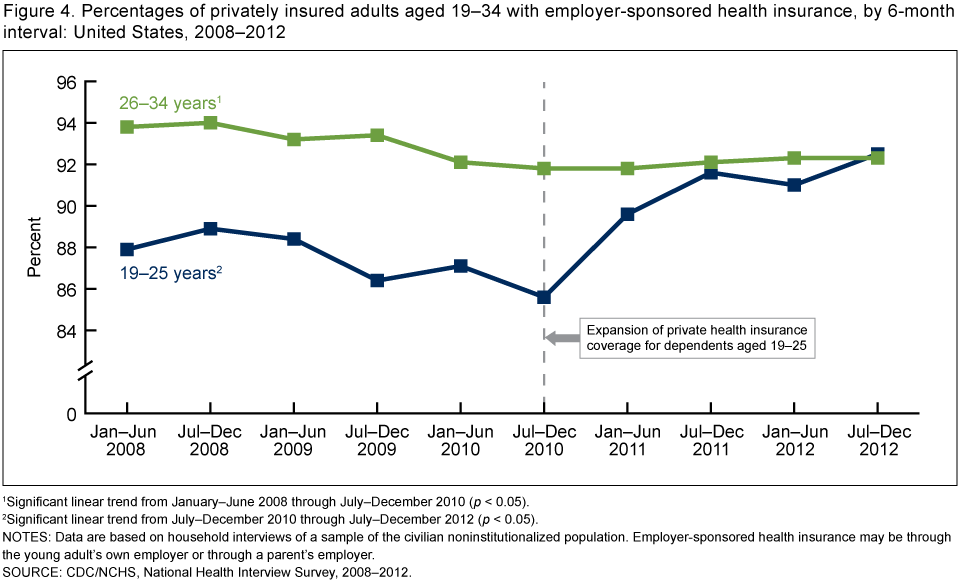
The percentage of privately insured young adults with employer-sponsored coverage has increased since the last 6 months of 2010.
- Among privately insured young adults aged 19–25, the percentage with employer-sponsored health insurance was stable from the first 6 months of 2008 through the last 6 months of 2010 but then increased from 85.6% in the last 6 months of 2010 to 92.5% in the last 6 months of 2012 (Figure 4).
- By comparison, a decreasing trend was apparent in the percentage of adults aged 26–34 with employer-sponsored health insurance from the first 6 months of 2008 through the last 6 months of 2010 (93.8% to 91.8%), but the percentages remained stable from the last 6 months of 2010 through the last 6 months of 2012.
- For each 6-month interval from January–June 2008 through January–June 2011, the percentage of adults with employer-sponsored health insurance was significantly lower among those aged 19–25 compared with those aged 26–34. From July–December 2011 to July–December 2012, the two age groups did not differ significantly.
Figure 4. Percentages of privately insured adults aged 19–34 with employer-sponsored health insurance, by 6-month interval: United States, 2008–2012
1Significant linear trend from January–June 2008 through July–December 2010 (p < 0.05).
2Significant linear trend from July–December 2010 through July–December 2012 (p < 0.05).
NOTES: Data are based on household interviews of a sample of the civilian noninstitutionalized population. Employer-sponsored health insurance may be through the young adult’s own employer or through a parent’s employer.
SOURCE: CDC/NCHS, National Health Interview Survey, 2008–2012.
Summary
This report shows that since September 2010, when young adults aged 19–25 were able to obtain dependent private health insurance coverage through a provision of the ACA, the percentage of young adults with private insurance increased and the percentage without insurance decreased. The increase in the percentage with private insurance occurred at about the same time (January–June 2011) as a temporary increase in the percentage of privately insured young adults who had been uninsured at some time in the past 12 months. This suggests that those newly insured were previously uninsured or had a period of no insurance in the past year. After this spike, the percentage of young adults with a period of no insurance did not return to pre-2011 levels but rather declined to levels consistent with slightly older adults.
Since September 2010, the percentage of young adults who obtained coverage through some other family member increased, and the percentage of young adults with coverage sponsored through the employer of the policyholder (the parent or the young adult) increased. Additional research is needed to determine the extent to which the increase in dependent coverage among the privately insured reflects the acquisition of dependent coverage among the uninsured or the substitution of dependent coverage for self-coverage.
Definitions
Having a period of uninsurance in the last 12 months: Determined by the question, “In the past 12 months, was there any time when [person] did not have any health insurance or coverage?”
Policyholder: Identified by the question, “Health insurance plans are usually obtained in one person’s name even if other family members are covered. That person is called the policyholder. In whose name is this plan?” The answer categories, “in own name,” “someone else in family,” and “person not in household,” are mutually exclusive.
Other family member: Determined by the question, “Health insurance plans are usually obtained in one person’s name even if other family members are covered. That person is called the policyholder. In whose name is this plan?” The answer categories, “in own name,” “someone else in family,” and “person not in household,” are mutually exclusive. “Other family member” includes “someone else in family” and “person not in household.”
Employer-sponsored coverage: Determined by the question, “Which one of these categories best describes how this plan was obtained?” A respondent is considered to have employer-sponsored coverage if the coverage was originally obtained through a present or former employer, workplace, union, or professional association. Employer-sponsored coverage could be through the young adult’s own employment or through a parent’s employer.
Data source and methods
Data from the 2008–2012 NHIS were used for this analysis. Interviewers from the U.S. Census Bureau collect NHIS data continuously throughout the year for the Centers for Disease Control and Prevention’s (CDC) National Center for Health Statistics (NCHS). NHIS collects information about the health and health care of the civilian noninstitutionalized U.S. population. Interviews are conducted in respondents’ homes, but follow-ups to complete interviews may be conducted over the telephone. Questions about health insurance coverage are from the Family Core component, which collects information on all family members. This analysis included only adults aged 19–34. In 2008–2012, data were collected on 42,507 persons aged 19–25 and 55,403 persons aged 26–34. For further information about NHIS, including the questionnaire, see the NHIS website.
NHIS is designed to yield a sample representative of the civilian noninstitutionalized population of the United States, and weights are used to produce national estimates. Data weighting procedures are described in more detail elsewhere (5). Point estimates, estimates of corresponding variances, and logistic regression models for trend analysis were calculated using SUDAAN software (6) to account for the complex sample design of NHIS. The Taylor series linearization method was chosen for variance estimation. All estimates shown in this report meet the NCHS standard of reliability (relative standard error less than or equal to 30%). Differences between percentages were evaluated using two-sided significance tests at the 0.05 level. Terms such as “increased,” “decreased,” and “higher than” indicate statistically significant trends or differences. Terms such as “remained stable” and “no difference” indicate trends or comparisons that were not significantly different. Lack of comment regarding the difference between any two statistics does not necessarily suggest that the difference was tested and found not to be significant.
About the authors
Whitney K. Kirzinger, Robin A. Cohen, and Renee M. Gindi are with CDC’s National Center for Health Statistics, Division of Health Interview Statistics.
References
- Cohen RA, Martinez ME. Health insurance coverage: Early release of estimates from the National Health Interview Survey, 2012 [PDF – 942KB]. Hyattsville, MD: National Center for Health Statistics. 2013.
- Short PF, Graefe DR, Swartz K, Uberoi N. New estimates of gaps and transitions in health insurance. Med Care Res Rev 69(6):721–36. 2012.
- Sommers BD, Kronick R. The Affordable Care Act and insurance coverage for young adults. JAMA 307(9):913–4. 2012.
- Schwartz K, Sommers BD. Young adults are particularly likely to gain stable health insurance coverage as a result of the Affordable Care Act. ASPE research brief. Washington, DC: U.S. Department of Health and Human Services, Office of the Assistant Secretary for Planning and Evaluation. 2012.
- Botman SL, Moore TF, Moriarity CL, Parsons VL. Design and estimation for the National Health Interview Survey, 1995–2004. National Center for Health Statistics. Vital Health Stat 2(130). 2000.
- RTI International. SUDAAN (Release 10.0) [computer software]. 2008.
Suggested citation
Kirzinger WK, Cohen RA, Gindi RM. Trends in insurance coverage and source of private coverage among young adults aged 19–25: United States, 2008–2012. NCHS data brief, no 137. Hyattsville, MD: National Center for Health Statistics. 2013.
Copyright information
All material appearing in this report is in the public domain and may be reproduced or copied without permission; citation as to source, however, is appreciated.
National Center for Health Statistics
Charles J. Rothwell, M.S., Acting Director
Jennifer H. Madans, Ph.D., Associate Director for Science
Division of Health Interview Statistics
Jane F. Gentleman, Ph.D., Director