Declines in State Teen Birth Rates by Race and Hispanic Origin
- Key findings
- Birth rates for teenagers fell for all race and Hispanic origin groups from 1991 through 2011 with much of the decline from 2007 through 2011.
- Declines in teen birth rates from 2007 through 2011 were generally largest in the Southeast, Mountain and Pacific areas, and in the upper Midwest.
- Birth rates for non-Hispanic white teenagers fell at least 20% in 30 states from 2007 through 2011.
- The largest declines in birth rates for non-Hispanic black teenagers—30% or more—occurred in eight states from 2007 through 2011.
- Declines in birth rates among Hispanic teenagers were the largest of any group, with rates falling by at least 40% in 22 states and DC.
- Summary
- Definition
- Data sources and methods
- About the authors
- References
- Suggested citation
NCHS Data Brief No. 123, May, 2013
PDF Version (933 KB)
Brady E. Hamilton, Ph.D.; T.J. Mathews, M.S.; and Stephanie J. Ventura, M.A.
Key findings
- Teen birth rates fell at least 15% for all but two states during 2007–2011—the most recent period of sustained decline; rates fell 30% or more in seven states.
- Declines in rates were steepest for Hispanic teenagers, averaging 34% for the United States, followed by declines of 24% for non-Hispanic black teenagers and 20% for non-Hispanic white teenagers.
- The long-term difference between birth rates for non-Hispanic black and Hispanic teenagers has essentially disappeared, and by 2011 their rates were similar.
- Rates for Hispanic teenagers fell 40% or more in 22 states and the District of Columbia (DC); rates dropped at least 30% in 37 states and DC.
Teen birth rates fell steeply in the United States from 2007 through 2011, resuming a decline that began in 1991 but was briefly interrupted in 2006 and 2007. The overall rate declined 25% from 41.5 per 1,000 teenagers aged 15–19 in 2007 to 31.3 in 2011—a record low. The number of births to teenagers aged 15–19 also fell from 2007 to 2011, by 26% to 329,797 in 2011. Births to teenagers are at elevated risk of low birthweight, preterm birth, and of dying in infancy compared with infants born to women aged 20 and over (1–3), and they are associated with significant public costs, estimated at $10.9 billion annually (4). Recent trends by state and race and Hispanic origin are illustrated using the most current available data from the National Vital Statistics System.
Keywords: teen childbearing, geographic differences and trends, National Vital Statistics System
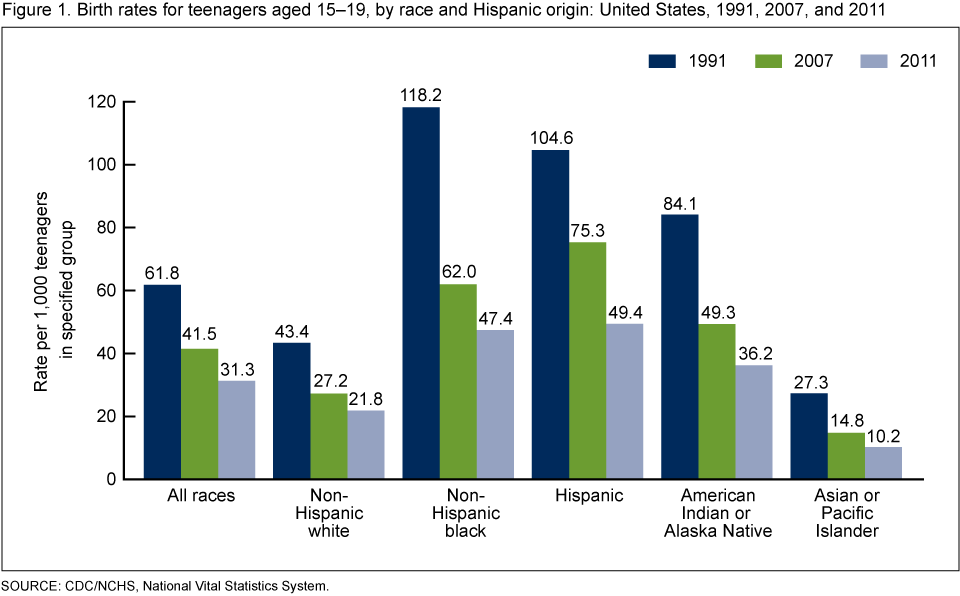
Birth rates for teenagers fell for all race and Hispanic origin groups from 1991 through 2011 with much of the decline from 2007 through 2011.
Figure 1. Birth rates for teenagers aged 15–19, by race and Hispanic origin: United States, 1991, 2007, and 2011
SOURCE: CDC/NCHS, National Vital Statistics System.
- The overall teen birth rate dropped by almost one-half, from 61.8 per 1,000 teenagers aged 15–19 to 31.3 (5) (Figure 1).
- The rates for non-Hispanic white, Hispanic, and American Indian or Alaska Native (AIAN) teenagers fell 50% or more during these two decades, while rates for non-Hispanic black and Asian or Pacific Islander (API) teenagers declined at least 60%.
- In the recent 2007–2011 period, the largest decline (34%) was reported for Hispanic teenagers.
- The rate for Hispanic teenagers was 21% higher than the rate for non-Hispanic black teenagers in 2007, but by 2011 the rate for Hispanic teenagers was just 4% higher.
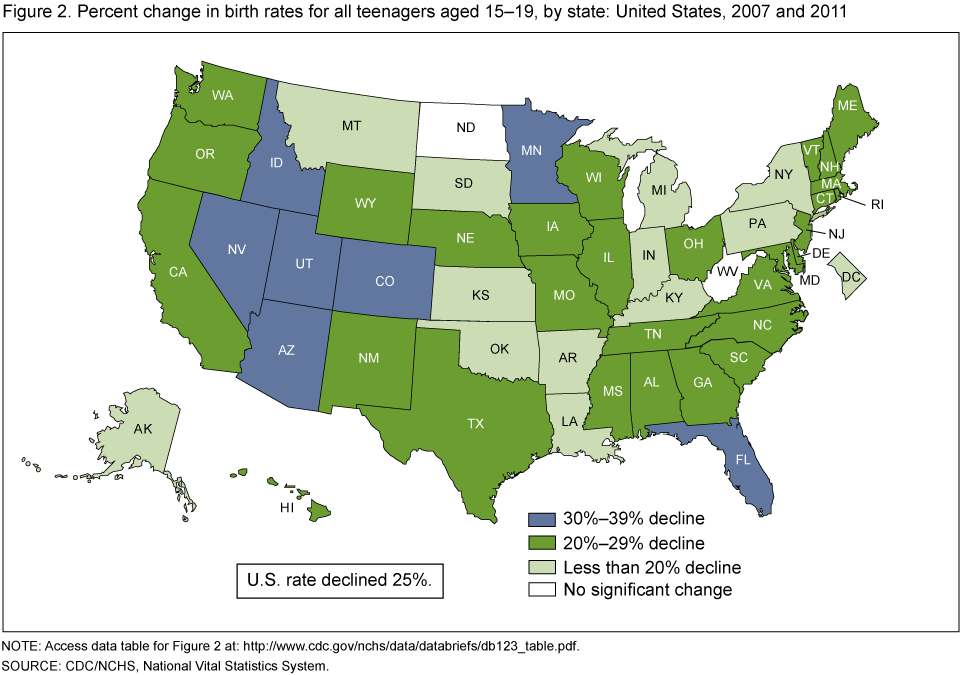
Declines in teen birth rates from 2007 through 2011 were generally largest in the Southeast, Mountain and Pacific areas, and in the upper Midwest.
- Rates fell at least 30% in seven states during 2007–2011. Rates in Arizona and Utah declined the most, 35% each (Figure 2).
- The smallest declines, ranging from 15% to 19%, were reported for 12 states and the District of Columbia (DC).
- Changes were not significant in just two states—North Dakota and West Virginia.
Figure 2. Percent change in birth rates for all teenagers aged 15–19, by state: United States, 2007 and 2011
NOTE: Access data table for Figure 2 [PDF – 200 KB].
SOURCE: CDC/NCHS, National Vital Statistics System.
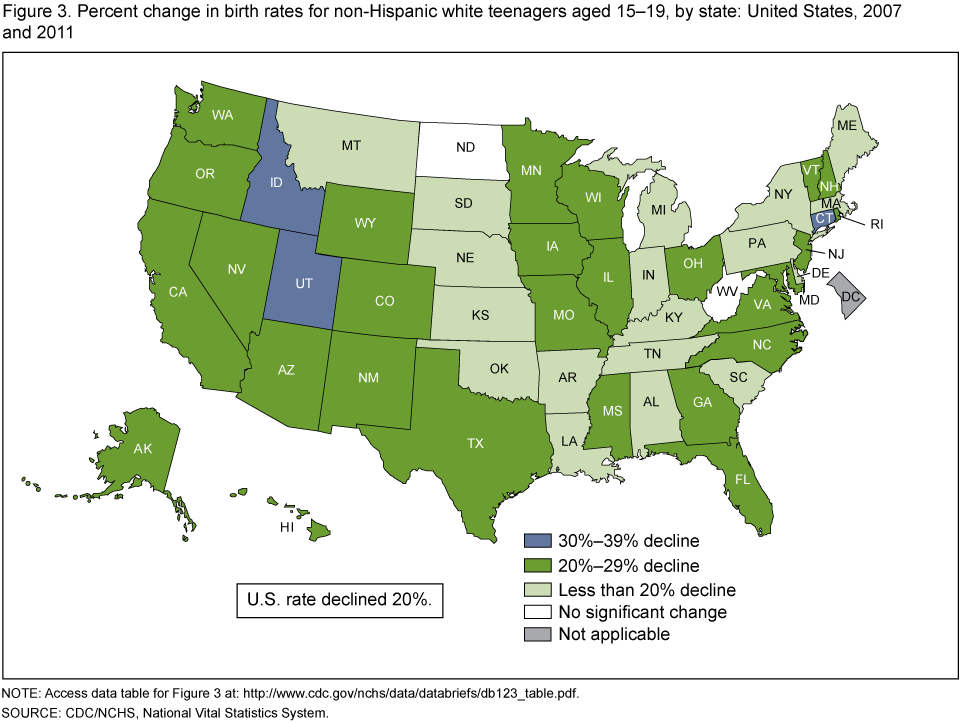
Birth rates for non-Hispanic white teenagers fell at least 20% in 30 states from 2007 through 2011.
- The overall birth rate for non-Hispanic white teenagers dropped 20% from 2007 through 2011 (Figure 3).
- Rates fell by 20% or more in 30 states that were generally located in the Pacific and Mountain areas and scattered in other sections of the country.
- Declines ranging from 10% to 19% were reported for states scattered in the Midwest and Northeast. Changes were not significant in North Dakota and West Virginia.
- Among the 14 states with the largest declines in non-Hispanic white teenage birth rates, 6 had rates above the U.S. rate for this group (21.8 per 1,000).
Figure 3. Percent change in birth rates for non-Hispanic white teenagers aged 15–19, by state: United States, 2007 and 2011
NOTE: Access data table for Figure 3 [PDF – 200 KB].
SOURCE: CDC/NCHS, National Vital Statistics System.
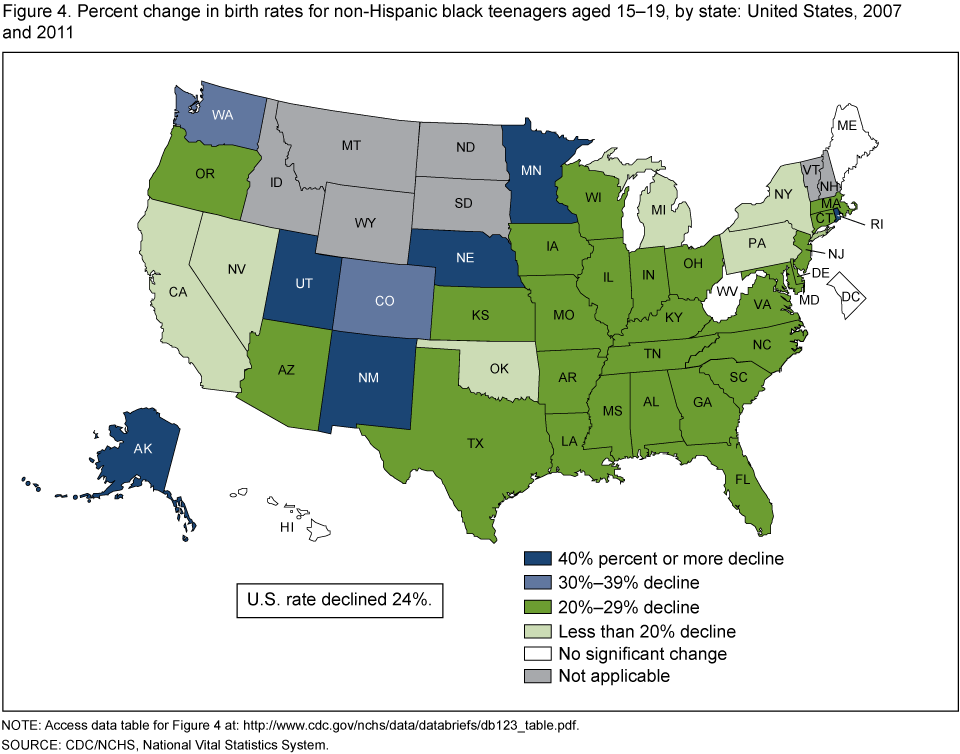
The largest declines in birth rates for non-Hispanic black teenagers—30% or more—occurred in eight states from 2007 through 2011.
- Declines of 20% or more were reported for non-Hispanic black teenagers during 2007–2011 in 34 states located in the Southwest, upper Midwest, and Southeast (Figure 4).
- In states with at least 100 births to non-Hispanic black teenagers, the largest declines, between 41% and 50%, were observed for Minnesota, Nebraska, and Rhode Island.
- The 21 states with the largest rate declines included only 6 states with rates above the U.S. average—47.4 per 1,000 for this group.
- Changes were not significant in DC, Hawaii, Maine, and West Virginia.
Figure 4. Percent change in birth rates for non-Hispanic black teenagers aged 15–19, by state: United States, 2007 and 2011
NOTE: Access data table for Figure 4 [PDF – 200 KB].
SOURCE: CDC/NCHS, National Vital Statistics System.
Declines in birth rates among Hispanic teenagers were the largest of any group, with rates falling by at least 40% in 22 states and DC.
- Rates fell 40% or more for Hispanic teenagers in 22 states and DC from 2007 through 2011 (Figure 5).
- The largest declines were measured mainly in the Southeast and a few states in other regions.
- Declines amounted to at least 25% in all but five states where the changes were not significant or could not be calculated.
- Six of the 10 states with the largest declines in birth rates for Hispanic teenagers were states with rates well above the national rate—49.4 births per 1,000 women aged 15–19 for this group.
Figure 5. Percent change in birth rates for Hispanic teenagers aged 15–19, by state: United States, 2007 and 2011
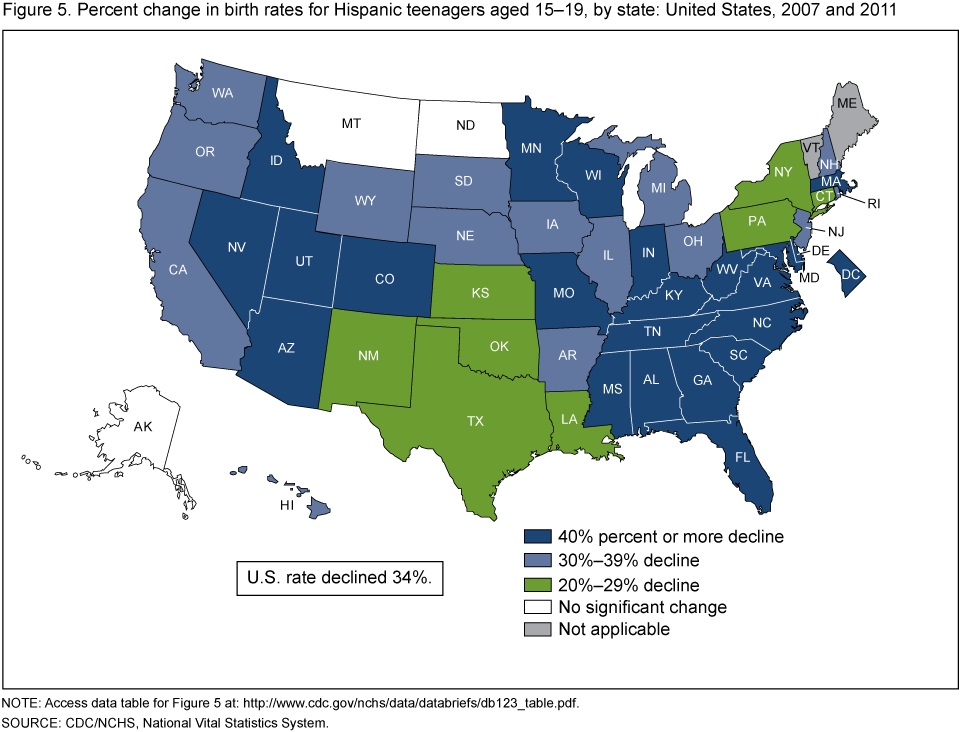
NOTE: Access data table for Figure 5 [PDF – 200 KB].
SOURCE: CDC/NCHS, National Vital Statistics System.
Summary
The recent declines in teen childbearing are sustained, widespread, and broad-based. If teen birth rates by age and race and Hispanic origin of mother had remained at their 1991 levels, an estimated 3.6 million more births to teenagers would have occurred from 1992 through 2011 (6,7). The declines in teen birth rates have been attributed to a number of factors, including strong teen pregnancy prevention messages (8–10). The latest data from the National Survey of Family Growth show increased use of contraception at first sex and the use of dual methods of contraception (that is, condoms and hormonal methods) among sexually active female and male teenagers (11). Recent data from the Youth Risk Behavioral Surveillance Survey also show wide variation across states in the extent to which sexually active teenagers are using the most effective methods of contraception (12).
The three largest population groups experienced declines in their teen birth rates of 20% to 34% at the national level from 2007 through 2011. Birth rates also are down significantly for API and AIAN teenagers, though small numbers preclude analysis of changes by state for these groups. Despite this substantial impact, the U.S. teen birth rate remains one of the highest among Western countries (13).
The race and Hispanic origin-specific birth rates by state and the population composition of states by race and Hispanic origin both contribute to state variations in the teen birth rate as well as to variations in the trends. Historically, U.S. birth rates have been higher for Hispanic and non-Hispanic black teenagers than for non-Hispanic white teenagers. Thus, states with large proportions of Hispanic or non-Hispanic black teenagers would be expected to have higher overall teen birth rates. These patterns might also be expected to influence the recent trends in rates by race and Hispanic origin across states. Previous reports have explored the variations in rates across states within race and Hispanic groups (6,14,15). This report shows the extent to which declines in birth rates by race and Hispanic origin have varied across states. In general, declines have been widespread across all states, with the largest declines generally observed in the Southeast, Mountain, and Pacific states.
Definition
Teen birth rate: The number of births to women aged 15–19 per 1,000 women aged 15–19 (or teen subgroup).
Data sources and methods
This report contains data from the Natality Data File from the National Vital Statistics System. The vital statistics natality file includes information for all births occurring in the United States. The natality files include information on a wide range of maternal and infant demographic and health characteristics for babies born in the United States. The natality files are available from the Centers for Disease Control and Prevention’s National Center for Health Statistics’ (NCHS) website. Data for 2010 and earlier years may also be accessed from the interactive data access tool, VitalStats.
Birth rates for teenagers for 2011 are based on preliminary birth data. Information on the 2011 data is available elsewhere (5). Population data for computing birth rates for 2011 were provided by the U.S. Census Bureau and are projected based on the April 1, 2010 census (16). Rates for 2007 are based on newly released and revised intercensal population estimates based on the 2000 and 2010 censuses (1,16). These rates may differ from the intercensal rates published in “Births: Final Data for 2010,” the original rates published in “Births: Final Data for 2009,” and earlier reports that were based on 2000 postcensal population estimates. See the forthcoming report “Births: Final Data for 2011” for more information on the revised rates (17). Rates by state shown here may differ from rates computed on the basis of other population estimates (1). Note that birth rates by state are not shown for groups with fewer than 20 births in the numerator.
About the authors
Brady E. Hamilton, T.J. Mathews, and Stephanie J. Ventura are with NCHS’ Division of Vital Statistics, Reproductive Statistics Branch.
References
- Martin JA, Hamilton BE, Ventura SJ, et al. Births: Final data for 2010. National vital statistics reports; vol 61 no 1. Hyattsville, MD: National Center for Health Statistics. 2012.
- Martin JA, Osterman MJK, Sutton PD. Are preterm births on the decline in the United States? Recent data from the National Vital Statistics System. NCHS data brief, no 39. Hyattsville, MD: National Center for Health Statistics. 2010.
- Mathews TJ, MacDorman MF. Infant mortality statistics from the 2009 period linked birth/infant death data set. National vital statistics reports; vol 61 no 8. Hyattsville, MD: National Center for Health Statistics. 2013.
- The National Campaign to Prevent Teen and Unplanned Pregnancy. Counting it up: The public costs of teen childbearing: Key data [PDF – 176 KB].
- Hamilton BE, Martin JA, Ventura SJ. Births: Preliminary data for 2011. National vital statistics reports; vol 61 no 5. Hyattsville, MD: National Center for Health Statistics. 2012.
- Hamilton BE, Ventura SJ. Birth rates for U.S. teenagers reach historic lows for all age and ethnic groups. NCHS data brief, no 89. Hyattsville, MD: National Center for Health Statistics. 2012.
- Hamilton BE, Hoyert DL, Martin JA, Strobino DM, Guyer B. Annual summary of vital statistics: 2010–2011. Pediatrics 131(3):548–58. 2013.
- National Campaign to Prevent Teen and Unplanned Pregnancy. National data.
- Kirby D. Emerging answers 2007: Research findings on programs to reduce teen pregnancy and sexually transmitted diseases. National Campaign to Prevent Teen and Unplanned Pregnancy.
- Oringanje C, Meremikwu MM, Eko H, Esu E, Meremikwu A, Ehiri JE. Interventions for preventing unintended pregnancies among adolescents. Cochrane Database Syst Rev 7(4): CD005215. 2009.
- Martinez G, Copen CE, Abma JC. Teenagers in the United States: Sexual activity, contraceptive use, and childbearing, 2006–2010 National Survey of Family Growth. National Center for Health Statistics. Vital Health Stat 23(31). 2011.
- Eaton DK, Kann L, Kinchen S, et al. Youth risk behavior surveillance—United States, 2011. MMWR Surveill Summ 61(4). 2012.
- United Nations Statistics Division. Demographic yearbook 2009–2010.
- Mathews TJ, Sutton PD, Hamilton BE, Ventura SJ. State disparities in teenage birth rates in the United States. NCHS data brief, no 46. Hyattsville, MD: National Center for Health Statistics. 2010.
- Ventura SJ, Hamilton BE. U.S. teenage birth rate resumes decline. NCHS data brief, no 58. Hyattsville, MD: National Center for Health Statistics. 2011.
- National Center for Health Statistics. U.S. census populations with bridged race categories. Postcensal estimates of the resident population of the United States for July 1, 2011 and national intercensal estimates of the resident population of the United States for July 1, 2000–July 1, 2009, by year, county, single year of age, bridged race, Hispanic origin, and sex. Prepared under a collaborative arrangement with the U.S. Census Bureau.
- Martin JA, Hamilton BE, Ventura SJ, et al. Births: Final data for 2011. [Forthcoming].
Suggested citation
Hamilton BE, Mathews TJ, Ventura SJ. Declines in state teen birth rates by race and Hispanic origin. NCHS data brief, no 123. Hyattsville, MD: National Center for Health Statistics. 2013.
Copyright information
All material appearing in this report is in the public domain and may be reproduced or copied without permission; citation as to source, however, is appreciated.
National Center for Health Statistics
Charles J. Rothwell, M.S., Acting Director
Jennifer H. Madans, Ph.D., Associate Director for Science
Division of Vital Statistics
Delton Atkinson, M.P.H., M.P.H., P.M.P., Acting Director