Strategies Used by Adults to Reduce Their Prescription Drug Costs
- Key findings
- Adults used several strategies to reduce prescription drug costs.
- Adults aged 18–64 were more than twice as likely as adults aged 65 and over to not have taken medication as prescribed to save money.
- Among adults aged 18–64, uninsured adults were more likely than those with Medicaid or private coverage to use strategies to save money on prescription drugs.
- Among adults aged 65 and over, asking a doctor for a lower-cost medication to save money varied more by insurance type compared with other strategies.
- To save money, adults who were poor or near poor were twice as likely as adults who were not poor to not take medication as prescribed.
- Summary
- Definitions
- Data source and methods
- About the authors
- References
- Suggested citation
NCHS Data Brief No. 119, April 2013
PDF Version (860 KB)
Robin A. Cohen, Ph.D.; Whitney K. Kirzinger, M.P.H.; and Renee M. Gindi, Ph.D.
Key findings
Data from the National Health Interview Survey, 2011
- Adults aged 18–64 and those aged 65 and over were equally likely to have asked their doctor for a lower-cost medication to save money on prescription drugs (19.8% and 20.3%, respectively).
- Adults aged 18–64 were twice as likely to not have taken medication as prescribed to save money (12.6%) compared with adults aged 65 and over (5.8%).
- Among adults aged 18–64, uninsured adults (23.1%) were more likely than those with Medicaid (13.6%) or those with private coverage (8.7%) to not have taken medication as prescribed to save money.
- Among adults aged 65 and over, those with only Medicare coverage were more likely to ask their doctor for a lower-cost medication to save money (24.9%) compared with those who had private coverage (20.1%) and those with Medicare and Medicaid (14.7%) coverage.
In 2011, Americans spent $45 billion out-of-pocket on retail prescription drugs (1). Some adults reduce prescription drug costs by skipping doses and delaying filling prescriptions (2). Some cost-reduction strategies used by adults have been associated with negative health outcomes. For example, adults who do not take prescription medication as prescribed have been shown to have poorer health status and increased emergency room use, hospitalizations, and cardiovascular events (3,4). This report analyzes different strategies used by U.S. adults to reduce their prescription drug costs, by age, health insurance status, and poverty status, using data from the 2011 National Health Interview Survey (NHIS).
Keywords: National Health Interview Survey, alternative therapies, medication
Adults used several strategies to reduce prescription drug costs.
Figure 1. Percentages of adults who used selected strategies to reduce prescription drug costs in the last 12 months, by age: United States, 2011
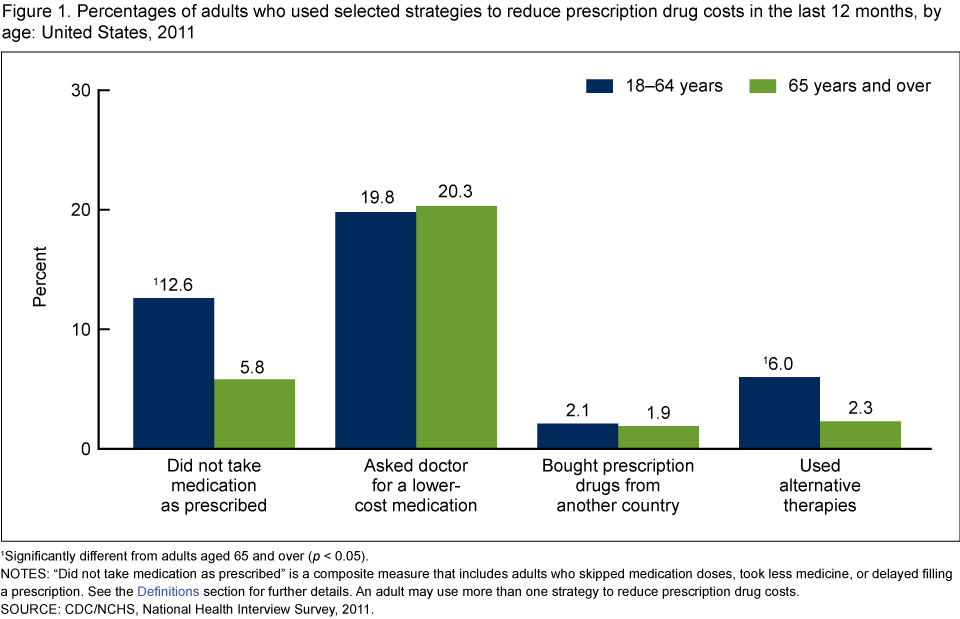
1Significantly different from adults aged 65 and over (p < 0.05).
NOTES: “Did not take medication as prescribed” is a composite measure that includes adults who skipped medication doses, took less medicine, or delayed filling a prescription. See the Definitions section for further details. An adult may use more than one strategy to reduce prescription drug costs.
SOURCE: CDC/NCHS, National Health Interview Survey, 2011.
- Adults aged 18–64 and those aged 65 and over were equally likely to ask their doctor for a lower-cost medication to save money (19.8% and 20.3%, respectively) (Figure 1).
- Adults aged 18–64 were twice as likely as adults aged 65 and over to not take medication as prescribed to save money (12.6% and 5.8%).
- Six percent of adults aged 18–64 used alternative therapies to save money on prescription drugs compared with 2.3% of adults aged 65 and over.
- About 2% of adults bought prescription drugs from another country to save money.
Adults aged 18–64 were more than twice as likely as adults aged 65 and over to not have taken medication as prescribed to save money.
Figure 2. Percentages of adults who did not take medicine as prescribed to reduce prescription drug costs in the past 12 months, by strategy and age: United States, 2011
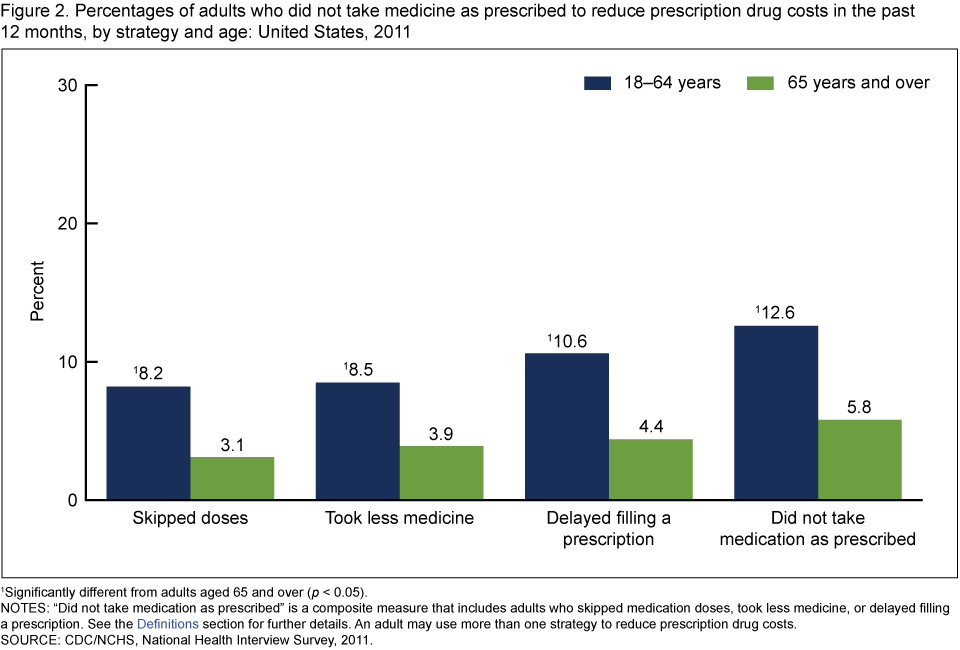
1Significantly different from adults aged 65 and over (p < 0.05).
NOTES: “Did not take medication as prescribed” is a composite measure that includes adults who skipped medication doses, took less medicine, or delayed filling a prescription. See the Definitions section for further details. An adult may use more than one strategy to reduce prescription drug costs.
SOURCE: CDC/NCHS, National Health Interview Survey, 2011.
- Among adults aged 18–64, 10.6% delayed filling a prescription to save money compared with 4.4% among adults aged 65 and over (Figure 2).
- Among adults aged 18–64, 8.2% skipped doses and 8.5% took less medication to save money compared with 3.1% and 3.9%, respectively, among adults aged 65 and over.
Among adults aged 18–64, uninsured adults were more likely than those with Medicaid or private coverage to use strategies to save money on prescription drugs.
Figure 3. Percentages of adults aged 18–64 who used selected strategies to reduce prescription drug costs in the past 12 months, by health insurance coverage status: United States, 2011
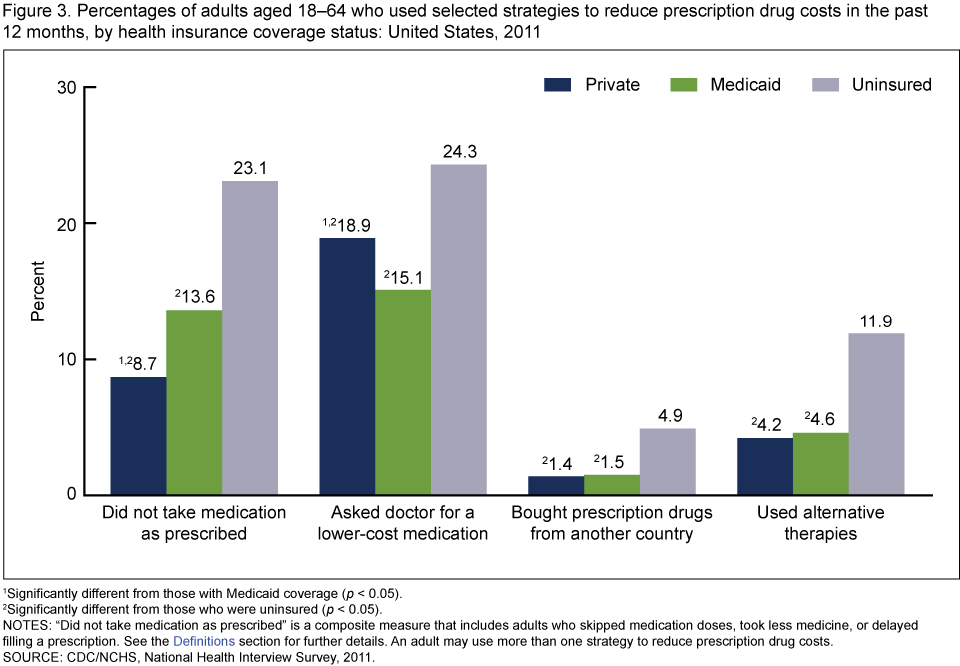
1Significantly different from those with Medicaid coverage (p < 0.05).
2Significantly different from those who were uninsured (p < 0.05).
NOTES: “Did not take medication as prescribed” is a composite measure that includes adults who skipped medication doses, took less medicine, or delayed filling a prescription. See the Definitions section for further details. An adult may use more than one strategy to reduce prescription drug costs.
SOURCE: CDC/NCHS, National Health Interview Survey, 2011.
- Those who were uninsured (23.1%) were more likely than those with private coverage (8.7%) and those with Medicaid (13.6%) to not take medication as prescribed (Figure 3).
- Those who were uninsured were more likely to ask their doctor for a lower-cost medication to save money (24.3%) compared with those who had private coverage (18.9%) and those who had Medicaid (15.1%). Those who were uninsured were more likely to use alternative therapies to save money (11.9%) compared with those who had private coverage (4.2%) and those who had Medicaid (4.6%).
Among adults aged 65 and over, asking a doctor for a lower-cost medication to save money varied more by insurance type compared with other strategies.
Figure 4. Percentages of adults aged 65 and over who used selected strategies to reduce prescription drug costs in the past 12 months, by health insurance coverage status: United States, 2011
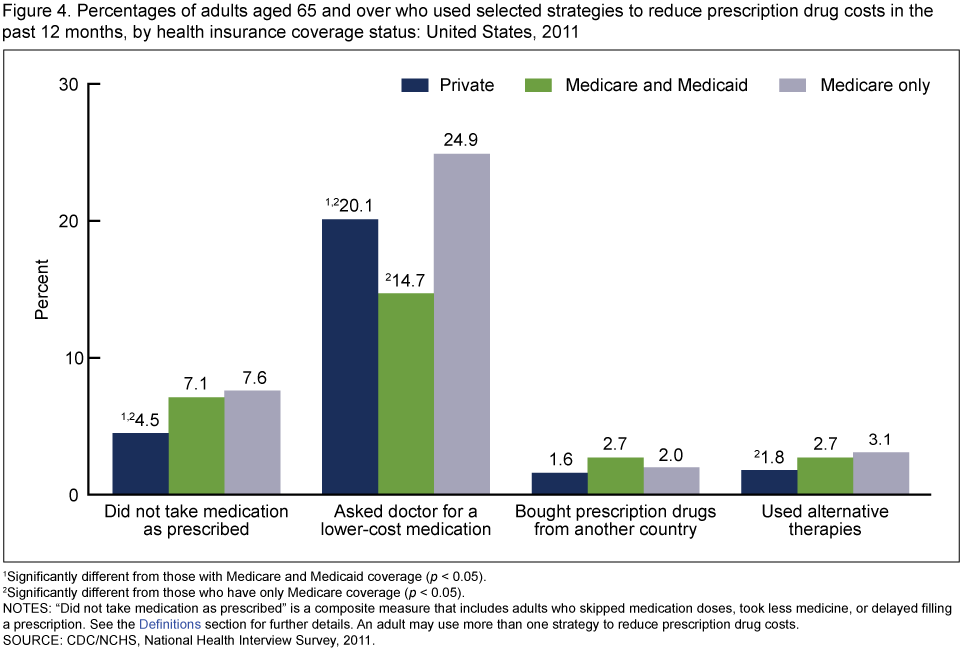
1Significantly different from those with Medicare and Medicaid coverage (p < 0.05).
2Significantly different from those who have only Medicare coverage (p < 0.05).
NOTES: “Did not take medication as prescribed” is a composite measure that includes adults who skipped medication doses, took less medicine, or delayed filling a prescription. See the Definitions section for further details. An adult may use more than one strategy to reduce prescription drug costs.
SOURCE: CDC/NCHS, National Health Interview Survey, 2011.
- Among adults aged 65 and over, those with only Medicare coverage were more likely to ask their doctor for a lower-cost medication to save money (24.9%) compared with those who had private coverage (20.1%) and those with Medicare and Medicaid coverage (14.7%) (Figure 4).
- Those with private coverage were less likely to have not taken medication as prescribed to save money (4.5%) compared with those with Medicare and Medicaid coverage (7.1%) and those with only Medicare coverage (7.6%).
- Those with private coverage were less likely to have used alternative therapies to save money (1.8%) than those with only Medicare coverage (3.1%).
- There were no differences by health insurance coverage in the percentages of those who bought prescription drugs from another country to save money.
To save money, adults who were poor or near poor were twice as likely as adults who were not poor to not take medication as prescribed.
Figure 5. Percentages of adults who did not take medication as prescribed and asked a doctor for a lower-cost medication in the past 12 months, by age and poverty status: United States, 2011
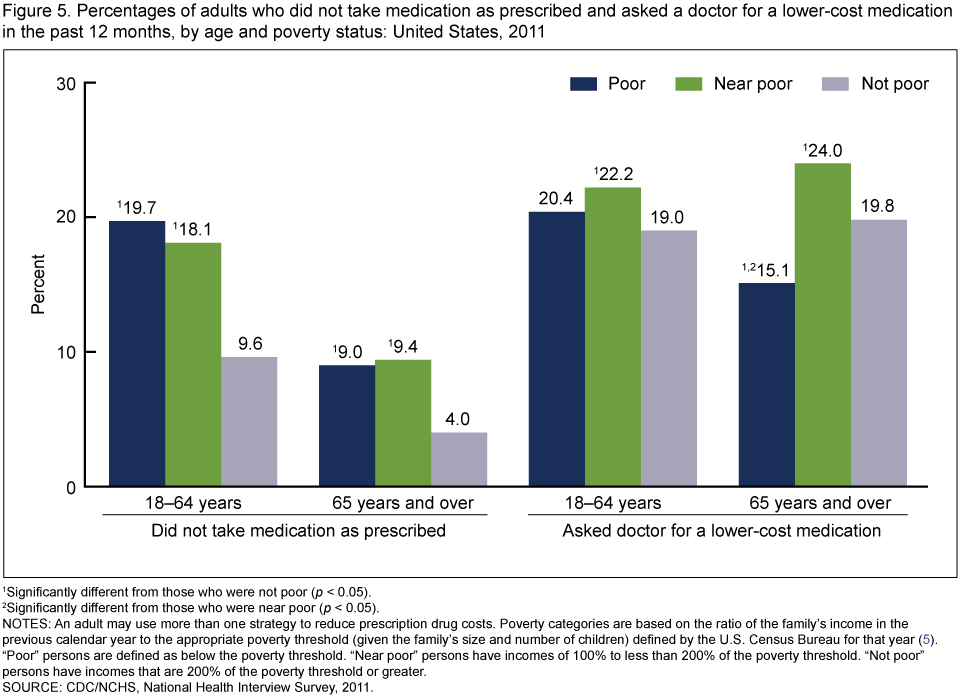
1Significantly different from those who were not poor (p < 0.05).
2Significantly different from those who were near poor (p < 0.05).
NOTES: An adult may use more than one strategy to reduce prescription drug costs. Poverty categories are based on the ratio of the family’s income in the previous calendar year to the appropriate poverty threshold (given the family’s size and number of children) defined by the U.S. Census Bureau for that year (5). “Poor” persons are defined as below the poverty threshold. “Near poor” persons have incomes of 100% to less than 200% of the poverty threshold. “Not poor” persons have incomes that are 200% of the poverty threshold or greater.
SOURCE: CDC/NCHS, National Health Interview Survey, 2011.
- Among adults aged 65 and over, those who were near poor (24.0%) were more likely than those who were poor (15.1%) and those who were not poor (19.8%) to ask their doctor for a lower-cost medication to save money (Figure 5).
- Among adults aged 18–64, those who were near poor (22.2%) were more likely than those who were not poor (19.0%) to ask their doctor for a lower-cost medication to save money.
Summary
Previous studies have found that more than 48% of Americans took at least one prescription drug in the past month (6). However, some people do not take medication as prescribed. Adults who do not take prescription medication as prescribed have been shown to have poorer health status and increased emergency room use, hospitalizations, and cardiovascular events (3,4). This study provides a baseline to track strategies used by adults to reduce their prescription drug costs on a national level for all adults and for subgroups defined by insurance status and poverty level. This report also contributes to the body of literature on the potential burden of prescription drug costs among vulnerable populations including the uninsured and those who are poor (7,8). Adults who were poor, near poor, or uninsured were more likely to not take medication as prescribed to reduce their prescription drug costs. Adults aged 65 and over generally were less likely than adults aged 18–64 to use strategies to reduce their prescription drug costs. Health insurance may, in some cases, result in access to drugs but this might not always be the case, even for those over age 65 who may have multiple forms of coverage (such as Medicare and private insurance, or who may be “dual eligible” for Medicare and Medicaid). Adults aged 65 and over with Medicare-only coverage were more likely than those with private or those with Medicare and Medicaid coverage to ask their doctor for a lower-cost medication to save money. Differences in use of cost-saving strategies were found by insurance status for those aged 18–64. Privately insured adults aged 18–64 were more likely than those with Medicaid coverage to ask their doctors for a lower-cost medication, however they were less likely than those with Medicaid coverage to not take medication as prescribed. This report focused only on cost-related strategies used by adults to reduce their prescription medication costs. There are other barriers to medication adherence including those not related to cost (9) that are not measured in NHIS.
Definitions
Strategies for reducing prescription drug costs: Based on the following questions asked of all adults in the NHIS Sample Adult component: “The following questions concern the use of prescription medication DURING THE PAST 12 MONTHS, are any of the following true for you? …You skipped medication doses to save money …You took less medicine to save money …You delayed filling a prescription to save money …You asked your doctor for a lower cost medication to save money …You bought prescription drugs from another country to save money …You used alternative therapies to save money.” All sample adults were asked these questions including those who may not be taking prescription medication.
Did not take medication as prescribed: Based on a positive response to any of three questions asked of all adults in the Sample Adult component: “The following questions concern the use of prescription medication DURING THE PAST 12 MONTHS, are any of the following true for you? …You skipped medication doses to save money …You took less medicine to save money … You delayed filling a prescription to save money.”
Health insurance coverage: NHIS respondents were asked about their health insurance coverage at the time of interview. Respondents reported whether they were covered by private insurance (obtained through the employer or workplace, purchased directly, or purchased through a local or community program), Medicare, Medigap (supplemental Medicare coverage), Medicaid, Children’s Health Insurance Program (CHIP), Indian Health Service (IHS), military coverage (including VA, TRICARE, or CHAMP–VA), a state-sponsored health plan, another government program, or any single-service plan. This information was used to form two health insurance hierarchies: one for those under age 65 and another for those aged 65 and over (10).
Poverty status and percentage of poverty level: Based on reported and imputed family income, family size, and the number of children in the family, and, for families with two or fewer adults, on the age of the adults in the family. Family income was imputed for 22.4% of persons in 2011 using NHIS imputed income files (11). Poverty levels are updated annually by the U.S. Census Bureau to reflect changes in the Consumer Price Index. For further information, visit the U.S. Census Bureau website. Note that NHIS asks respondents about their personal earnings and family income for the previous calendar year (2010). The poverty ratios in the 2011 NHIS data files were calculated using the U.S. Census Bureau’s 2010 poverty thresholds based on their 2010 income (5).
Data source and methods
Data from the 2011 NHIS were used for this analysis. NHIS data are collected continuously throughout the year for the Centers for Disease Control and Prevention’s National Center for Health Statistics (NCHS), by interviewers from the U.S. Census Bureau. NHIS collects information about the health and health care of the civilian noninstitutionalized U.S. population. Interviews are conducted in respondents’ homes, but follow-ups to complete interviews may be conducted over the telephone. The Family component collects information on all family members and the Sample Adult component collects additional data from one randomly selected adult (the “sample adult”). Questions about strategies to reduce prescription drug cost are from the Sample Adult component. In 2011, information was collected on a total of 33,014 persons aged 18 and over from the Sample Adult component of the survey. For further information about NHIS, including the questionnaire, see the NHIS website.
NHIS is designed to yield a sample representative of the civilian noninstitutionalized population of the United States, and this analysis used weights to produce national estimates. Data weighting procedures are described in more detail elsewhere (12). Point estimates and estimates of corresponding variances for this analysis were calculated using SUDAAN software (13) to account for the complex sample design of NHIS. The Taylor series linearization method was chosen for variance estimation. All estimates shown in this report meet the NCHS standard of reliability (relative standard error less than or equal to 30%). Differences between percentages were evaluated using two-sided significance tests at the 0.05 level. Terms such as “higher than” and “less than” indicate statistically significant differences. Terms such as “similar” and “no difference” indicate that the statistics being compared were not significantly different. Lack of comment regarding the difference between any two statistics does not necessarily suggest that the difference was tested and found to be not significant.
About the authors
Robin A. Cohen, Whitney K. Kirzinger, and Renee M. Gindi are with the Centers for Disease Control and Prevention’s National Center for Health Statistics, Division of Health Interview Statistics.
References
- Centers for Medicaid & Medicare Services. National health expenditure data [PDF – 816 KB]. [Accessed October 2012].
- Briesacher BA, Gurwitz JH, Soumerai SB. Patients at-risk for cost-related medication nonadherence: A review of the literature. J Gen Intern Med 22(6):864–71. 2007.
- Heisler M, Langa KM, Eby EL, Fendrick AM, Kabeto MU, Piette JD. The health effects of restricting prescription medication use because of cost. Med Care 42(7): 626–34. 2004.
- Piette JD, Rosland AM, Silveira MJ, Hayward R, McHorney CA. Medication cost problems among chronically ill adults in the US: Did the financial crisis make a bad situation worse? Patient Prefer Adherence 5:187–94. 2011.
- DeNavas-Walt C, Proctor BD, Smith JC. Income, poverty, and health insurance coverage in the United States: 2010. Current population reports P60–239. Washington, DC: U.S. Government Printing Office. 2011.
- Gu Q, Dillon CF, Burt VL. Prescription drug use continues to increase: U.S. prescription drug data for 2007–2008. NCHS data brief, no 42. Hyattsville, MD: National Center for Health Statistics. 2010.
- Cunningham PJ. Despite the recession’s effects on incomes and jobs, the share of people with high medical costs was mostly unchanged. Health Aff 31(11):2563–70. 2012. [Accessed November 5, 2012].
- Gellad WF, Donohue JM, Zhao X, Zhang Y, Banthin JS. The financial burden from prescription drugs has declined recently for the nonelderly, although it is still high for many. Health Aff 31(2):408–16. 2012.
- Osterberg L. Blaschke T. Adherence to medication. N Engl J Med 353(5):487–97. 2005.
- Adams PF, Kirzinger WK, Martinez ME. Summary health statistics for the U.S. population: National Health Interview Survey, 2011. National Center for Health Statistics. Vital Health Stat 10(255). 2012.
- Schenker N, Raghunathan TE, Chiu P, et al. Multiple imputation of family income and personal earnings in the National Health Interview Survey: Methods and examples [PDF – 814 KB]. 2008.
- Botman SL, Moore TF, Moriarity CL, Parsons VL. Design and estimation for the National Health Interview Survey, 1995–2004. National Center for Health Statistics. Vital Health Stat 2(130). 2000.
- SUDAAN (Release 10.0) [computer software]. Research Triangle Park, NC: RTI International. 2008.
Suggested citation
Cohen RA, Kirzinger WK, Gindi RM. Strategies used by adults to reduce their prescription drug costs. NCHS data brief, no 119. Hyattsville, MD: National Center for Health Statistics. 2013.
Copyright information
All material appearing in this report is in the public domain and may be reproduced or copied without permission; citation as to source, however, is appreciated.
National Center for Health Statistics
Charles J. Rothwell, M.S., Acting Director
Jennifer H. Madans, Ph.D., Associate Director for Science
Division of Health Interview Statistics
Jane F. Gentlemen, Ph. D., Director