Healthy People 2010
Progress Review Focus Area 19 – Nutrition and Overweight Presentation
PowerPoint Presentation [PPT – 1 MB]
Slide 1
Focus Area 19: Nutrition and Overweight Progress Review.
Edward J. Sondik
National Center for Health Statistics.
April 3, 2008
Slide 2
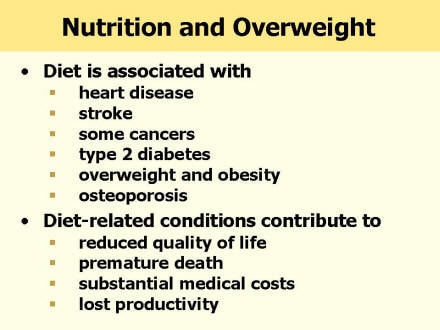
Nutrition and Overweight
Diet is associated with:
-
heart disease
-
stroke
-
some cancers
-
type 2 diabetes
-
overweight and obesity
-
osteoporosis
Diet-related conditions contribute to:
-
reduced quality of life
-
premature death
-
substantial medical costs
-
lost productivity
Slide 3
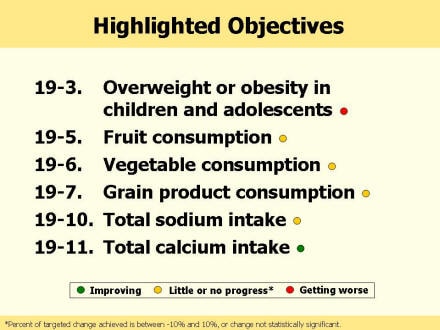
The interagency work group for this focus area selected 6 objectives to highlight:
-
19-3 which aims to reduce the proportion of children and adolescents who are overweight or obese
-
19-5, 6, & 7 which aim to increase the proportion of people 2+ y who meet objectives for fruit, vegetable and grain consumption
-
19-10 which aims to increase the proportion of people 2+ y who consume 2400 mg or less of sodium daily
-
19-11 which aims to increase the proportion of people 2+ y who meet dietary recommendations for calcium
Overall progress:
-
19-3 Overweight or obesity in children and adolescents, getting worse
-
19-5 Fruit consumption, little or no progress
-
19-6 Vegetable consumption, little or no progress
-
19-7 Grain product consumption, little or no progress
-
19-10 Total sodium intake, little or no progress
-
19-11 Total calcium intake, improving
Slide 4
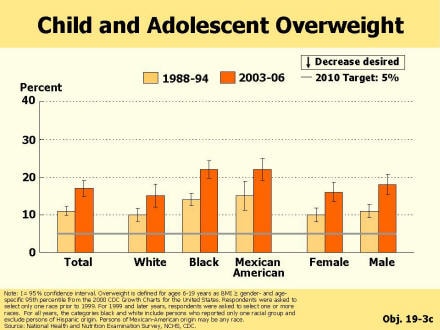
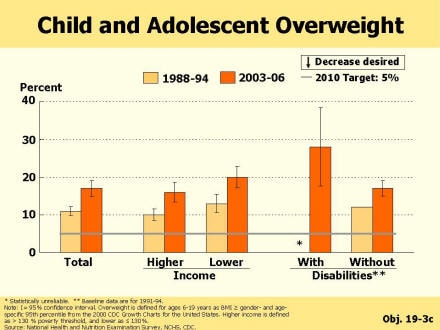
Child and Adolescent Overweight
Substantial increase from 11% in 1988-94 to 17% in 2003-06, moving away from 2010 target of 5%
Increase in overweight for all 3 race/ethnic groups which can be assessed by NHANES. In 2003-06, 22% of black and Mexican American children and adolescents were overweight compared to 15% of non-Hispanic white.
Increase occurred for both males and females
Slide 5
Child and Adolescent Overweight
Increase in overweight occurred with both higher and lower income levels.
In 2003-04, more lower income youth were overweight (20%) compared to higher-income (16%).
In 2003-04 more youth with disabilities were overweight (28%) compared with those without disabilities (17%).
Slide 6
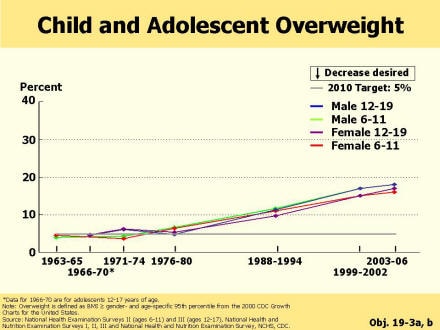
Child and Adolescent Overweight
Prevalence of overweight among children and adolescents remained at or below the 2010 target of 5% until 1976-80, when it began a sharp increase.
Slide 7
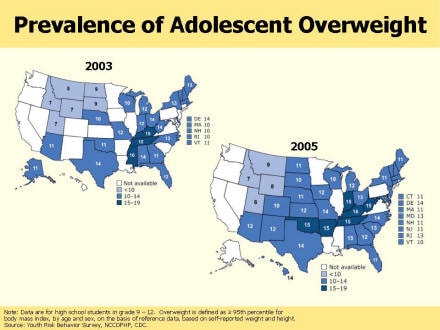
Prevalence of Adolescent Overweight
Maps indicate increase in overweight among adolescents, grade 9-12, from 2003 to 2005
For most states, adolescent overweight appears a significant concern. In 2005, only 4 of the 39 states with data reported that less than 10 percent of high school students were overweight.
Slide 8
Adult Obesity
Prevalence of adult obesity increased for all 3 race/ethnic groups which can be assessed by NHANES.
Among females, black non-Hispanic females had the highest prevalence of 53% in 2003-06, compared to 32% of white non-Hispanic females.
Among males, prevalence of obesity in 2003-06 ranged from 29% in Mexican American to 35% in non-Hispanic black.

Slide 9
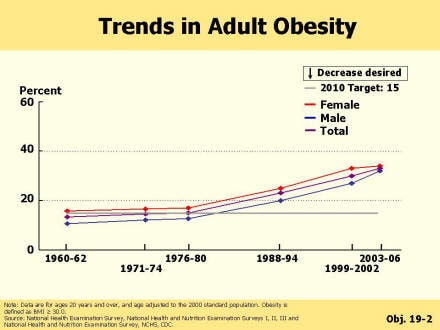
Trends in Adult Obesity
Similar to a trend observed among children and adolescents, prevalence of obesity among adults showed a sharp increase beginning 1976-80. Prior to 1976-80, prevalence of obesity among adults remained at or below the 2010 target of 15%.
Slide 10
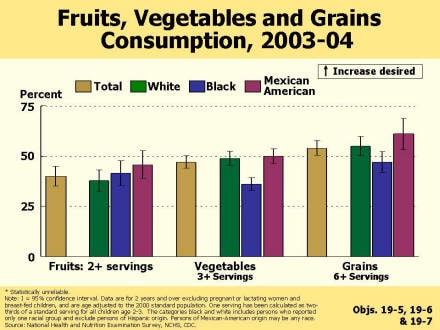
Fruits, Vegetables, and Grains Consumption, 2003-04
In 2003-04, there was little or no progress in meeting the objectives for fruit, vegetable, and grain consumption compared to the 1988-1994 baseline. 40% consumed 2 servings of fruit, falling short of the 2010 target of 75%.
Slide 11
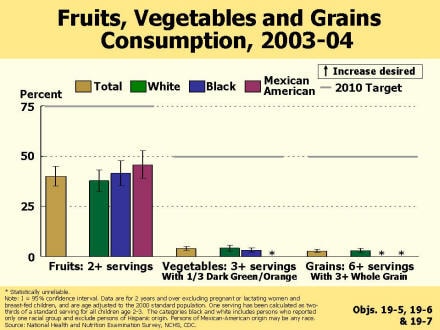
Fruits, Vegetables, and Grains Consumption, 2003-04
Americans had greater difficulty meeting the recommendation of 1/3 servings from dark green/orange vegetables (9%) than 3+ servings of total vegetables (47%)
Americans had greater difficulty meeting the recommendation of 3+ servings from whole grains (3%) than 6+ servings of total grains (54%)
Slide 12
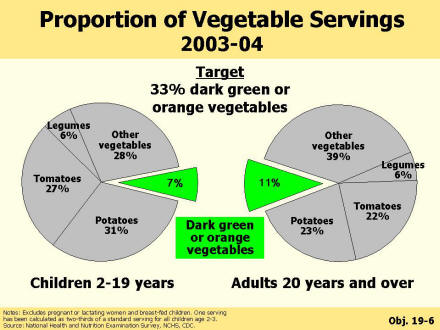
Proportion of Vegetable Servings 2003-04
Current dietary guidance recommends that Americans consume at least 1/3 of their vegetables from dark green or orange vegetable.
Proportion of vegetable servings that are dark green or orange is 7% for children aged 12-19, and 11% for Adults aged 20 years and over.
Slide 13
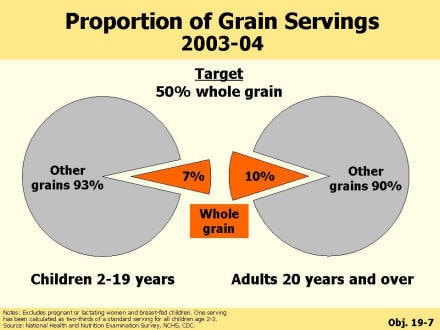
Proportion of Grain Servings 2003-04
Current dietary guidance recommends that Americans consume at least half their grains from whole grains.
This slide shows that intake of whole grains is very low relative to total grain product consumption for both youth and adults (7% for children aged 12-19, 10% for Adults aged 20 years and over).
Slide 14
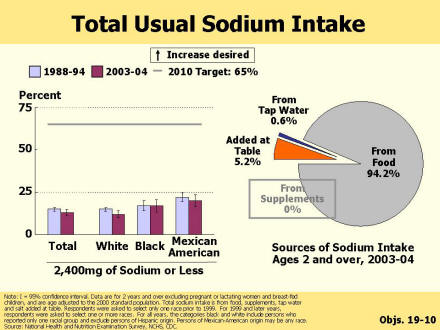
Total Usual Sodium Intake
Decreasing sodium intake may reduce the risk of elevated blood pressure.
In 2003-04, there was little or no progress in reducing Americans’ daily consumption of sodium to 2400 mg or less; only 13% met this recommendation compared with 15% in 1988-94 baseline.
The estimates of total sodium intake include sodium from food, salt added at the table, tap water, and dietary supplements. As might be expected, food contributed the most sodium (94.2%) – with other reports noting that processed foods contribute most of that. Salt use at the table contributed a small but not inconsequential amount (5.2%), with very little sodium contributed by tap water (.6%) or dietary supplements (0%).
Slide 15
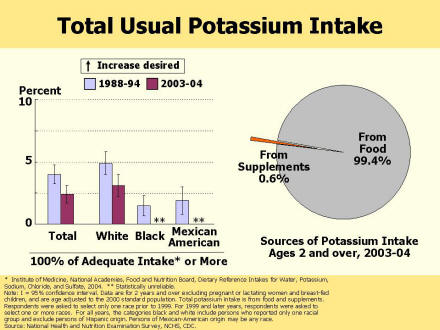
Total Usual Potassium Intake
Current dietary guidance states that another dietary measure to lower blood pressure is to consume a diet rich in potassium. Consequently, the work group decided to look at Americans’ intake of potassium in relation to recommendations.
This slide indicates that potassium intake decreased in the last two decades, and that in 2003-04—very few Americans had potassium intakes above the Adequate Intake values established by the Institute of Medicine.
It also shows that very little potassium was contributed by dietary supplements.
Current dietary guidance recommends that potassium come from food sources, and identify fruits and vegetables – including leafy green vegetables, fruit from vines, and root vegetables – as rich in potassium. It may be noted that the relatively low potassium intakes are consistent with majority of Americans not meeting recommendations for fruit and vegetable consumption.
Slide 16
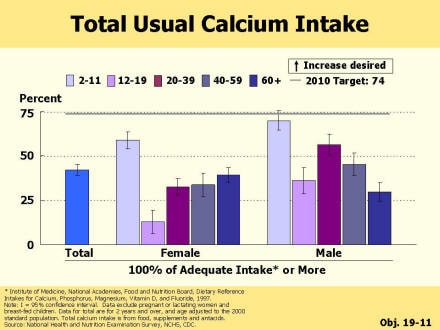
Total Usual Calcium Intake
Objective 19-11 is to increase the proportion of people 2+ y who meet dietary recommendations for calcium.
In preparing for this progress review, the work group changed the operational definition for “meet dietary recommendations for calcium” from > 77% AI to > 100% AI (Refer to Tracking HP updates for more information).
Calcium intake increased from 1988-94 to 2003-04, but still the majority of people did not have intakes above Adequate Intake values. Female adolescents have the lowest calcium intakes compared to recommendations.
Slide 17
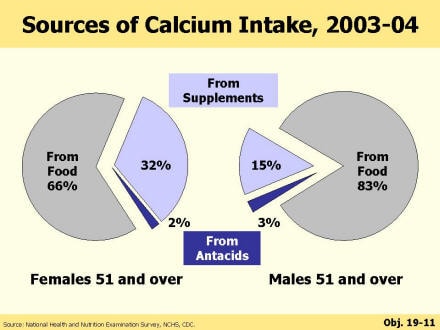
Sources of Calcium Intake, 2003-04
The contribution of dietary supplements to total calcium intake varied by age and gender, with the greatest contribution for women 51 and older.
The percent of calcium intake by females aged 51+ that is from food (66%), from supplements (32%) and from antacids (2%).
The percent of calcium intake by males aged 51+ that is from food (83%), from supplements (15%) and from antacids (3%).
The substantial contribution of dietary supplements to total calcium intake for older women illustrates the importance of collecting data on nutrient intake from all sources including dietary supplements.
For these older women and men, only a small amount of calcium came from antacids.
Slide 18
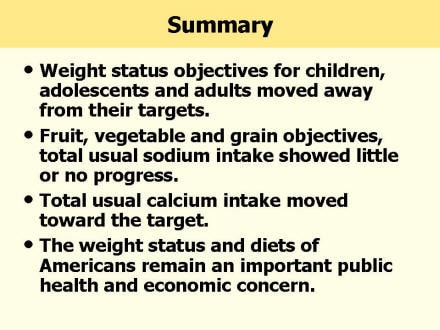
Summary
-
Weight status objectives for children, adolescents and adults moved away from their targets.
-
Fruit, vegetable and grain objectives, total usual sodium intake showed little or no progress.
-
Total usual calcium intake moved toward the target.
-
The weight status and diets of Americans remain an important public health and economic concern.
Slide 19
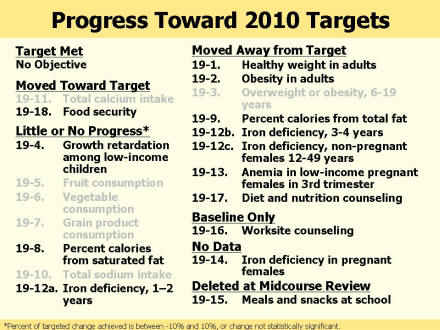
Progress Toward 2010 Targets
Target Met
-
No Objective
Moved Toward Target
-
19-11. Total calcium intake
-
19-18. Food security
Little or No Progress*
-
19-4. Growth retardation among low-income children
-
19-5. Fruit consumption
-
19-6. Vegetable consumption
-
19-7. Grain product consumption
-
19-8. Percent calories from saturated fat
-
19-10. Total sodium intake
-
19-12a. Iron deficiency, 1–2 years
Moved Away from Target
-
19-1. Healthy weight in adults
-
19-2. Obesity in adults
-
19-3. Overweight or obesity, 6-19 years
-
19-9. Percent calories from total fat
-
19-12b. Iron deficiency, 3-4 years
-
19-12c. Iron deficiency, non-pregnant females 12-49 years
-
19-13. Anemia in low-income pregnant females in 3rd trimester
-
19-17. Diet and nutrition counseling
Baseline Only
-
19-16. Worksite counseling
No Data
-
19-14. Iron deficiency in pregnant females
Deleted at Midcourse Review
-
19-15. Meals and snacks at school
*Percent of targeted change achieved is between -10% and 10%, or change not statistically significant.
Slide 20
Acknowledgements
Data Contributors and Federal Interagency Work Group
- Nancy Crane, FDA
- Sarah Cusick, NCCDPHP/CDC
- Kevin Dodd, NCI/NIH
- Joseph Goldman, ARS/USDA
- Van Hubbard, DNRC/NIH
- Clifford Johnson, NCHS/CDC
- Margaret McDowell, NCHS/CDC
- Kathryn McMurry, ODPHP
- Alanna Moshfegh, ARS/USDA
- Mark Nord, ERS/USDA
- Barbara Schneeman, FDA
- Bettylou Sherry, NCCDPHP/CDC
- Pamela Starke-Reed, DNRC/NIH
- Jean Williams, NCHS/CDC
Slide 21
Progress review data and slides can be found on the web at: the Health People homepage