TB Multimedia Resources

The high-resolution, public domain visuals below are available for use in your publication. This page will be updated as new media resources become available.

Commonly Requested Multimedia
Illustration of Mycobacterium tuberculosis[JPG - 774 KB]

Illustration of Mycobacterium tuberculosis
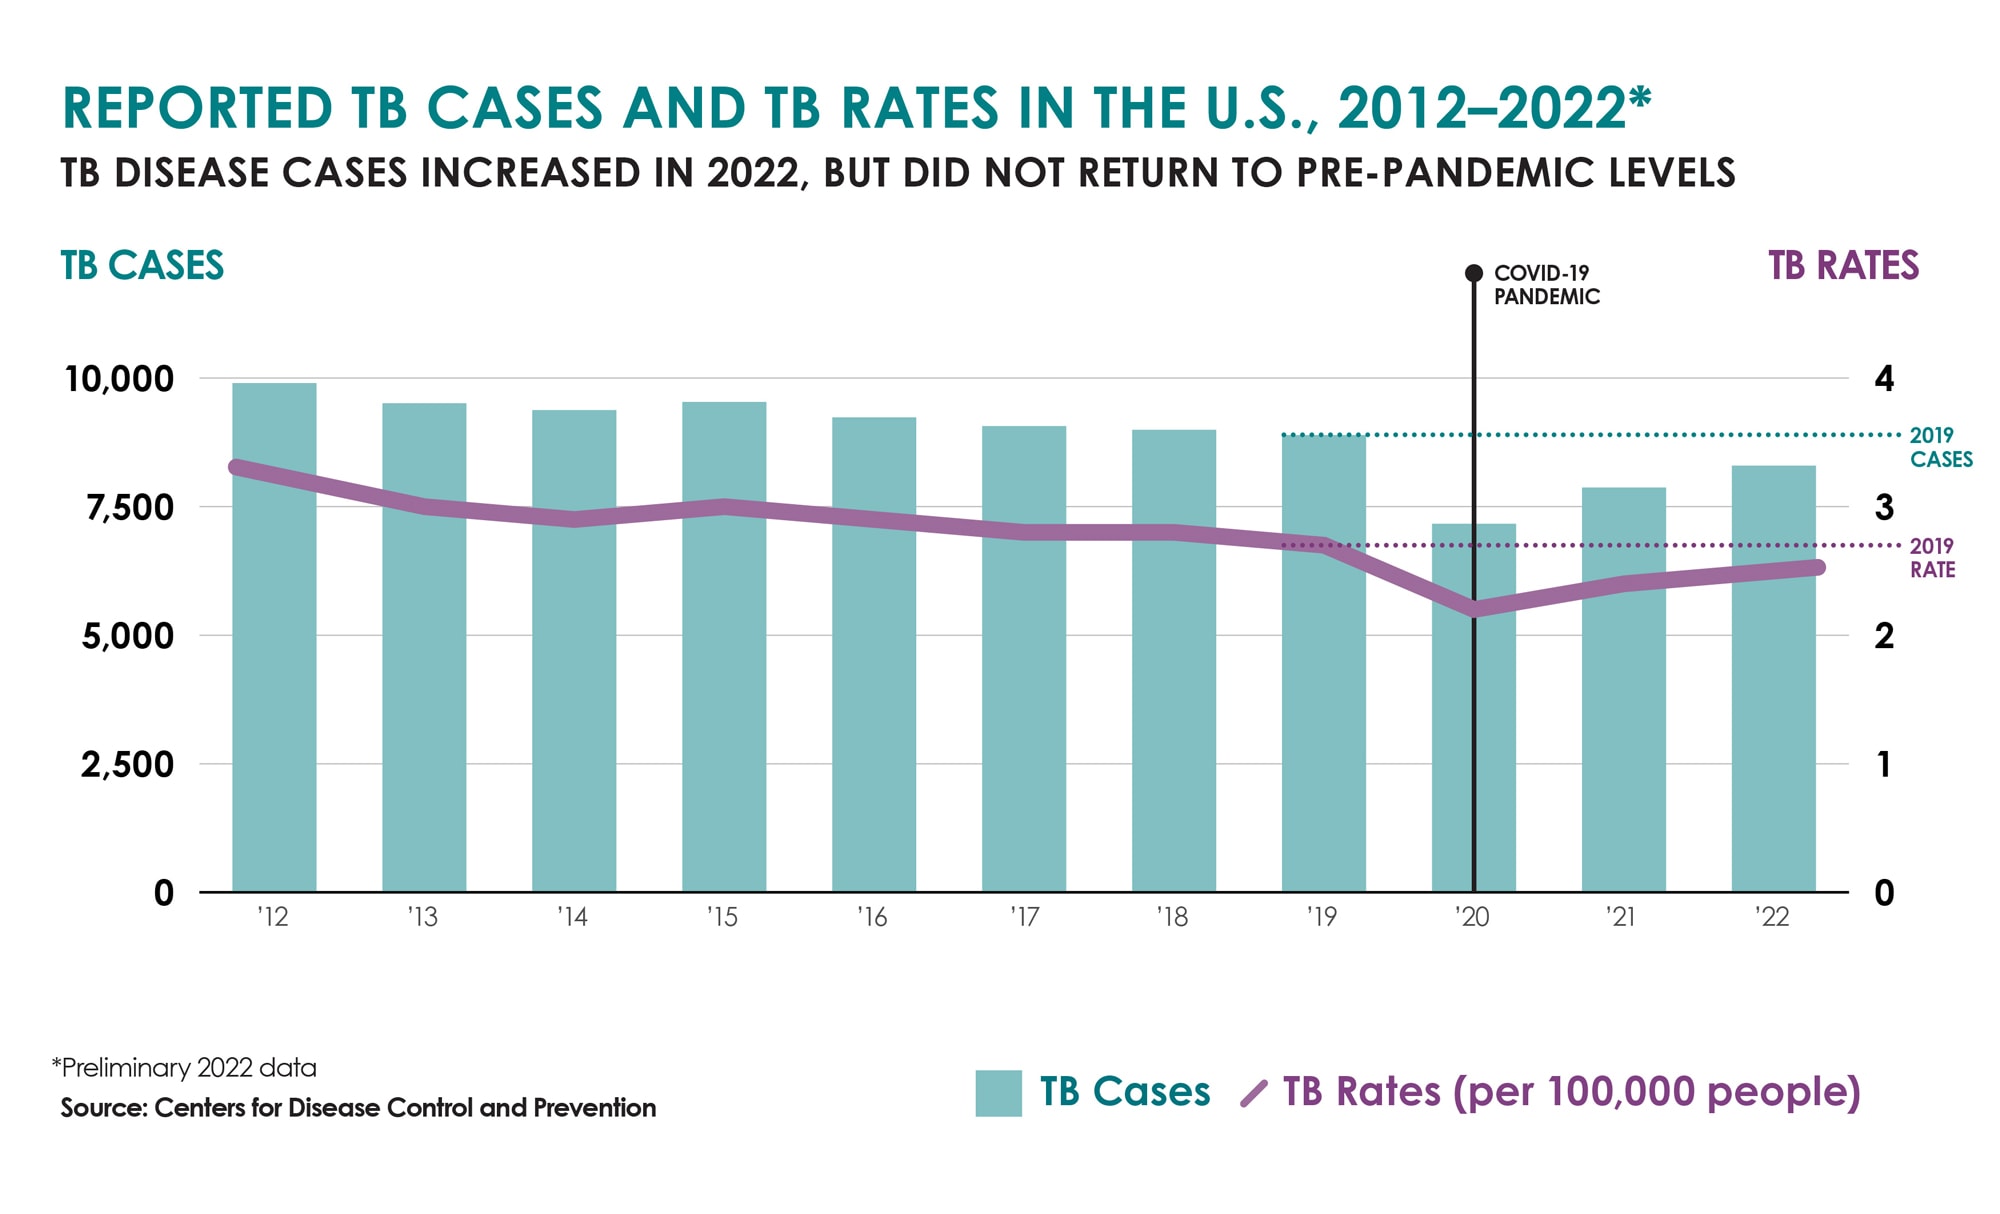
A combined bar and line chart showing TB cases and rates from 2012 to 2022, with both dropping in 2020 and rebounding to just below pre-pandemic (2019) levels in 2022.[JPG - 415 KB]

Reported TB Cases and TB Rates in the U.S., 2012-2022

If you need more information about the data connected to the release, please click the more information button to find accompanying press releases, articles, and reports.

TB is Still Here – CDC Data Show U.S. Cases Increased Again in 2022 – March 23, 2023

Preliminary TB data show that the number of U.S. TB disease cases increased by 5% in 2022, with considerable increases in some groups. CDC is calling on healthcare providers and communities disproportionately affected by TB to Think. Test. Treat TB.

A combined bar and line chart showing TB cases and rates from 2012 to 2022, with both dropping in 2020 and rebounding to just below pre-pandemic (2019) levels in 2022.[JPG - 415 KB]

Reported TB Cases and TB Rates in the U.S., 2012-2022
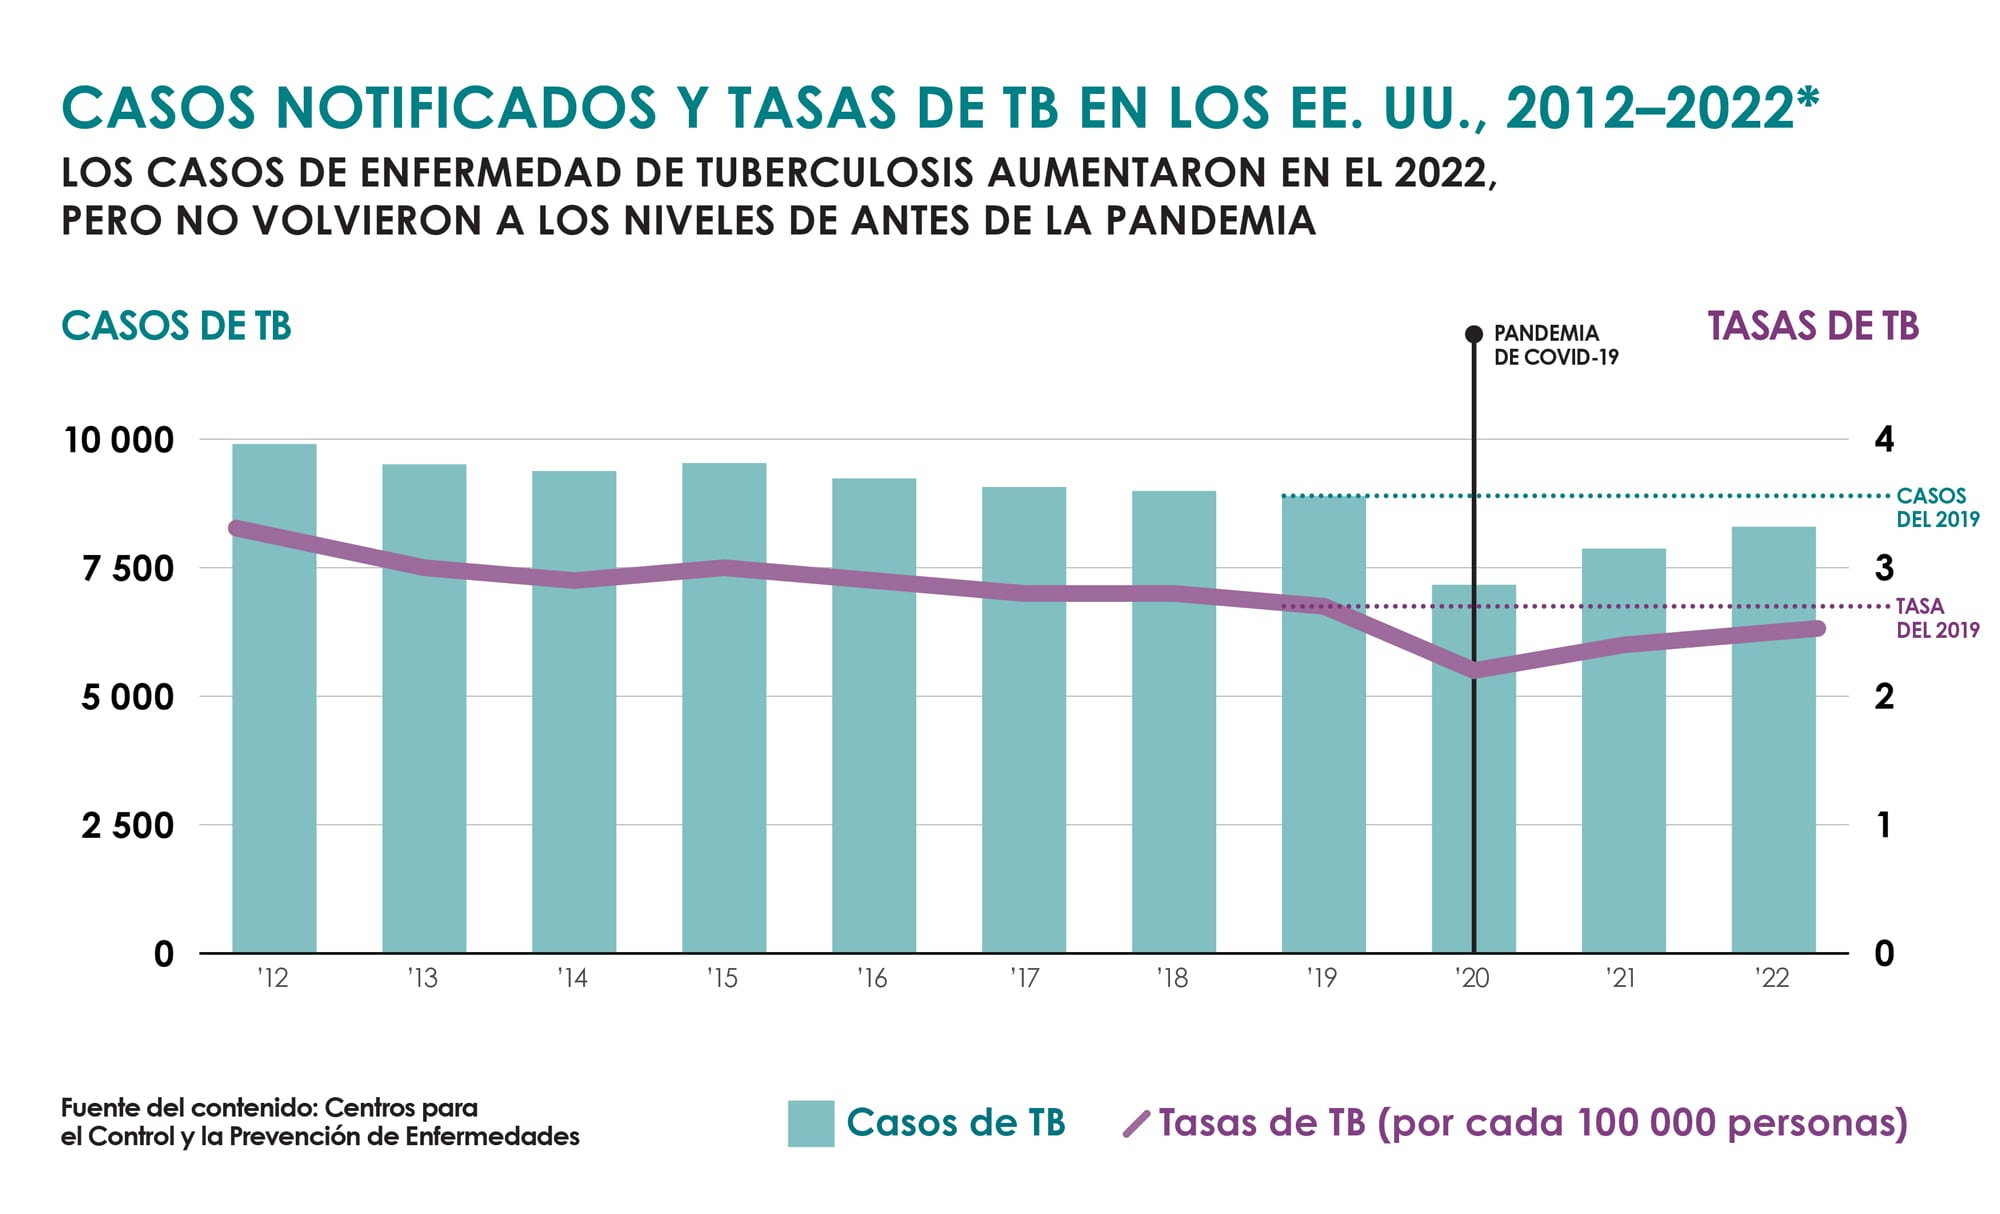
Un diagrama de barras muestra que los casos notificados y tasas de enfermedad de tuberculosis disminuyeron entre el 2012 y el 2020 (excepto en el 2015) y aumentaron entre el 2020 y el 2022, pero no volvieron a los niveles de antes de la pandemia.[JPG - 483 KB]

Casos Notificados Y Tasas De TB En Los EE. UU., 2012-2022

COVID-19 likely had a substantial effect on U.S. TB disease trends – March 24, 2022

Preliminary CDC data, released on World Tuberculosis (TB) Day, show that TB disease diagnoses fell 20% in 2020 and remained 13% lower in 2021 than pre-pandemic levels. These declines may be related to factors associated with the COVID-19 pandemic, including a true reduction in incidence as well as delayed or missed TB diagnoses.
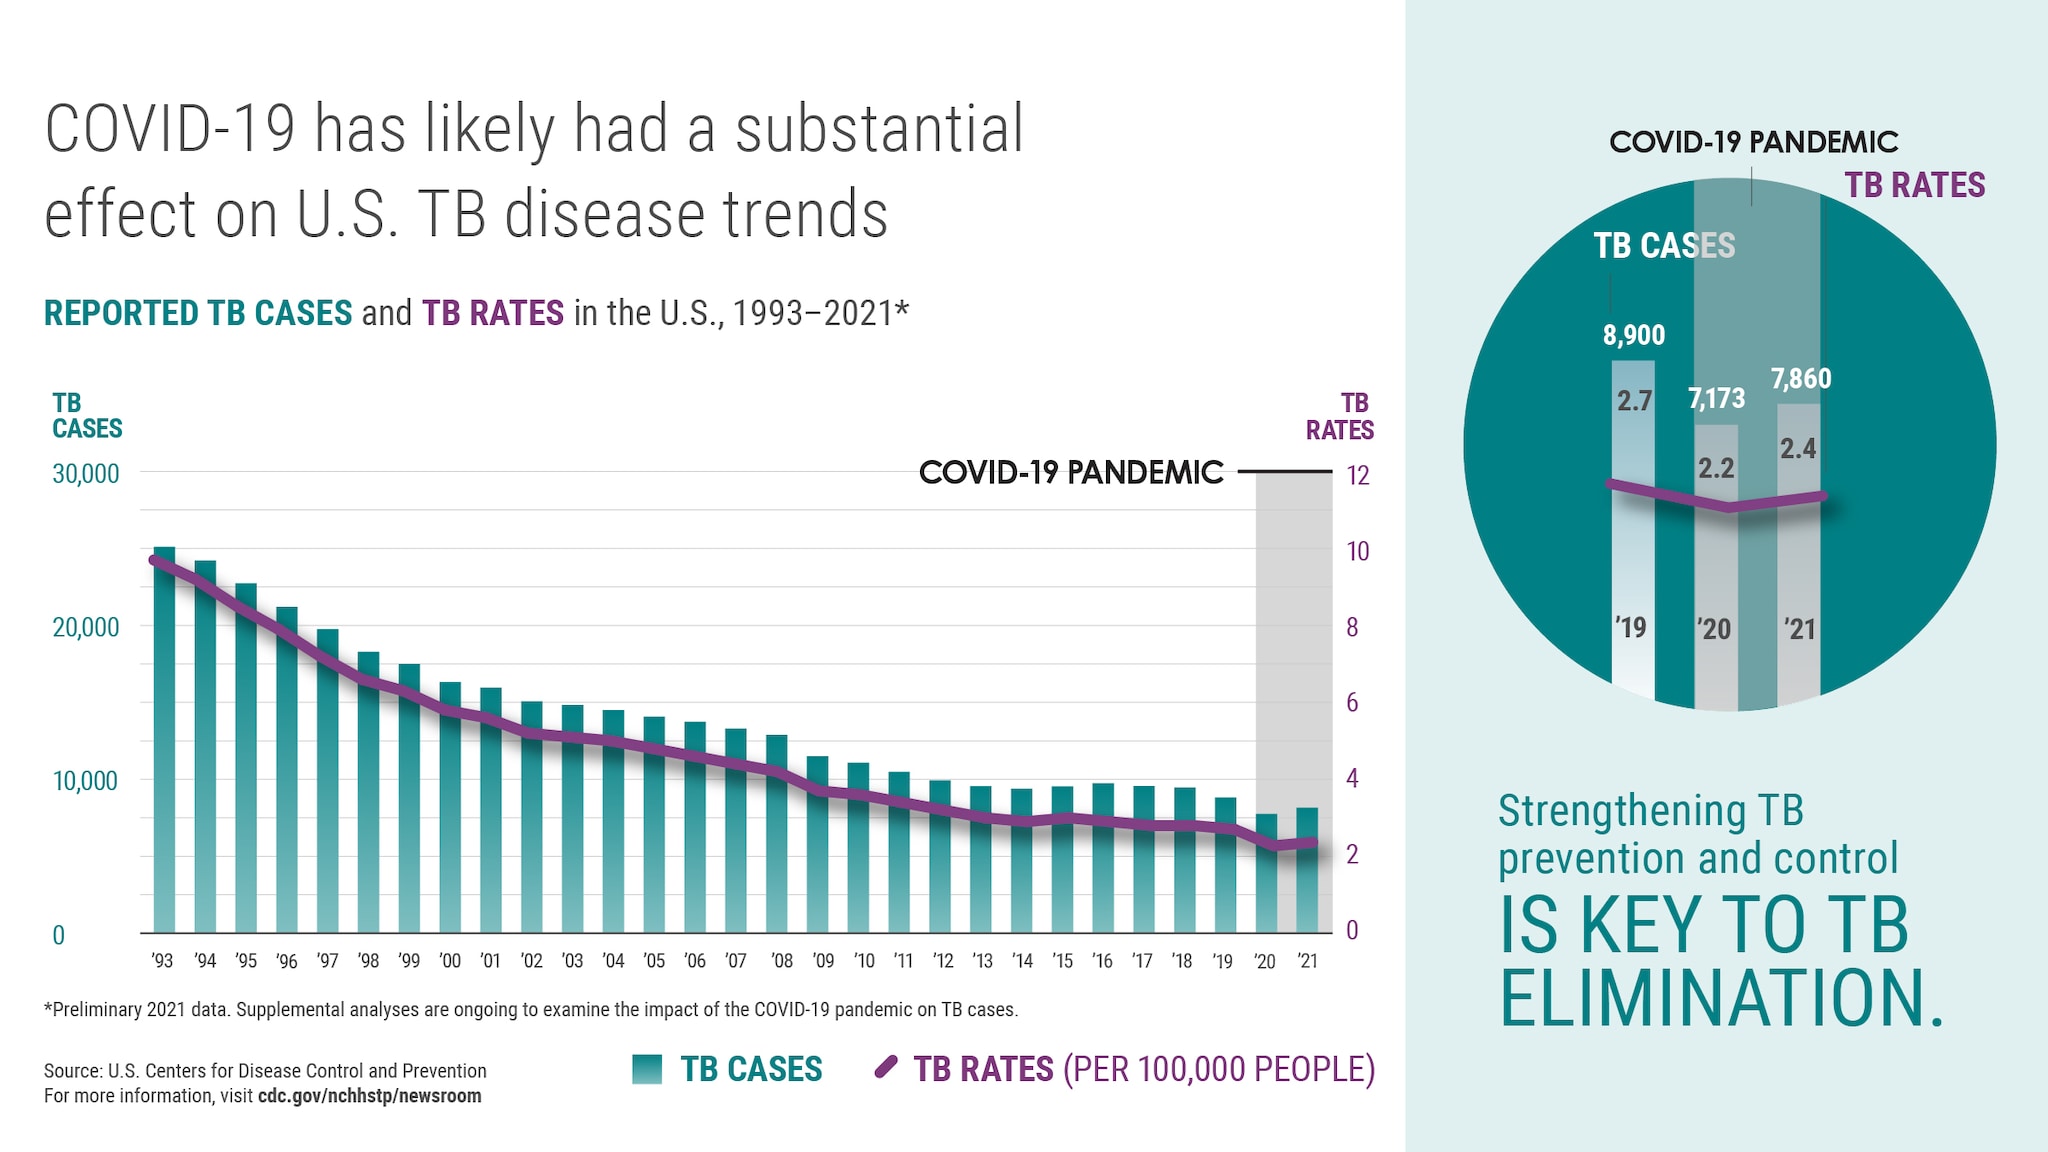
The graphic shows a bar graph of TB cases and a line graph of TB rates in the U.S. from 1993 to 2020. TB cases ranged from 25,104 in 1993 to 7,860 in 2021. TB rates ranged from 9.7 in 1993 to 2.4 in 2021[JPG - 686 KB]

TB Cases and Rates in the U.S., 1993-2021

Progress Toward Tuberculosis Elimination Has Slowed in Recent Years – March 25, 2021

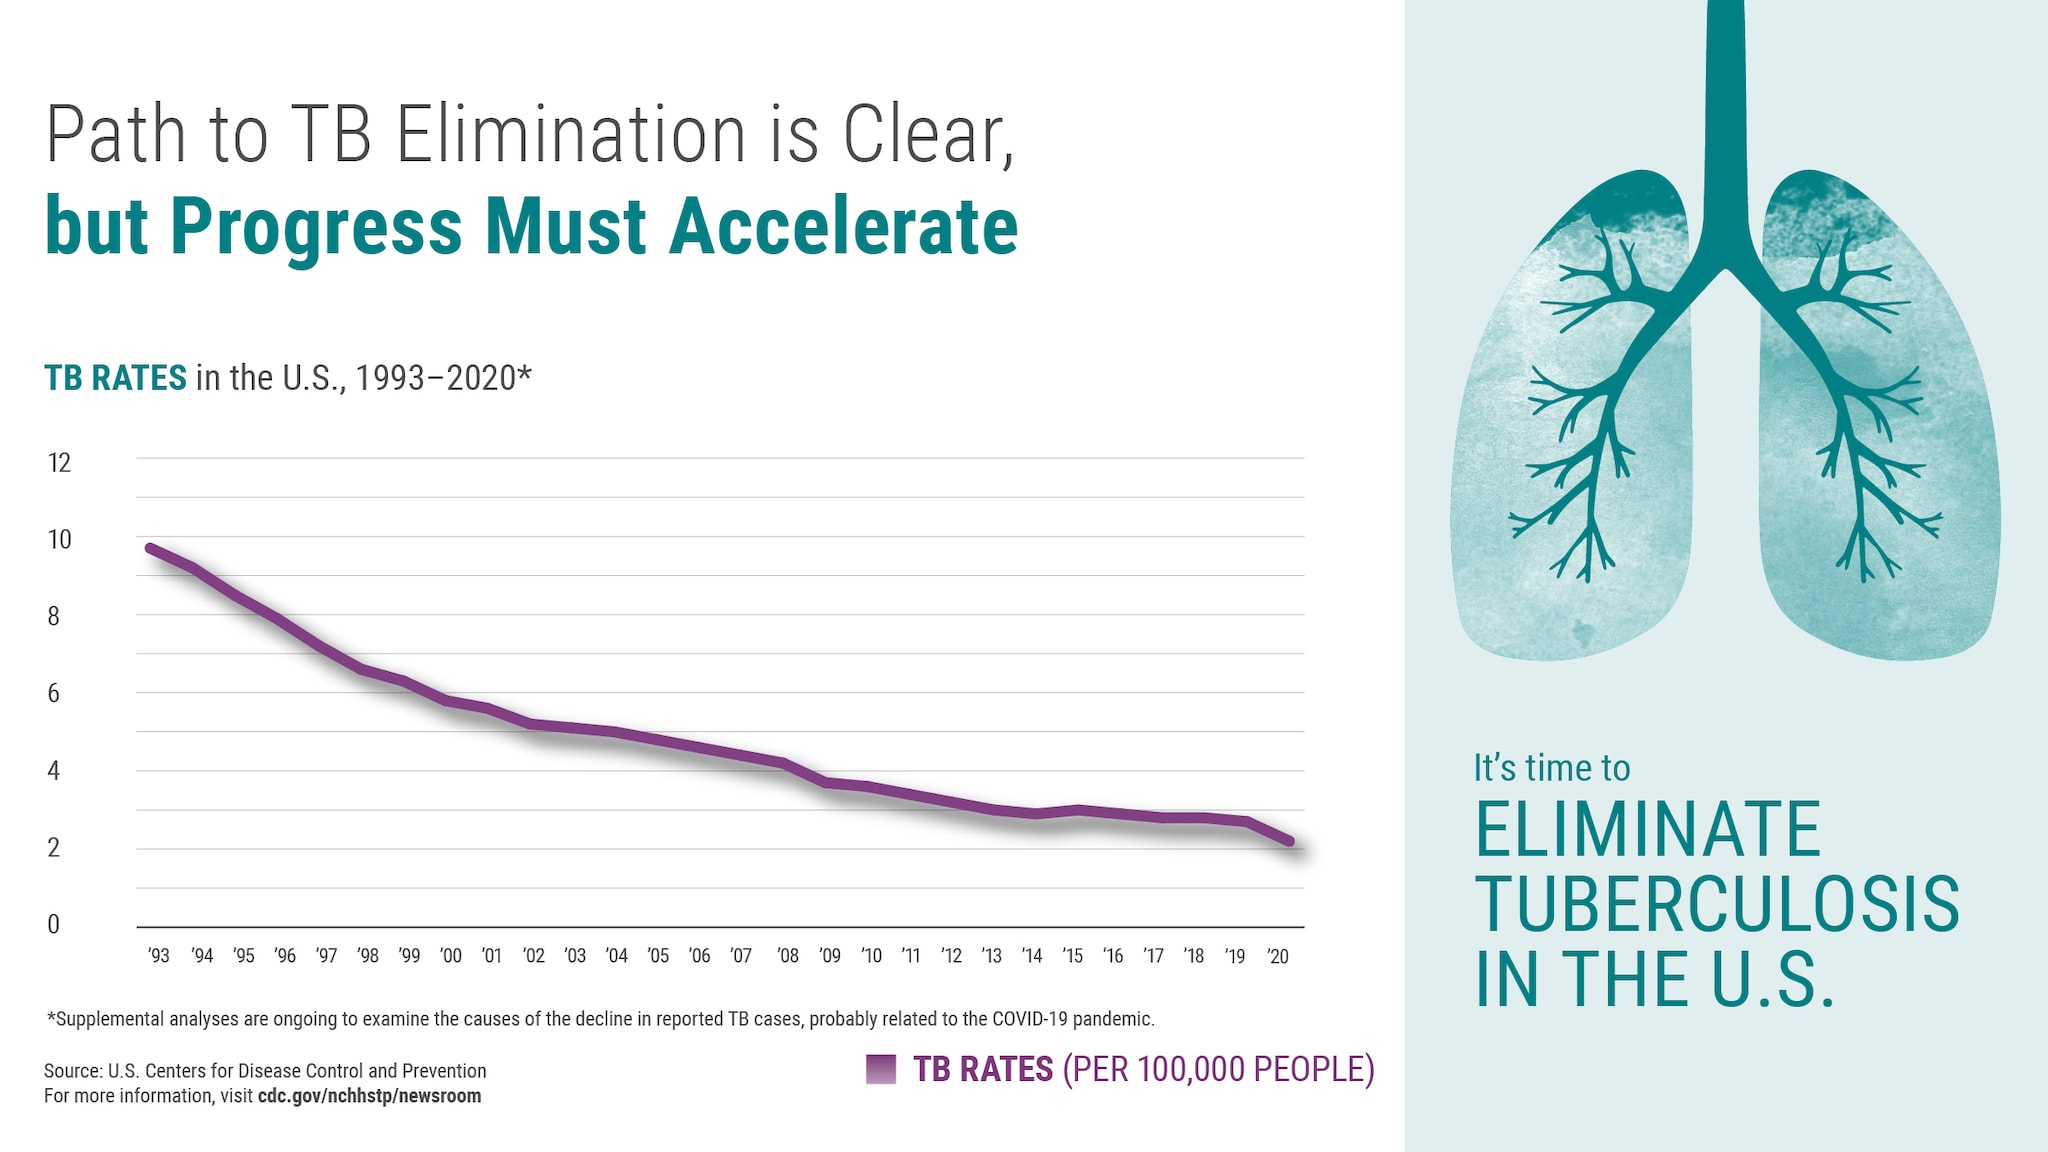
Although TB cases have fallen steadily since 1993, progress toward elimination has recently slowed and the COVID-19 pandemic has further strained TB prevention and control services.
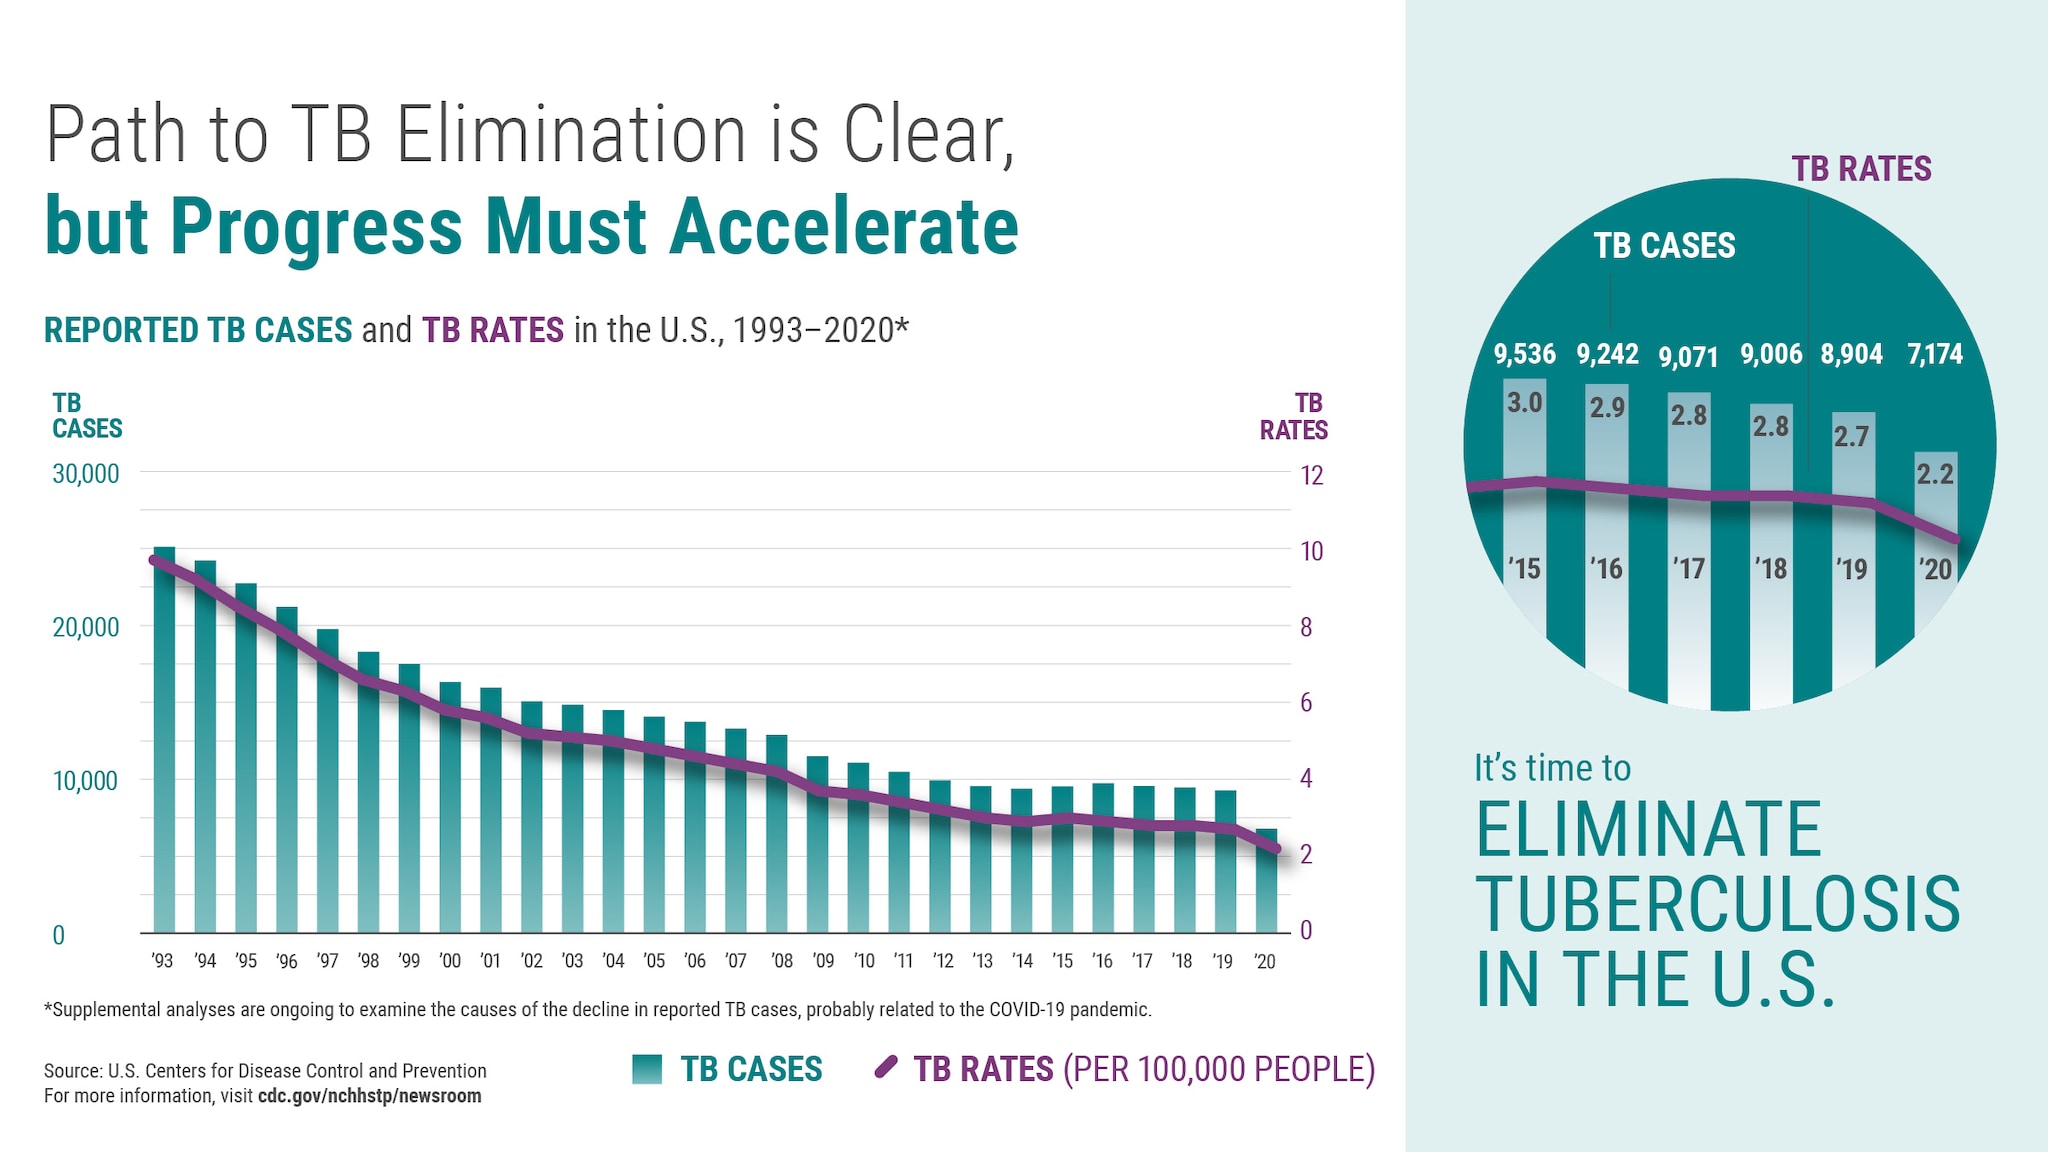
This graph shows data on TB in the U.S from 1993 to 2020. The total number of reported TB cases is displayed in bars, and the TB rate per 100,000 people is displayed as a line. The graph shows that while decreases in TB cases and TB rates have continued since 1993, the decrease has slowed in recent years. TB case counts in the U.S. ranged from a high point of 25,104 in 1993 to a low of 7,163 in 2020. The U.S. TB rate ranged from a high point of 9.7 in 1993 to a low of 2.2 in 2020. The data for 2019 are provisional. Beneath the graph is text that reads: Supplemental analyses are ongoing to examine the causes of the decline in cases, likely due to factors related to the COVID-19 pandemic.  On a right-hand panel there is a close-up of TB data from 2015 to 2020, which shows a plateau in the decline of both cases and rates during this time period. Beneath the data is text that reads: It’s time to eliminate tuberculosis in the U.S.[JPG - 586 KB]

The Path to TB Elimination Is Clear

While decreases in the U.S. TB rate has continued since 1993, the decrease has slowed in recent years. Preliminary 2020 data show that the current TB rate (2.2 cases per 100,000 persons) remains at levels 22 times higher than the TB elimination target rate.[JPG - 579 KB]

TB Rates in the U.S., 1993 – 2020 (Provisional)
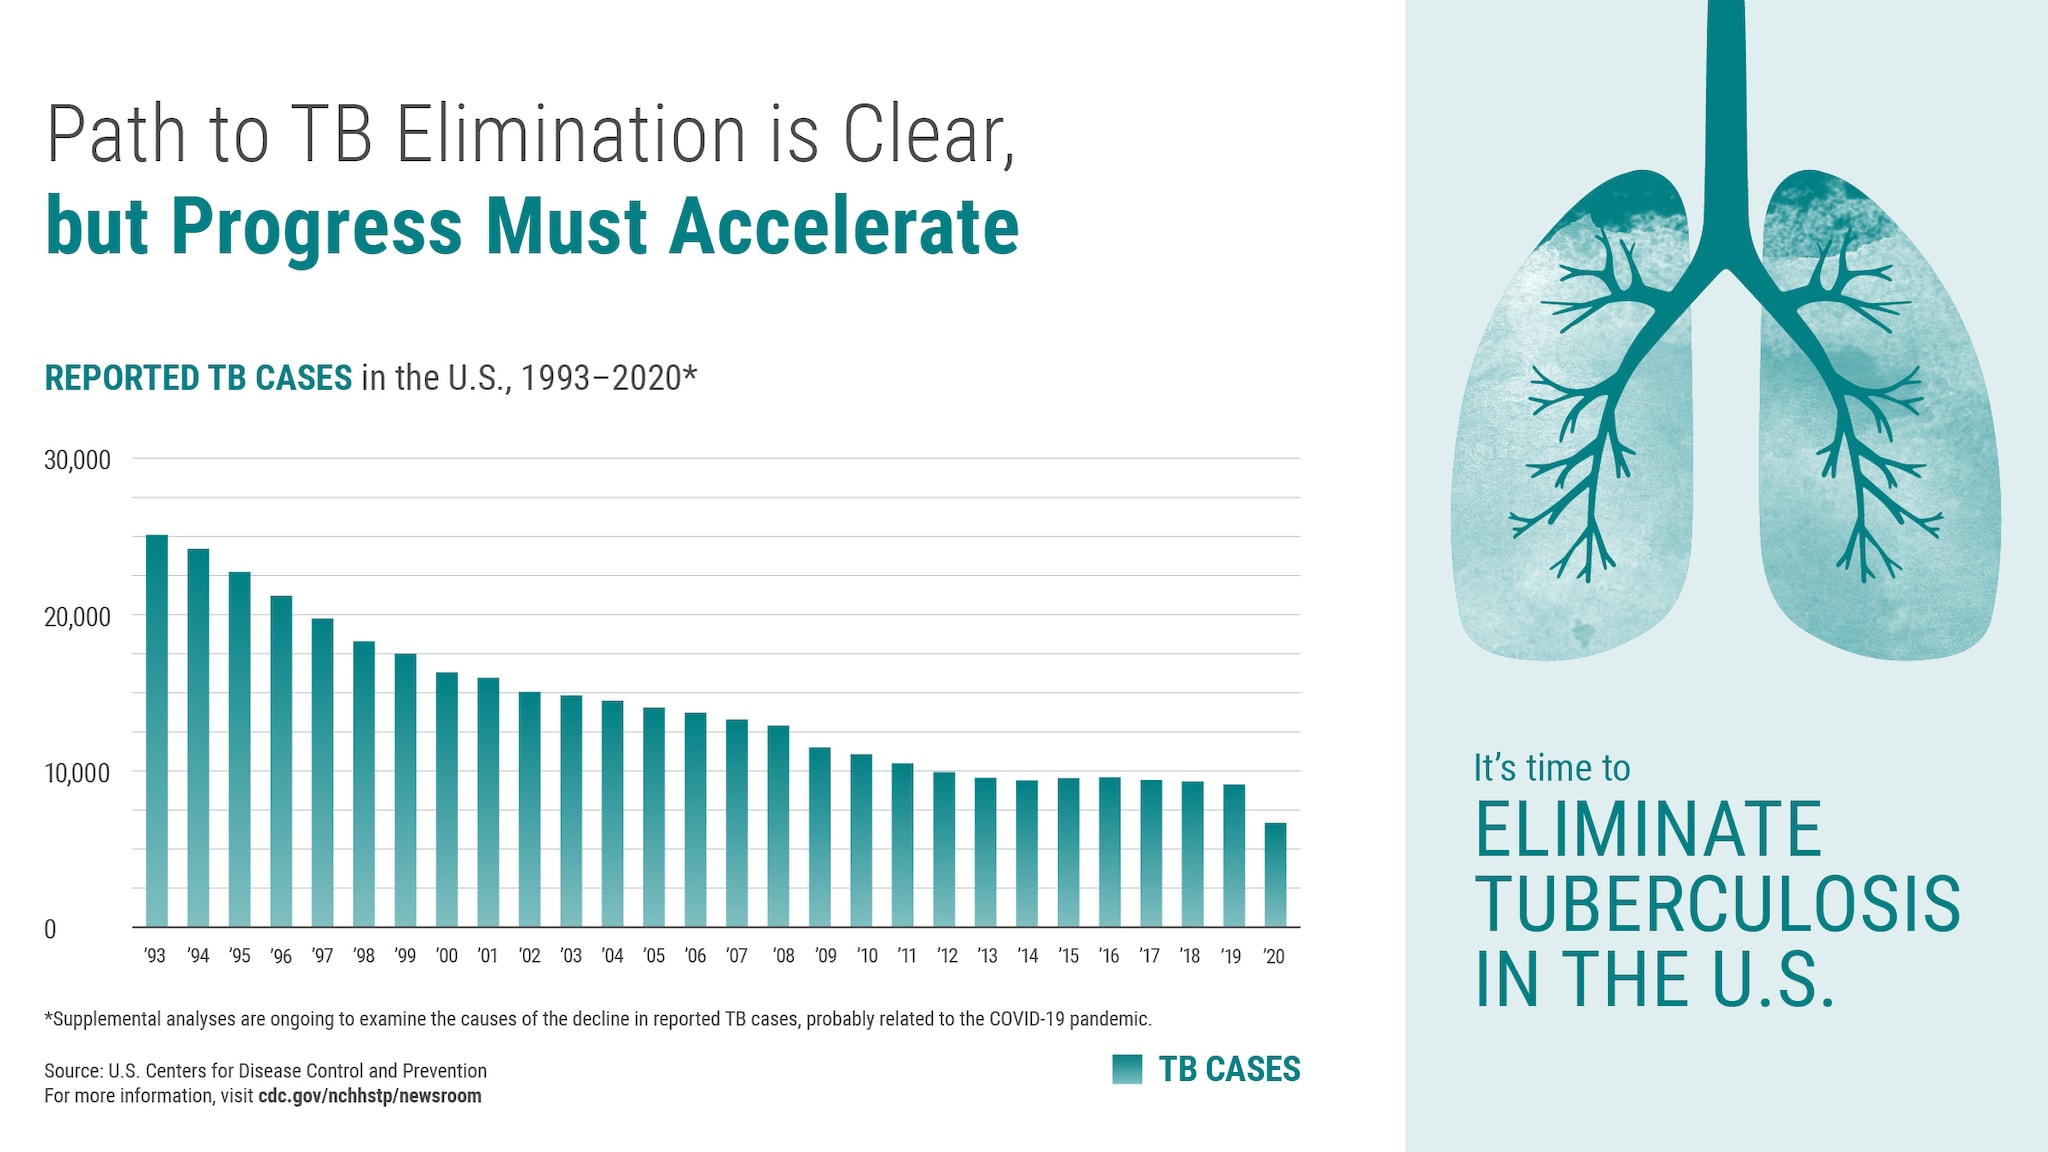
TB case counts in the U.S. ranged from a high point of 25,104 in 1993 to a low of 7,163 in 2020. However, progress has slowed in recent years.[JPG - 625 KB]

TB Cases in the U.S., 1993 – 2020 (Provisional)
Multimedia Archive
Still image from Medscape Commentary about New Treatment for MDR-TB with Dr. Sundari MaseExternal Link Icon

"New Treatment for MDR-TB" with Dr. Sundari Mase

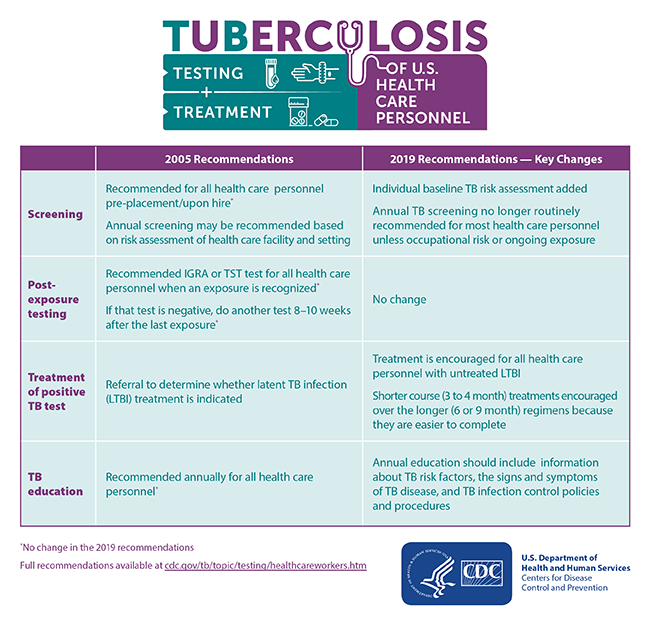
Updated Recommendations for TB Screening, Testing, and Treatment of U.S. Health Care Personnel - May 16, 2019
This graphic shows the key changes from the 2005 recommendations for TB Screening, Testing, and Treatment of U.S. Health Care Personnel Recommendations to the 2019 update.[JPG - 2 MB]

Key Changes in 2019 TB Screening, Testing, and Treatment of U.S. Health Care Personnel Recommendations
CDC Releases Updated Recommendations for Treatment of Latent TB Infection - June 28, 2018
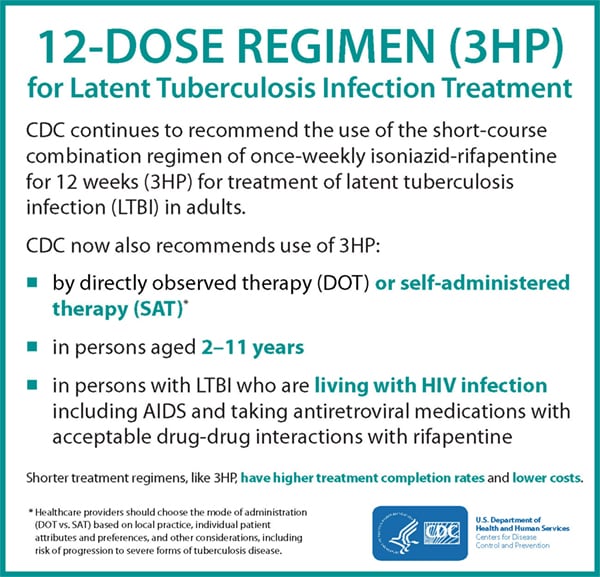
12 Dose Regimen (3HP) for Latent TB Infection Treatment[JPG - 391 KB]

12 Dose Regimen (3HP) for Latent TB Infection Treatment
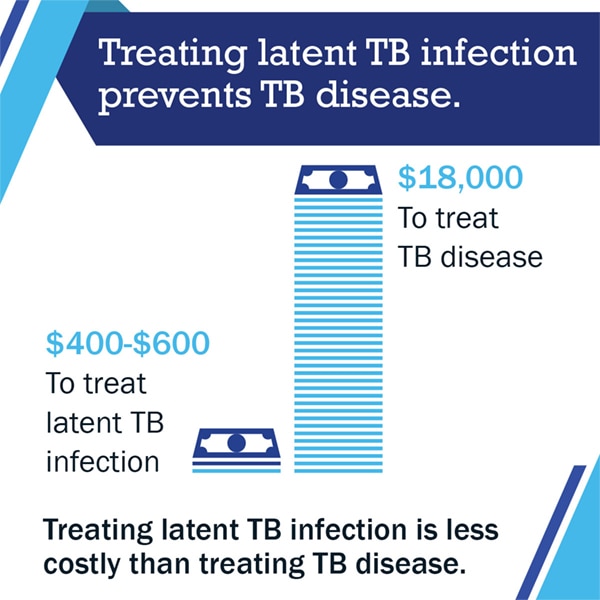
Latent TB Treatment Costs[JPG - 241 KB]

Latent TB Treatment Costs

Tuberculosis Continues to Decline in the U.S. but Progress Towards Elimination Is Slowing - March 22, 2018
Trends in TB Cases, 1992-2017 (Preliminary)[JPG - 907 KB]

Trends in TB Cases, 1992-2017 (Preliminary)
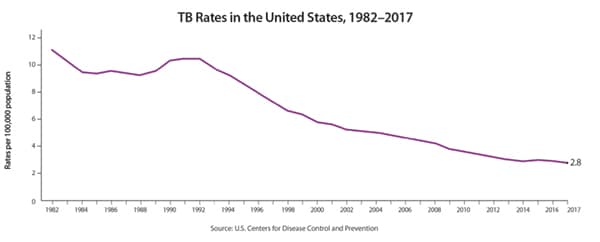
This line graph shows the TB rates in the United States between 1982 and 2017. There was a resurgence of TB in the mid-1980s with several years of increasing case counts until its peak in 1992. In 1993, case counts began decreasing again. While overall rates have declined since the peak, the decline has slowed significantly from 2012-2017. This slow progress threatens the realization of TB elimination in this century.[JPG - 770 KB]

TB Rates in the United States, 1982-2017 (Preliminary)
This line graph shows the TB rates in the United States between 1982 and 2017. There was a resurgence of TB in the mid-1980s with several years of increasing case counts until its peak in 1992. In 1993, case counts began decreasing again. While overall rates have declined since the peak, the decline has slowed significantly from 2012-2017. This slow progress threatens the realization of TB elimination in this century.[JPG - 772 KB]

Reported TB Cases in the United States, 1982-2017 (Preliminary)

Below are audio clips featuring NCHHSTP Director Jonathan Mermin, MD, MPH. To save the audio clip, right click the audio player and select the “Save audio as…” option.
Latest Analysis of TB Trends in the U.S. Indicates Progress Is Slow - March 23, 2017
This line graph shows the TB rates in the United States between 1982 and 2017. There was a resurgence of TB in the mid-1980s with several years of increasing case counts until its peak in 1992. In 1993, case counts began decreasing again. While overall rates have declined since the peak, the decline has slowed significantly from 2012-2017. This slow progress threatens the realization of TB elimination in this century.[JPG - 770 KB]

TB Rates in the United States, 1982-2017
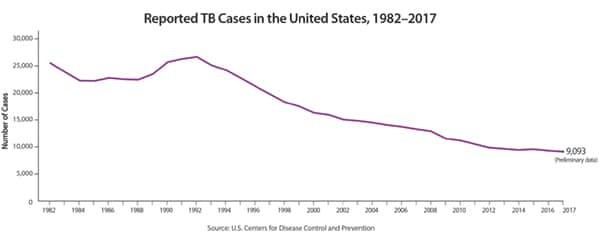
This bar chart shows trends in the number of reported TB cases in the US from 1992 to 2017. Starting with the peak of a resurgence of the disease in 1992, the chart shows a decline in the number of TB cases reported every year from 1992 to 2014, with a slight uptick in cases in 2015 (9,547). Preliminary 2017 data and analysis of trends indicate slight declines in TB cases. A magnified view of 2012 to 2017 shows the slow progress of declines.[JPG - 772 KB]

Reported TB Cases in the United States, 1982-2017

The Costly Burden of Drug-Resistant TB in the U.S. - November 2017
Outsized Financial Toll of MDR and XDR TB[JPG - 839 KB]

Outsized Financial Toll of MDR and XDR TB

A Major Human Cost[JPG - 335 KB]

A Major Human Cost

Chlamydia and Gonorrhea infections among Youth[JPG - 214 KB]

Chlamydia and Gonorrhea infections among Youth

Preventing and Controlling MDR and XDR TB in the U.S.[JPG - 542 KB]

Preventing and Controlling MDR and XDR TB in the U.S.