Viral Hepatitis Multimedia Resources

The high-resolution, public domain visuals below are available for use in your publication. This page will be updated as new media resources become available.

Commonly Requested Multimedia
Hepatitis C Virus

Illustration of the Hepatitis C Virus

Bar chart showing acute hep C infections increased between 2011 & 2020, with the highest number in 2020.

Estimated Number of Acute Hepatitis C Viral Infections

If you need more information about the data connected to the release, please click the more information button to find accompanying press releases, articles, and reports.

Data on Hepatitis C Treatment

New data reveal less than a third of people diagnosed with Hepatitis C receive timely treatment – August 9, 2022
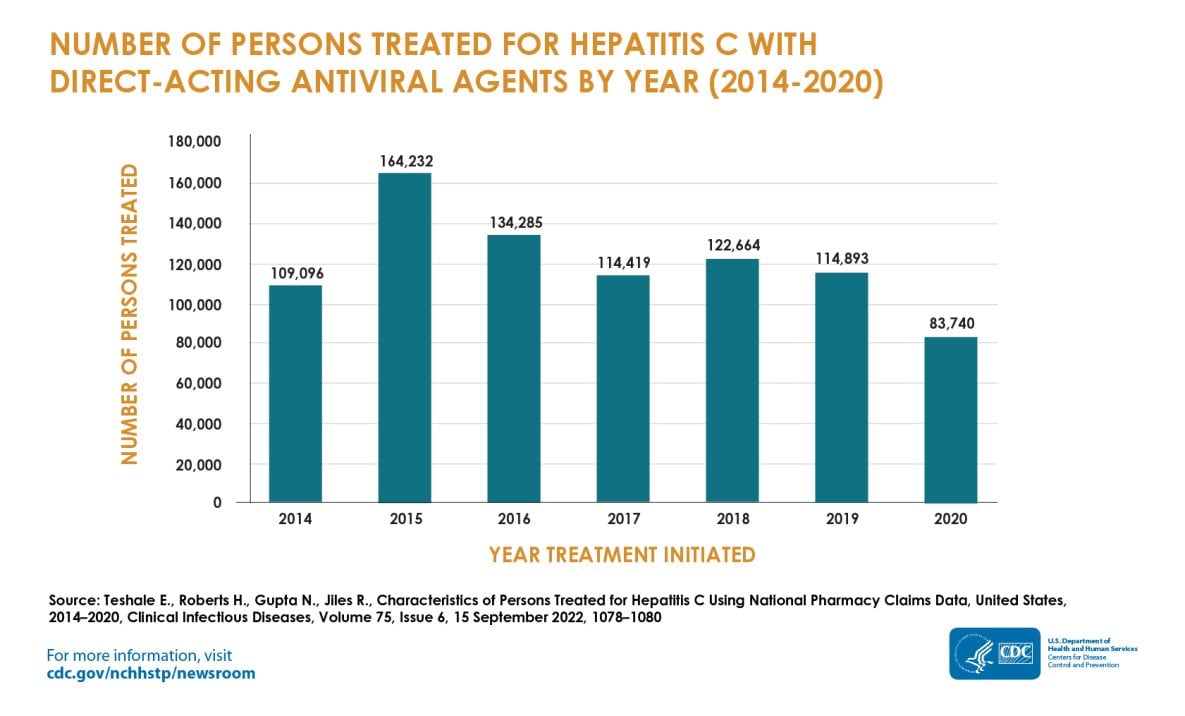
Bar chart showing persons treated for hep C with direct-acting antiviral agents was highest in 2015, declining between then and 2020.

Number of Persons Treated for Hepatitis C with Direct-Acting Antiviral Agents by Year

A bar chart, Timely Hepatitis C Treatment by Insurance Type, shows the period of 2019-2020. 23% of those with Medicaid received timely treatment for hepatitis C while 77% were not treated, 28% of those on Medicare received timely treatment while 72% were not treated, and 35% of those with private insurance got timely treatment while 65% were not treated.

Timely Hepatitis C Treatment by Insurance Type
Un gráfico de barras titulado “Tratamiento oportuno de la hepatitis C por tipo de seguro médico” que muestra el periodo del 2019 al 2020. El 23 % de las personas con Medicaid recibió tratamiento oportuno para la hepatitis C, mientras que el 77 % no tuvo tratamiento; el 28 % de las personas con Medicare recibió tratamiento oportuno, mientras que el 72 % no tuvo tratamiento; y el 35 % de las personas con seguro médico privado recibió tratamiento oportuno, mientras que el 65 % no tuvo tratamiento.

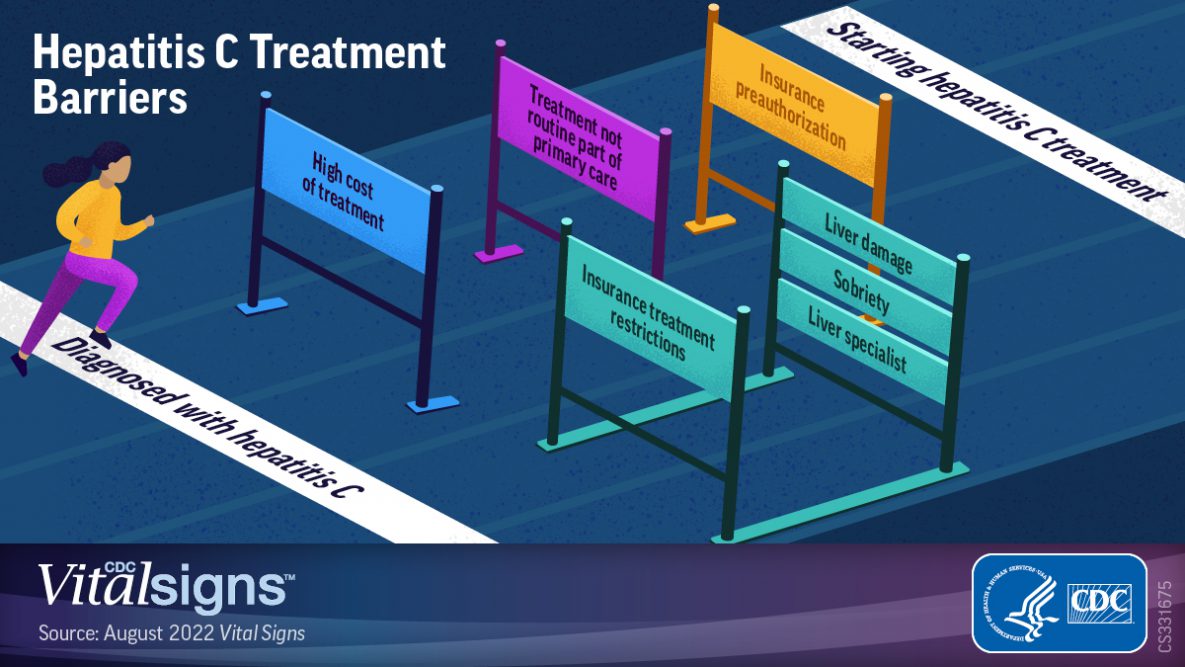
Hepatitis C Treatment Barriers

Hepatitis C Affects Multiple Generations

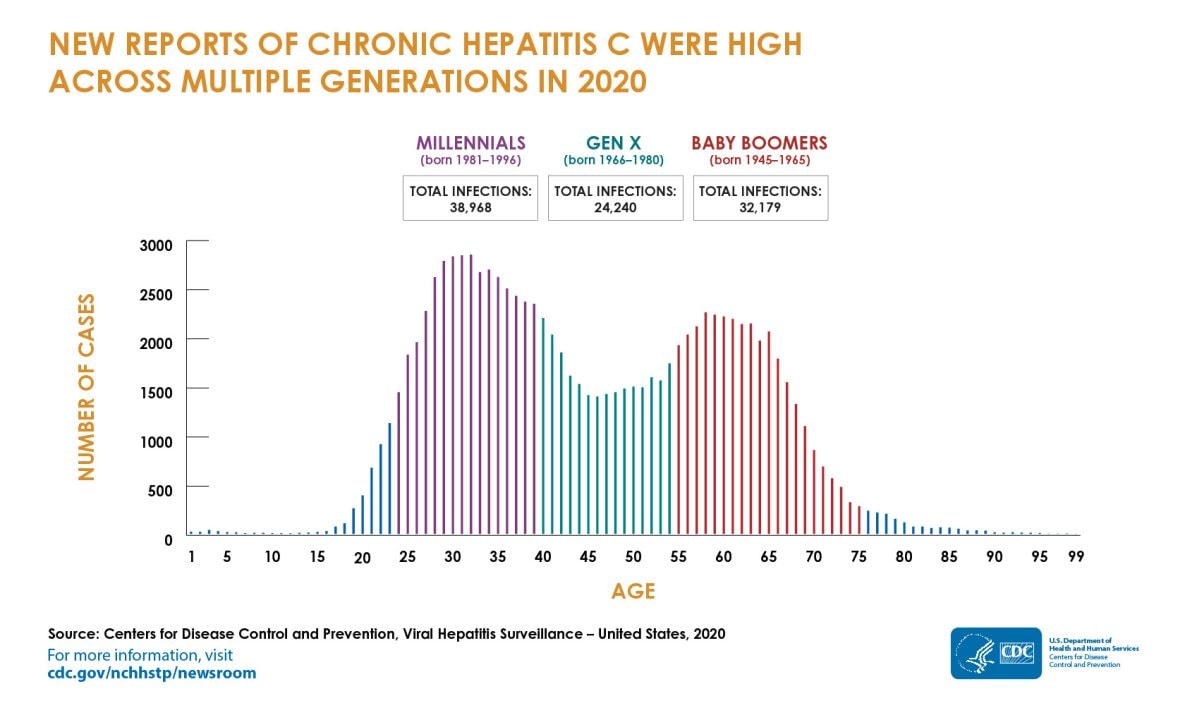
Data emphasize importance of new CDC hepatitis C screening recommendations for all adults.

Area chart showing that chronic hep C infections diagnosed in 2020 were high across multiple generations, & highest among millennials.

New Reports of Chronic Hepatitis C were High Across Multiple Generations

Shaded line chart showing a 68% increase in the proportion of births to pregnant people with hep C from 2011 to 2014.

Proportion of Births to Pregnant People with Hepatitis C

Spanish-Language Graphics (Graficos)
Un gráfico de barras titulado “Tratamiento oportuno de la hepatitis C por tipo de seguro médico” que muestra el periodo del 2019 al 2020. El 23 % de las personas con Medicaid recibió tratamiento oportuno para la hepatitis C, mientras que el 77 % no tuvo tratamiento; el 28 % de las personas con Medicare recibió tratamiento oportuno, mientras que el 72 % no tuvo tratamiento; y el 35 % de las personas con seguro médico privado recibió tratamiento oportuno, mientras que el 65 % no tuvo tratamiento.

Tratamiento oportuno do la hepatitis C por tipo de Seguro medico