HIV Multimedia Resources
The high-resolution, public domain visuals below are available for use in your publication. This page will be updated as new media resources become available.

If you need more information about the data connected to the release, please click the more information button to find accompanying press releases, articles, and reports.
Despite overall progress in reducing HIV transmission in the United States, HIV continues to affect some groups more than others due to longstanding and ingrained barriers. Black or African American (hereafter referred to as Black) people account for a higher proportion of new HIV infections, compared to other races and ethnicities. Black people accounted for 13% of the U.S. population but 40% of people with HIV in 2019, according to CDC estimates.
 [JPG - 290 KB]
New HIV Infections in the U.S., by Race/Ethnicity, 2019
 [JPG - 318 KB]
People with HIV Infection in the U.S., by Race/Ethnicity, 2019
 [JPG - 710 KB]
New HIV Infections by Race and Transmission Group, 2019
") [JPG - 269 KB]
[JPG - 269 KB]Viral Suppression in the U.S. by Race/Ethnicity, 2019 (45 Jurisdictions)
 [JPG - 355 KB]
PrEP Coverage in the U.S. by Race/Ethnicity, 2019
Despite overall progress in reducing new infections among gay and bisexual men, the HIV epidemic continued and was more severe among Black and Hispanic/Latino gay and bisexual men from 2010-2019.
 [JPG - 333 KB]
New HIV Infections Among Gay and Bisexual Men in the U.S. by Race/Ethnicity, 2010 vs. 2019
 [JPG - 259 KB]
Percent of Gay and Bisexual Men with HIV BY Race/Ethnicity in 2019
 [JPG - 224 KB]
Percent of Gay and Bisexual Men Using PrEP in the U.S. by Race/Ethnicity, 2017
New HIV infections fell 8% from 2015 to 2019, after a period of general stability. However, addressing continued disparities will be crucial to end the HIV epidemic.
 [JPG - 256 KB]
Annual HIV Infections in the U.S., 2015-2019
 [JPG - 234 KB]
PrEP Coverage in the U.S. By Race/Ethnicity, 2019
 [JPG - 248 KB]
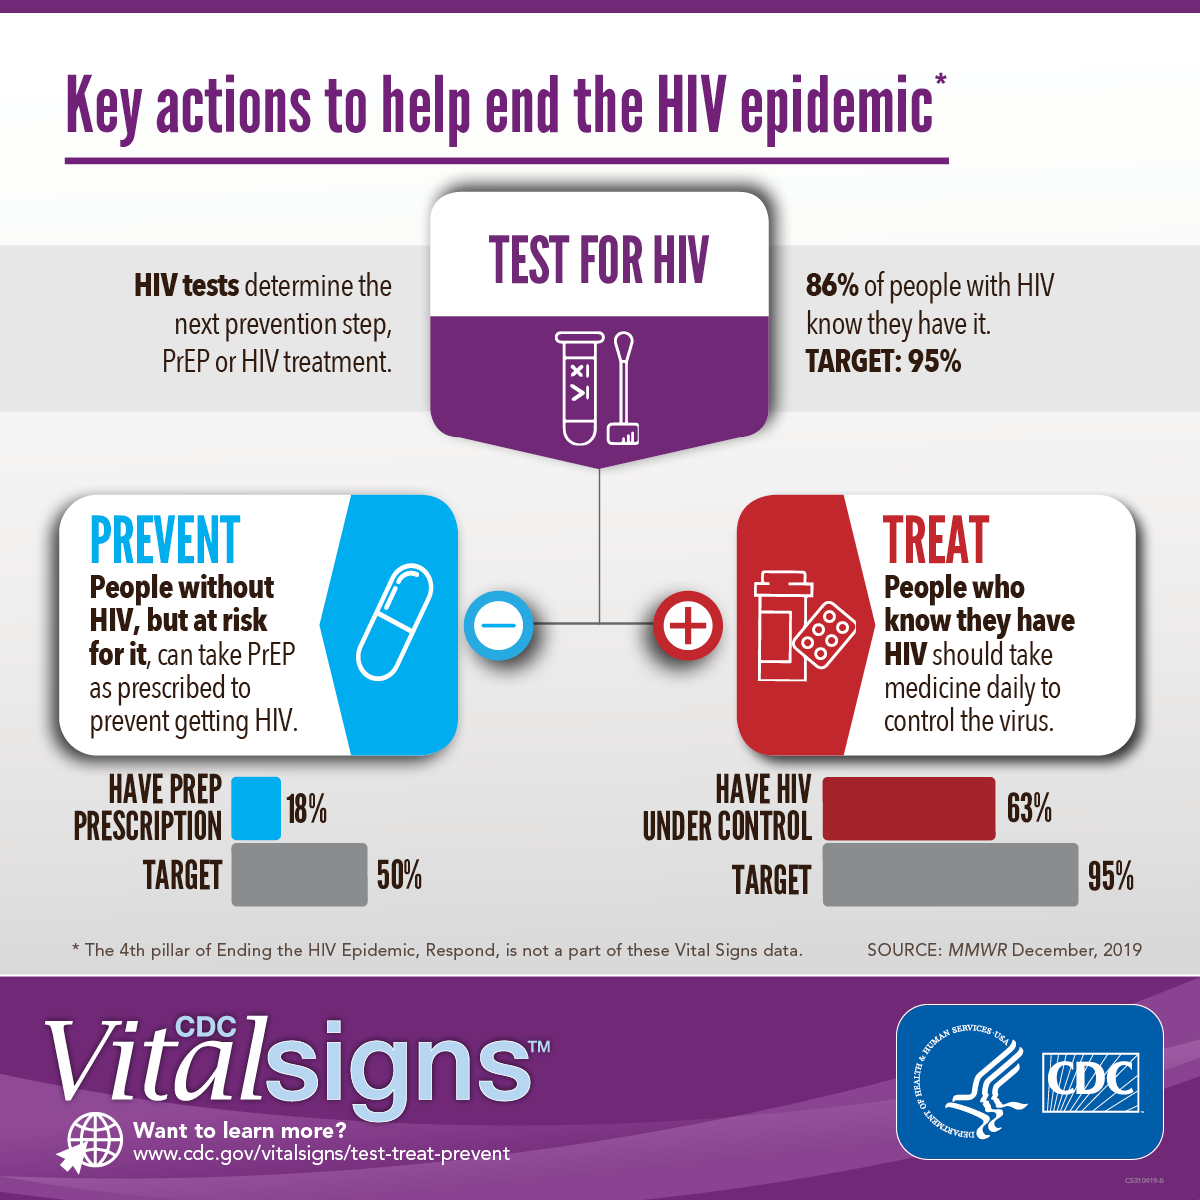
CDC Vital Signs: Ending HIV Transmission — Test, Treat, and Prevent
 [JPG - 358 KB]
Lifetime Risk of HIV Diagnosis by Transmission Group
 [JPG - 311 KB]
Lifetime Risk of HIV Diagnosis among MSM by Race/Ethnicity
 [JPG - 392 KB]
Lifetime Risk of HIV Diagnosis by Race/Ethnicity
 [JPG - 269 KB]
HIV Prevalence and New Infections, 1980-2012
 [JPG - 394 KB]
Death Rates among People with Diagnosed HIV, Map by State, 2012
 [JPG - 833 KB]
Lifetime Lifetime Risk of HIV Diagnosis by State
 [JPG - 905 KB]
Death Rate among People with Diagnosed HIV by State, 2012
 [JPG - 279 KB]
Retention in HIV Care, by Race/Ethnicity
 [JPG - 293 KB]
HIV Diagnoses by Transmission Category, 2005-2014
 [JPG - 380 KB]
Percentage of People Living with HIV who are Aware of their Status, Map by State, 2012
 [JPG - 351 KB]
HIV Diagnoses among Women by Race/Ethnicity, 2005-2014
 [JPG - 914 KB]
Percentage of People Living with HIV who are Aware of their Status, by State, 2012
 [JPG - 358 KB]
HIV Diagnoses among MSM by Race/Ethnicity, 2005-2014
 [JPG - 382 KB]
HIV Diagnosis, 2013
 [JPG - 408 KB]
New HIV Infections in the U.S. for the Most-Affected Sub-populations
 [JPG - 302 KB]
HIV Diagnoses among MSM age 13-24 by Race/Ethnicity, 2005-2014
 [JPG - 343 KB]
HIV Diagnoses by Race/Ethnicity, 2005-2014
 [JPG - 184 KB]
Estimated New HIV Infections by Route of Transmission, 2010
 [PNG - 196 KB]
CDC Vital Signs: Ending HIV Transmission — Test, Treat, and Prevent
 [PNG - 185 KB]
HIV Treatment Along the Continuum of Care
 [JPG - 92 KB]
HIV Incidence: Estimated Annual Infections in the U.S., 2014-2018
 [JPG - 562 KB]
HIV prevention pill is not reaching most who could potentially benefit – especially African Americans and Latinos
 [JPG - 294 KB]
Jonathan Mermin MD, MPH, discusses the untapped potential of PrEP
 [JPG - 275 KB]
Eugene McCray, MD, discusses the importance of closing PrEP gaps
 [JPG - 309 KB]
HIV Diagnosis Delays by Risk Group and Race/Ethnicity
 [JPG - 624 KB]
HIV Diagnosis Delays Fast Facts
 [JPG - 238 KB]
HIV Care Continuum, Two Stages, U.S., 2014
 [JPG - 642 KB]
HIV Care Continuum, by Age, U.S., 2014
 [JPG - 71 KB]
HIV Care Continuum, by Race/Ethnicity, U.S., 2014
 [JPG - 435 KB]
HIV Care Continuum, Overall, U.S., 2014
 [JPG - 442 KB]
HIV Care Continuum, by Sex, U.S., 2014
 [JPG - 321 KB]
HIV Care Continuum, by Transmission Route, U.S.
 [JPG - 470 KB]
Estimated New HIV Infections in the US by Transmission Route
 [JPG - 202 KB]
Estimated New HIV Infections in 2014, Nationally and by State
 [JPG - 736 KB]
Annual African American HIV Diagnoses, 2015
 [JPG - 759 KB]
Progress in HIV Diagnoses Among African American Women