World TB Day 2021
March 25, 2021 – Progress Toward Tuberculosis Elimination Has Slowed in Recent Years
The number of TB disease cases in the United States has fallen steadily since 1993, due to the dedicated work of TB programs to detect, treat, and prevent TB disease. However, progress toward TB elimination has slowed in recent years and the COVID-19 pandemic has further strained public health services, including TB prevention and control services.
New provisional data show there were 7,163 cases reported in 2020, compared to 8,902 cases reported in 2019. While COVID-19 pandemic mitigation efforts and reduced travel might have contributed to the decline, the size of the decrease among different groups also raises concerns about missed or delayed diagnoses for TB disease. CDC is conducting further analyses to understand the impact of COVID-19 on TB case reporting. Timely TB diagnoses save lives and prevent the spread of TB disease.
TB is still a life-threatening problem in this country. TB knows no borders, and people here in the United States are suffering from TB. Anyone can get TB. View TB Personal Stories for insights into the experiences of several people who were diagnosed and treated for TB disease, as well as the work of TB control professionals.
- MMWR Media Summary: Tuberculosis – United States, 2020
- MMWR: Tuberculosis – United States, 2020
- Additional World TB Day Resources
- Fact Sheet: TB in the United States, 2020*pdf icon
- Infographic: The Costly Burden of Drug-Resistant TB in the U.S.pdf icon
Graphics:
These high-resolution, public domain images are ready to download and print in your publication. Click on a graphic to see it in high-resolution. For your convenience, we have included a table that contains the specific data from the report used to generate these charts. These images are in the public domain and are thus free of any copyright restrictions. As a matter of courtesy, we ask that the content provider be credited and notified of any public or private usage of an image.
Download High Resolution Versionimage icon
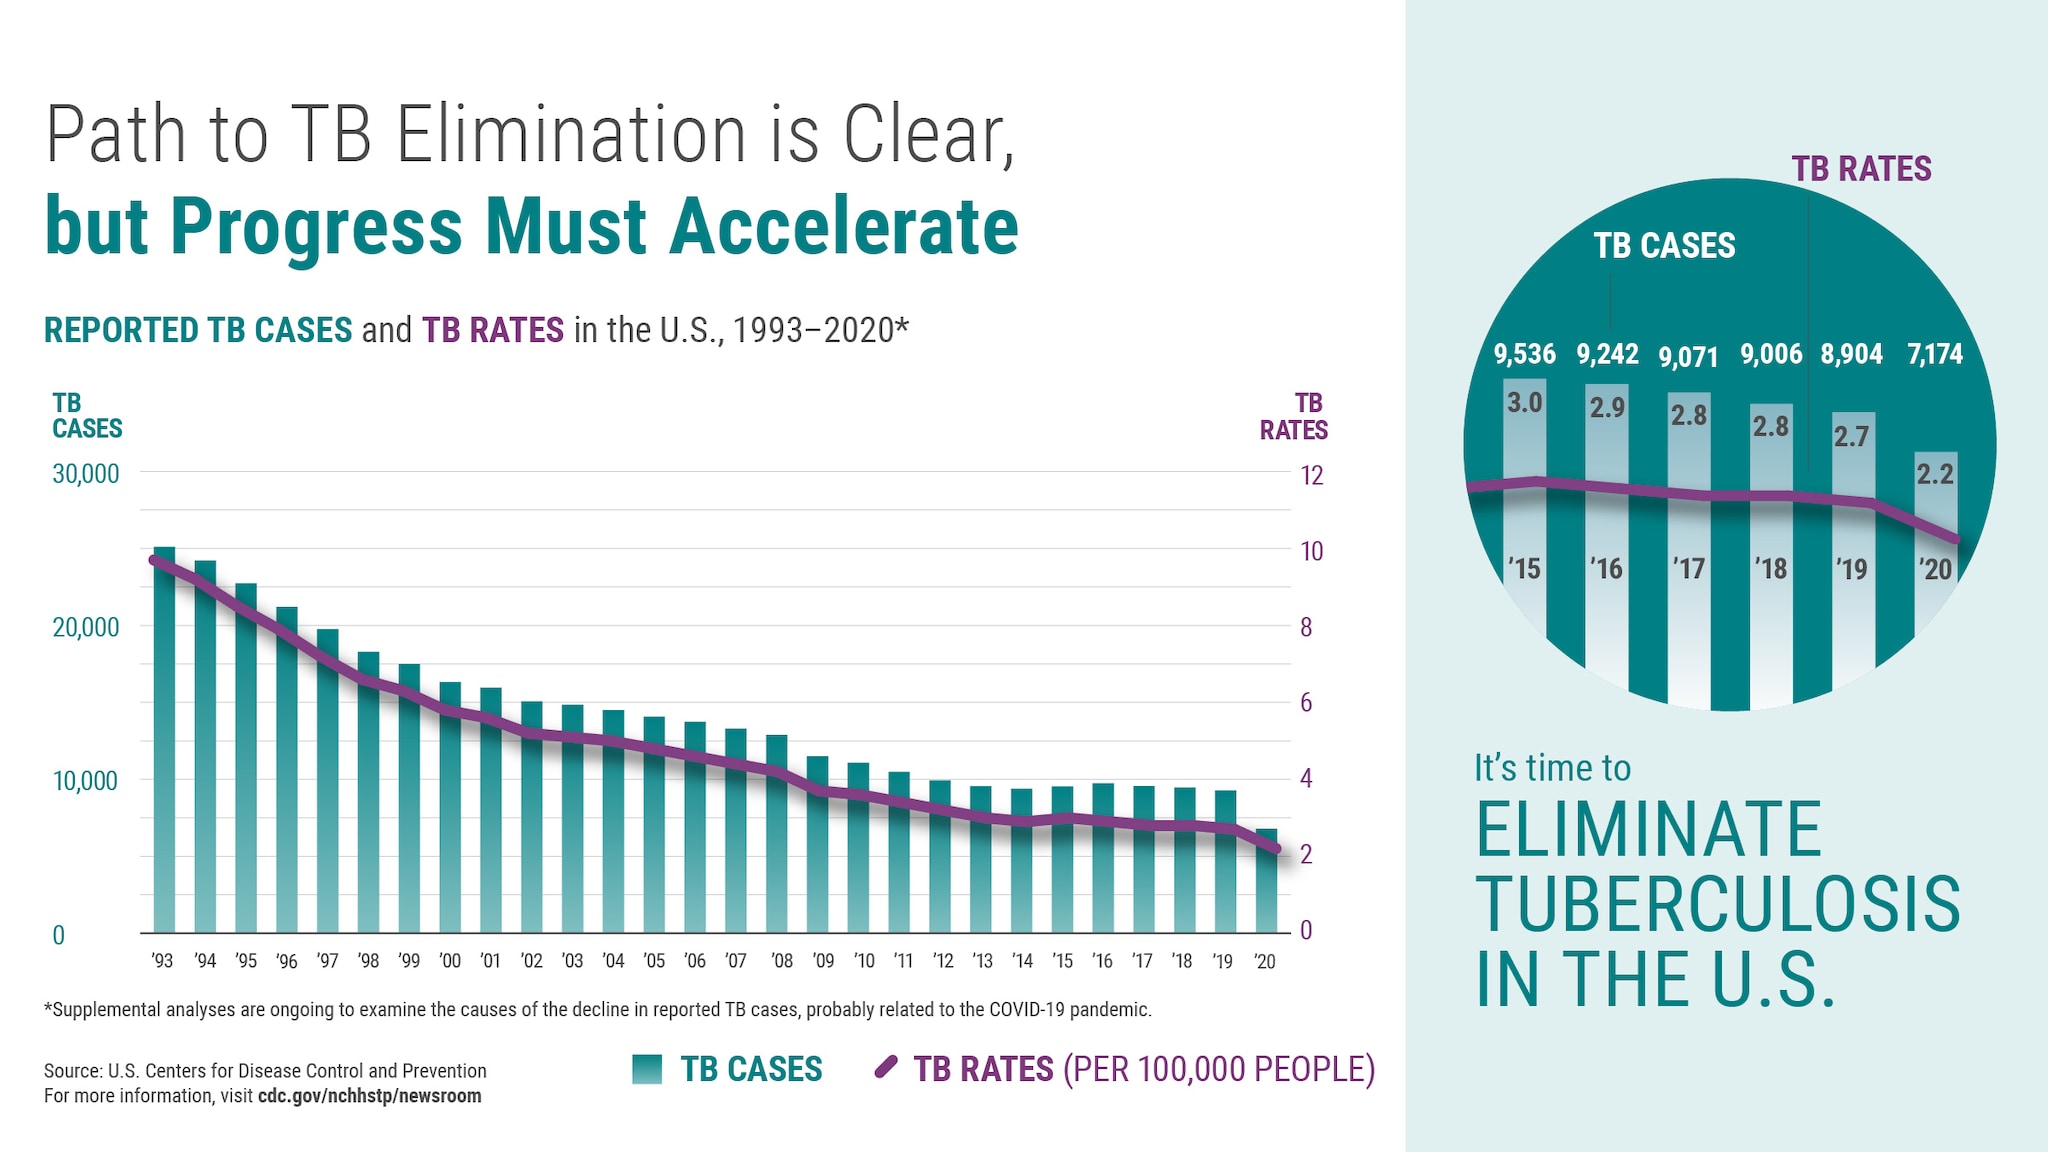
The graphic shows a bar graph of TB cases and a line graph of TB rates in the U.S. from 1993 to 2020. TB cases ranged from 25,104 in 1993 to 7,174 in 2020. TB rates ranged from 9.7 in 1993 to 2.2 in 2020.
The graphic also shows a close-up of TB cases and rates from 2015 to 2020.
Download High Resolution Versionimage icon
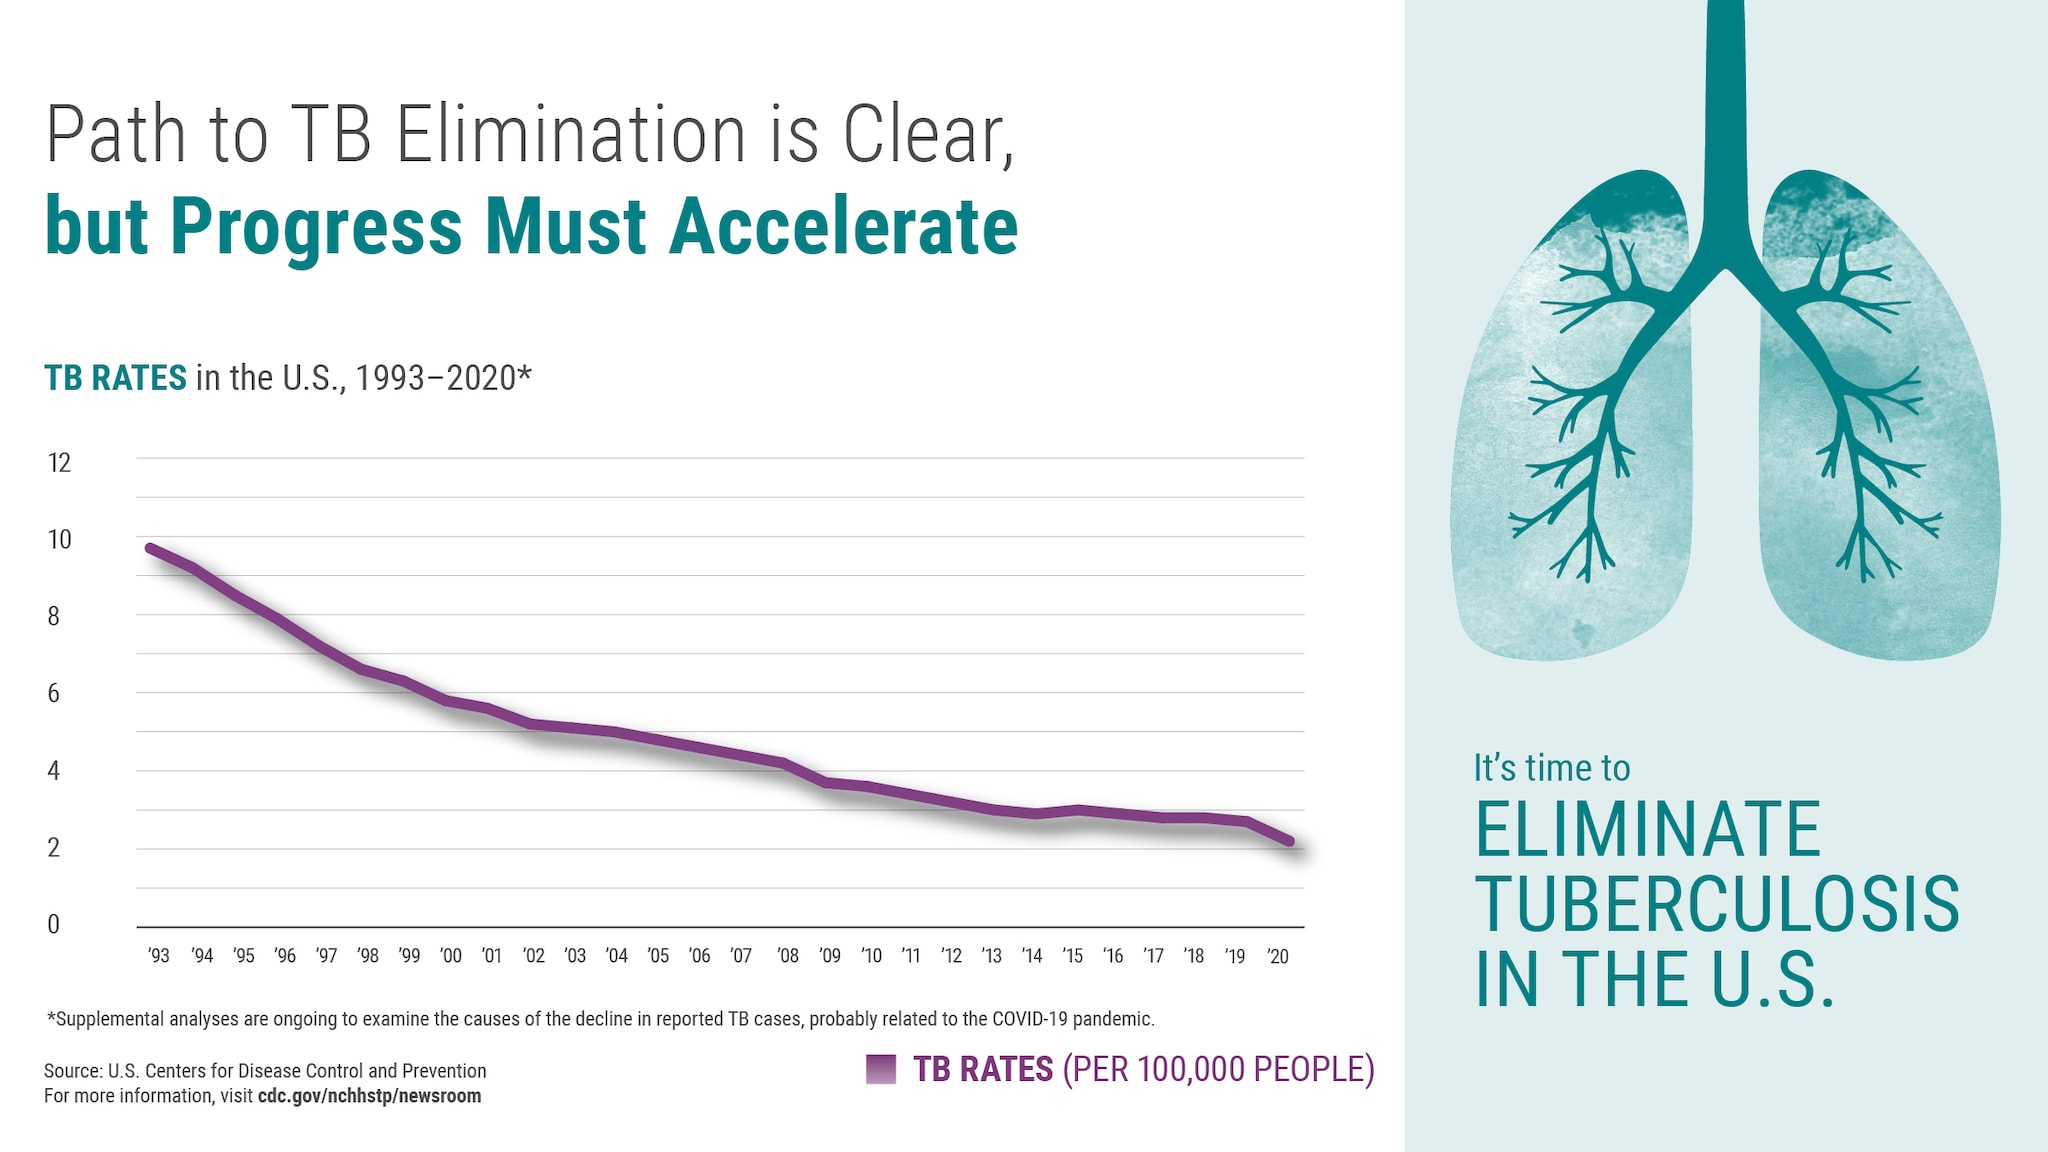
The graphic includes a line graph showing that the U.S. TB rate ranged from 9.7 in 1993 to 2.2 in 2020.
Download High Resolution Versionimage icon
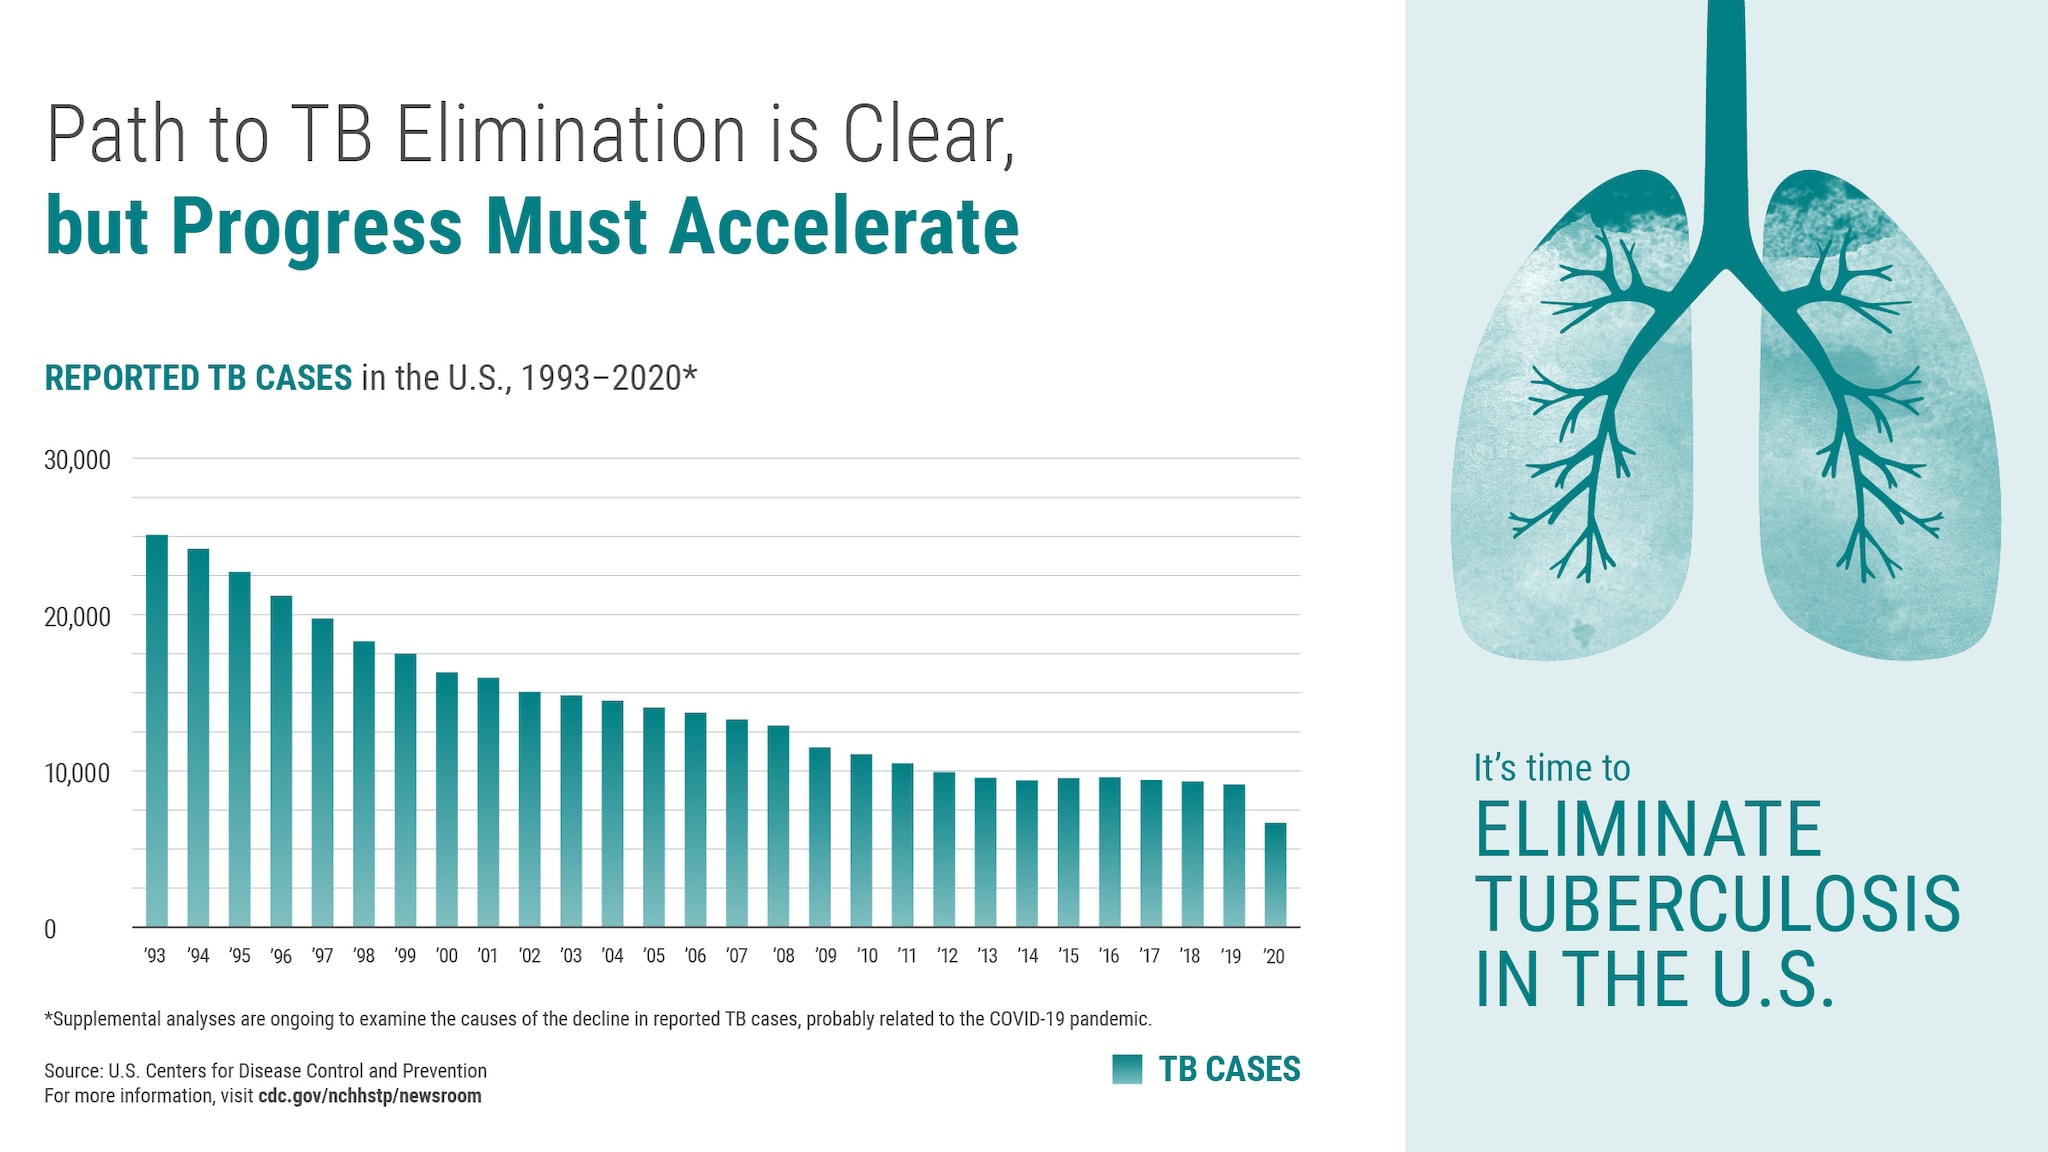
The graphic includes a bar graph showing that TB cases in the U.S. ranged from 25,104 in 1993 to 7,174 in 2020.


