Appendix 1: Calculation and Application of a Vector Index (VI) Reflecting the Number of West Nile Virus Infected Mosquitoes in a Population
‹View Table of Contents
BACKGROUND. The establishment of West Nile virus (WNV) across North America has been accompanied by expanded efforts to monitor WNV transmission activity in many communities. Surveillance programs use various indicators to demonstrate virus activity. These include detecting evidence of virus in dead birds, dead horses, and mosquitoes; and detection of antibody against WNV in sentinel birds, wild birds, or horses (Reisen & Brault 2007). While all of these surveillance practices can demonstrate the presence of WNV in an area, few provide reliable, quantitative indices that may be useful in predictive surveillance programs. Only indices derived from a known and quantifiable surveillance effort conducted over time in an area will provide information that adequately reflects trends in virus transmission activity that may be related to human risk. Of the practices listed above, surveillance efforts are controlled and quantifiable only in mosquito and sentinel-chicken based programs. In these programs, the number of sentinel chicken flocks/number of chickens, and the number of mosquito traps set per week is known and allows calculation of meaningful infection rates that reflect virus transmission activity.
Premise Behind Developing the Vector Index (VI)
Mosquito-based arbovirus surveillance provides three pieces of information: The variety of species comprising of the mosquito community; density of each species population (in terms of the number collected in each trap unit of a given trap type); and if the specimens are tested for the presence of arboviruses, the incidence of the agent in the mosquito population. Taken individually, each parameter describes one aspect of the vector community that may affect human risk, but the individual elements don’t give a comprehensive estimate of the number of potentially infectious vectors seeking hosts at a given time in the surveillance area.
Parameter
Parameter
Information Provided
Information Provided
Value in Surveillance Program
Value in Surveillance Program
Mosquito Community Composition
Mosquito Community Composition
Diversity of species in the area
Diversity of species in the area
Documents the presence of competent vector species in the area
Documents the presence of competent vector species in the area
Mosquito Population Density
Mosquito Population Density
Relative abundance of mosquito species in terms of trapping effort
Relative abundance of mosquito species in terms of trapping effort
Quantifies the number of individuals of each mosquito species at a given point in time, particularly important for key vector species
Quantifies the number of individuals of each mosquito species at a given point in time, particularly important for key vector species
Infection Rate of Virus in Mosquito Population
Infection Rate of Virus in Mosquito Population
Proportion of the mosquito population carrying evidence of the disease agent
Proportion of the mosquito population carrying evidence of the disease agent
Quantifies incidence of infected and potentially infectious mosquitoes in the key vector population. Demonstrates if important bridge vectors are involved
Quantifies incidence of infected and potentially infectious mosquitoes in the key vector population. Demonstrates if important bridge vectors are involved
Vector Index
To express the arbovirus transmission risk posed by a vector population adequately, information from all three parameters (vector species presence, vector species density, vector species infection rate) must be considered. The VI combines all three of the parameters quantified through standard mosquito surveillance procedures in a single value (Gujaral et al. 2007, Bolling et al. 2009, Jones et al. 2011, Kwan et al. 2012, Colborn et al. 2013 in press). The VI is simply the estimated average number of infected mosquitoes collected per trap night summed for the key vector species in the area. Summing the VI for the key vector species incorporates the contribution of more than one species and recognizes the fact that WNV transmission may involve one or more primary vectors and several accessory or bridge vectors in an area.
Deriving the VI from routine mosquito surveillance data
The VI is expressed as:
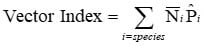
Where:
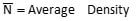
(number per trap night for a given species)
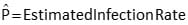
(proportion of the mosquito population WNV positive)
Calculating the VI in an area where two primary WNV vector species occur:
Step 1: Calculate mosquito density
Trap Site
Trap Site
Cx. tarsalis
Cx. tarsalis
Cx. pipiens
Cx. pipiens
1
1
68
68
21
21
2
2
42
42
63
63
3
3
139
139
49
49
4
4
120
120
31
31
5
5
42
42
12
12
6
6
31
31
57
57
Total
Total
442
442
233
233
Average per Trap Night
Average per Trap Night
74
74
39
39
Standard Deviation
Standard Deviation
41
41
21
21
Step 2: Calculate the WNV infection rate for each species (as a proportion)
Pools Tested for Virus
Pools Tested for Virus
Pools Tested for Virus
Pool Number
Pool Number
Species
Species
Number in pool
Number in pool
Positives
Positives
1
1
Cx. tarsalis
Cx. tarsalis
50
50
0
0
2
2
Cx. tarsalis
Cx. tarsalis
50
50
0
0
3
3
Cx. tarsalis
Cx. tarsalis
50
50
1
1
4
4
Cx. tarsalis
Cx. tarsalis
50
50
0
0
5
5
Cx. tarsalis
Cx. tarsalis
50
50
0
0
6
6
Cx. tarsalis
Cx. tarsalis
50
50
0
0
7
7
Cx. pipiens
Cx. pipiens
50
50
1
1
8
8
Cx. pipiens
Cx. pipiens
50
50
0
0
9
9
Cx. pipiens
Cx. pipiens
50
50
0
0
10
10
Cx. pipiens
Cx. pipiens
50
50
0
0
11
11
Cx. pipiens
Cx. pipiens
50
50
0
0
Cx. tarsalis
Infection Rate
Infection Rate
Lower limit
Lower limit
Upper limit
Upper limit
Confidence interval
Confidence interval
0.0033
0.0033
0.0002
0.0002
0.0169
0.0169
0.95
0.95
Cx. pipiens
Infection Rate
Infection Rate
Lower limit
Lower limit
Upper limit
Upper limit
Confidence interval
Confidence interval
0.0040
0.0040
0.0002
0.0002
0.0206
0.0206
0.95
0.95
Step 3. Calculate individual species VI values, multiplying the average number per trap night by the proportion infected. Calculate combined VI value by summing the individual species VIs.
VI Calculation
VI Calculation
Cx. tarsalis
Cx. tarsalis
Cx. pipiens
Cx. pipiens
Avg / trap night
Avg / trap night
74
74
39
39
Proportion infected
Proportion infected
0.0033
0.0033
0.004
0.004
VI (individual species)
VI (individual species)
0.24
0.24
0.16
0.16
VI (combined)
0.40
References – Vector Index
Bolling BG, Barker CM, Moore CG, Pape WJ, Eisen L. 2009. Seasonal patterns for entomological measures of risk for exposure to Culex vectors and West Nile virus in relation to human disease cases in northeastern Colorado. J Med Entomol. 46(6):1519-31.
Colborn, J.M., K.A. Smith, J. Townsend, D. Damian, R.S. Nasci, J.P. Mutebi. 2013. West Nile Virus Outbreak in Phoenix, Arizona—2010: Entomological Observations and Epidemiological Correlations. J Amer Mosq Control Assoc. In press.
Gujral IB, Zielinski-Gutierrez EC, LeBailly A, Nasci R. 2007. Behavioral risks for West Nile virus disease, northern Colorado, 2003. Emerg Infect Dis. 13(3):419-25.
Jones RC, Weaver KN, Smith S, Blanco C, Flores C, Gibbs K, Markowski D, Mutebi JP. 2011. Use of the vector index and geographic information system to prospectively inform West Nile virus interventions. J Am Mosq Control Assoc 27:315-319.
Kwan JL, Park BK, Carpenter TE, Ngo V, Civen R, Reisen WK. Comparison of enzootic risk measures for predicting West Nile disease, Los Angeles, California, USA, 2004-2010.2012; Emerg Infect Dis.18(8):1298-306.
Table of Contents
- About These Guidelines
- Epidemiology and Ecology
- Human Disease
- Objectives of Surveillance
- Human Surveillance
- Environmental Surveillance
- ArboNET
- Human Laboratory Diagnosis and Testing
- Non-human Laboratory Diagnosis
- Prevention and Control: Integrated Vector Management
- Prevention and Control: Community Engagement
- ›Appendix 1: Calculation and Application of a Vector Index (VI) Reflecting the Number of West Nile Virus Infected Mosquitoes in a Population
- Appendix 2: Interim Guidance for States Conducting Avian Mortality Surveillance for West Nile Virus (WNV) or Highly Pathogenic H5N1 Avian Influenza Virus