Key points
- West Nile Virus (WNV) Surveillance and Control Guidelines aim to provide state and local public health officials and mosquito control personnel with up-to-date and accurate information on the surveillance and control of WNV.
- Find information on ecology and epidemiology, surveillance, laboratory diagnosis, integrated vector management, communication, and more.
- A printable PDF version of these guidelines is available at the bottom of this page.

Scope
In the more than 20 years since West Nile virus (WNV) was first detected in New York City, knowledge about WNV epidemiology and transmission ecology has greatly expanded. The objective of this guidance is to consolidate this information and describe how this information can be used to better monitor WNV and mitigate its public health impact. These guidelines are meant for state and local public health officials and mosquito control personnel to aid them in the surveillance and control of WNV.
The fourth version of this guidance was produced in 2013 through a comprehensive review of the published literature related to WNV epidemiology, diagnostics, transmission ecology, environmental surveillance, and vector control. Publications were reviewed for relevance to developing operational surveillance and control programs and selected for inclusion in a draft document by a technical development group of CDC subject matter experts. Numerous stakeholder groups were requested to review the guidance. Comments and additional material provided by National Association of Vector-Borne Disease Control Officials (NAVCO), National Association of City and County Health Officials (NACCHO), Council of State and Territorial Epidemiologists (CSTE), Association of State and Territorial Health Officials (ASTHO), Association of Public Health Laboratories (APHL), and American Mosquito Control Association (AMCA) were incorporated to produce this guidance. We view the recommendations contained in these guidelines as the best that can be derived from the currently available information and will provide updates as new information about WNV epidemiology, ecology, or intervention becomes available. This current version of the guidance has been modified slightly to have them available in an online, electronic format. In general, there are very few changes to the previous guidance though updated epidemiology and references are included.
WNV surveillance and control
West Nile virus (WNV), a mosquito-transmitted member of the genus Flavivirus is the most frequent cause of arboviral disease in the continental United States and is recognized as the most widely distributed arbovirus in the world (Kramer et al. 2008). First identified in northwest Uganda in 1937 (Smithburn et al. 1940), WNV was not viewed as a public health threat until it was associated with epidemics of fever and encephalitis in the Middle East in the 1950s (Taylor et al. 1956). WNV caused only sporadic outbreaks of human disease globally until the mid-1990s, when frequent outbreaks began to occur in the Mediterranean Basin and large outbreaks in Romania and the Volga delta in southern Russia (Hayes et al. 2005).
The first domestically acquired human cases of WNV disease in the Western Hemisphere were detected in New York City in 1999 (Nash et al. 2001). WNV rapidly spread during the following years and by 2005 had established sustained transmission foci in much of the hemisphere with an overall distribution that extended from central Canada to southern Argentina (Gubler 2007).
WNV disease cases have been reported from all 48 contiguous states and two-thirds of U.S. counties. During the first 10 years after WNV was first detected in the United States in 1999, the annual incidence of neuroinvasive disease fluctuated considerably. However, during more recent years, the national incidence of neuroinvasive disease has been relatively stable at around 0.44 per 100,000 population (McDonald et al. 2021). Despite this stability, the occurrence of WNV disease cases continues to be focal and sporadic in nature when assessed at the state and county levels. Annual incidence of WNV disease is most often high in the West Central and Mountain regions, with the highest cumulative incidence of infection in the central plains states (i.e., South Dakota, Wyoming, and North Dakota) (Petersen et al. 2012, McDonald et al. 2021). The greatest disease burden occurs where areas of moderate to high incidence intersect metropolitan counties with high human population densities.
Human WNV disease cases have occurred every month of the year in the United States. However, transmission is highest in summer and early fall, with 94% of human cases reported from July through September and approximately two-thirds of cases in a 6-week period from mid-July through the end of August (McDonald et al. 2021). Weather, especially temperature, is an important modifier of WNV transmission, and has been correlated with increased incidence of human disease at regional and national scales (Soverow et al. 2009).
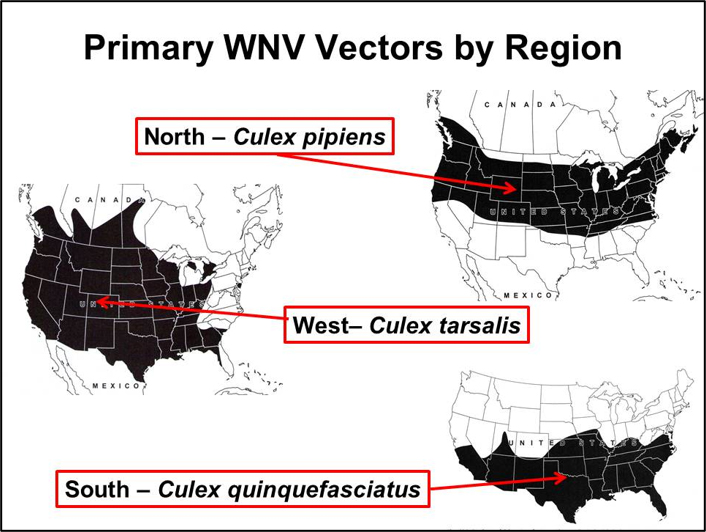
WNV is primarily maintained in an enzootic transmission cycle between Culex species mosquitoes and birds as the vertebrate hosts. Epidemic (and epizootic) transmission occurs when the virus escapes the bird-to-bird enzootic cycle to infect other vertebrates, including humans. In the US, WNV is enzootic in all 48 contiguous United States and evidence of transmission in the form of infected humans, mosquitoes, birds, horses, or other mammals has been reported from 96% of U.S. counties. Though WNV has been detected in 65 different mosquito species in the United States (CDC 2021), only a few Culex species drive epizootic and epidemic transmission. The most important vectors are Cx. pipiens in the northern states, Cx. quinquefasciatus in the southern states, and Cx. tarsalis in the western states where it overlaps with the Cx. pipiensand Cx. quinquefasciatus (Figure) (Andreadis et al. 2004, Kilpatrick et al. 2006a, Godsey et al. 2012).
Across middle latitudes of the United States, Cx. pipiens and Cx. quinquefasciatus are present both as nominal species and hybrids and are commonly reported as Cx. pipiens complex mosquitoes (Savage and Kothera 2012). Culex salinarius is an important enzootic and epidemic vector in the northeastern United States (Anderson et al. 2004, 2012, Molaei et al. 2006). Other mosquito species including Cx. restuans, Cx. nigripalpus, and Cx. stigmatosoma may contribute to early season amplification or serve as bridge vectors, feeding on both birds and mammals and potentially contributing to human infection (Kilpatrick et al. 2005).
WNV has been detected in hundreds of bird species in the United States (CDC 2021) but only a few are primary amplifiers of the virus and influence WNV transmission locally (Hamer et al. 2009). Passerine birds typically are involved in West Nile virus amplification in many locations. For example, the American robin (Turdus migratorious) can be an amplifier host even in locations where it is present in low abundance (Kilpatrick et al. 2006b). Some infected birds, especially crows and jays, are known to get sick and die from the infection.
Routes of Transmission
West Nile virus (WNV) is transmitted to humans primarily through the bite of infected mosquitoes (Campbell et al. 2002). However, person-to-person transmission can occur through transfusion of infected blood products or solid organ transplantation (Pealer et al. 2003, Iwamoto et al. 2003). Intrauterine transmission and probable transmission via human milk also have been described but appear to be uncommon (O'Leary et al. 2006, Hinckley et al. 2007). Percutaneous infection and aerosol infection have occurred in laboratory workers, and an outbreak of WNV infection among turkey handlers also raised the possibility of aerosol transmission (CDC 2002, CDC 2003a).
Since 2003, the U.S. blood supply has been routinely screened for WNV RNA; as a result, transfusion associated WNV infection is rare (CDC 2003b). The U.S. Food and Drug Administration (FDA) recommends that blood collection agencies perform WNV nucleic acid amplification test (NAAT) year-round on all blood donations, either in minipools of six or 16 donations (depending on test specifications) or as individual donations. Organ and tissue donors are not routinely screened for WNV infection though a few collection agencies have incorporated screening of donors (Nett et al. 2012, Theodoropoulos et al. 2021).
Clinical Presentation and Evaluation
An estimated 70-80% of human WNV infections are subclinical or asymptomatic (Mostashari et al. 2001, Zou et al. 2010). Most symptomatic persons experience an acute systemic febrile illness that often includes headache, myalgia, or arthralgia; gastrointestinal symptoms and a transient maculopapular rash also are commonly reported (Watson et al. 2004, Hayes et al. 2005, Zou et al. 2010). Less than 1% of infected persons develop neuroinvasive disease, which typically manifests as meningitis, encephalitis, or acute flaccid paralysis (Hayes et al. 2005). WNV meningitis is clinically indistinguishable from aseptic meningitis due to most other viruses (Sejvar and Marfin 2006). Patients with WNV encephalitis usually present with seizures, mental status changes, focal neurologic deficits, or movement disorders (Sejvar and Marfin 2006). WNV acute flaccid paralysis is often clinically and pathologically identical to poliovirus-associated poliomyelitis, with damage of anterior horn cells, and may progress to respiratory paralysis requiring mechanical ventilation (Sejvar and Marfin 2006). WNV-associated Guillain-Barré syndrome has also been reported and can be distinguished from WNV poliomyelitis by clinical manifestations and electrophysiologic testing (Sejvar and Marfin 2006). Cardiac dysrhythmias, myocarditis, rhabdomyolysis, optic neuritis, uveitis, chorioretinitis, orchitis, pancreatitis, and hepatitis have been described rarely with WNV infection (Hayes et al. 2005).
Although people of all age groups appear to be equally susceptible to WNV infection, the incidence of neuroinvasive WNV disease increases with age (McDonald et al. 2021). In addition, among patients with neuroinvasive WNV disease, older adults are more likely to develop encephalitis or meningoencephalitis and have substantially higher case-fatality rates compared with children or younger adults. Solid organ transplant recipients also are at significantly higher risk of severe illness. Severe WNV disease has been described in persons with malignancies, but the relative risk from these or other immunocompromising conditions remains unclear. Hypertension, cerebrovascular disease, chronic renal disease, alcohol abuse, and diabetes mellitus also have been identified as possible risk factors for severe WNV disease, but further research is warranted (Murray et al 2006, Lindsey et al 2012).
The differential diagnosis of arboviral central nervous system disease is broad and includes many infectious (e.g., viral, bacterial, mycoplasmal, protozoal, or mycotic) and noninfectious (e.g., toxic, metabolic, or postinfectious) causes. Other viral causes of acute neurological illness include herpes simplex, enterovirus, rabies, measles, mumps, Epstein-Barr, varicella zoster, and influenza viruses.
Arboviral surveillance consists of two distinct, but complementary activities. Epidemiological surveillance measures human disease to quantify disease burden, detect early signs of an outbreak and identify information needed for timely responses, including seasonal, geographic, and demographic patterns in human morbidity and mortality. Environmental surveillance monitors local mosquito populations, virus activity in vectors and non-human vertebrate hosts, and other relevant environmental parameters to predict human risk and prevent outbreaks of arboviral disease in humans.
In addition to monitoring disease burden and distribution, epidemiological surveillance has been instrumental in characterizing clinical disease presentation and disease outcome, as well as identifying high-risk populations and factors associated with serious disease. Epidemiological surveillance has also detected and quantified alternative routes of transmission to humans, such as contaminated blood donations and organ transplantation.
Epidemiological and environmental surveillance for arboviruses is facilitated by ArboNET, the national arbovirus surveillance system. ArboNET was developed in 2000 as a comprehensive surveillance data capture platform to monitor West Nile virus (WNV) infections in humans, mosquitoes, birds, and other animals. This comprehensive approach was essential to tracking the progression of WNV as it spread and became established across the United States, and it remains a significant source of data on the epidemiology and ecology of WNV. Since 2003, ArboNET has also collected data on other domestic and exotic arboviruses of public health significance.
In the absence of effective human vaccines for most domestic arboviruses, preventing arboviral disease in humans primarily depends on measures to keep infected vectors from biting people. A principal objective of environmental surveillance is to quantify the intensity of virus transmission in a region and provide a predictive index of human infection risk. This risk prediction, along with information about the local conditions and habitats that impact vector abundance and infection, can be used to inform an integrated vector management program and decisions about implementing interventions to control mosquitoes and prevent disease.
Though epidemiological surveillance is essential for understanding arboviral disease burden, utilizing human case surveillance by itself is insufficient for predicting outbreaks. Outbreaks can develop quickly, with most human cases occurring over a few weeks during the peak of transmission. The time from human infection to onset of symptoms to diagnosis and reporting can be several weeks or longer. As a result, human case reports typically lag well behind the transmission from vectors that initiated the infection. By monitoring infection prevalence in vectors and incidence in non-human vertebrate hosts and comparing these indices to historical environmental and epidemiological surveillance data, conditions associated with increasing human risk can be detected 2-4 weeks in advance of human disease onset. This provides additional lead time for critical vector control interventions and public education programs to be put in place. The following sections describe the elements of epidemiological and environmental arboviral surveillance and how they may be used to monitor and predict risk and to trigger interventions.
Passive Surveillance and Case Investigation
Arboviral diseases are nationally notifiable conditions and many are explicitly reportable U.S. states and territories. Most disease cases are reported to public health authorities from public health or commercial laboratories; healthcare providers can also directly submit reports of suspected cases. State and local health departments are responsible for ensuring that reported human disease cases meet the national case definitions. The most recent case definitions for arboviral diseases can be found on the CDC Nationally Notifiable Disease Surveillance System website (https://ndc.services.cdc.gov/case-definitions/). For some arboviruses (e.g., West Nile and Zika viruses) presumptive viremic donors are identified through universal screening of the blood supply; case definitions and reporting practices for viremic donors vary by jurisdiction and blood services agency.
All identified human disease cases and presumptive viremic blood donors should be investigated promptly. Jurisdictions may choose to interview the patient's healthcare provider, the patient, or both depending on information needs and resources. Whenever possible, the following information should be gathered:
- Basic demographic information (age, sex, race/ethnicity, state and county of residence)
- Clinical syndrome (e.g., asymptomatic blood donor, uncomplicated fever, meningitis, encephalitis, acute flaccid paralysis)
- Illness onset date and/or date of blood donation
- If the patient was hospitalized and if he/she survived or died
- Travel history in the four weeks prior to onset
- If the patient was an organ donor or a transplant recipient in the 4 weeks prior to onset
- If the patient was a blood donor or blood transfusion recipient in the 4 weeks prior to onset
- If the patient was pregnant at illness onset
- If the patient is an infant, was he/she breastfed before illness onset
If the patient donated blood, tissues or organs in the 4 weeks prior to illness onset, immediately inform the blood or tissue bank and appropriate public health authorities. Similarly, any infections temporally associated with blood transfusion or organ transplantation should be reported. Prompt reporting of these cases will facilitate the identification and quarantine of any remaining infected products and the identification of any other exposed recipients so they may be managed appropriately.
Passive surveillance systems are dependent on clinicians considering the diagnosis of an arboviral disease and obtaining the appropriate diagnostic test and reporting of laboratory-confirmed cases to public health authorities. Because of incomplete diagnosis and reporting, the incidence of arboviral diseases is underestimated. Where applicable, reported neuroinvasive disease cases are considered the most accurate indicator of activity in humans because of the substantial associated morbidity. In contrast, reported cases of non-neuroinvasive disease are more likely to be affected by disease awareness and healthcare-seeking behavior in different communities and by the availability and specificity of laboratory tests performed.
Enhanced Surveillance Activities
Enhanced surveillance for human arboviral disease cases should be considered when environmental or human surveillance suggests that an outbreak is suspected or anticipated. Educating healthcare providers and infection control nurses about the need for arbovirus testing and reporting of all suspected cases could increase the sensitivity of the surveillance system. This might be accomplished by distributing print materials, participating in local hospital meetings and grand rounds, and providing lectures/seminars. Public health agencies should also work to establish guidelines and protocols with local blood collection agencies for reporting viremic blood donors. At the end of the year, an active review of medical records and laboratory results from local hospitals and associated commercial laboratories should be conducted to identify any previously unreported cases. In addition, an active review of appropriate records from blood collection agencies could be conducted to identify any positive donors that were not reported.
Vector-based Surveillance
Vector surveillance is an integral component of an Integrated Vector Management (IVM) program and is the primary tool for quantifying virus transmission and human risk. The principal functions of a mosquito-based surveillance program are to:
- Collect data on mosquito population abundance and virus infection rates in those populations.
- Provide indicators of the threat of human infection and identify geographic areas of high-risk.
- Support decisions regarding the need for and timing of intervention activities (e.g. enhanced vector surveillance and control, use of new technologies and public education programs).
- Monitor the effectiveness of vector control methods, including susceptibility of target mosquitoes to control methods used.
Mosquito-based arboviral monitoring complements disease surveillance programs by contributing fast results and data for action. Programs maintaining in-house laboratories can process mosquito samples daily, giving results within a few days. Data on vector species community composition, relative abundance, and infection rates allow programs to rapidly compute infection indices, assess risk and respond. Maintaining mosquito surveillance over the long-term provides a baseline of historical data to evaluate risk and guide mosquito control operations. However, the utility of mosquito-based surveillance depends both on the type and quality of data collected (e.g., number and type of traps, timing and frequency of sampling, testing procedures) and consistent effort across transmission seasons to link surveillance indices with human risk.
There are three main categories of vector surveillance: larval, adult, and transmission activity. Together, this information is used to determine where and when control efforts should be implemented. Larval surveillance involves sampling a wide range of aquatic habitats to identify the sources of vector mosquitoes and evaluating larval control measures applied. For adult mosquitoes, regular (e.g. monthly, weekly) sampling is done at fixed sites throughout the community that are representative of the habitat types present in the area. Adult mosquitoes are collected using a variety of trapping techniques, including traps for host-seeking, resting, or gravid (carrying eggs) mosquitoes seeking a place to lay eggs (oviposition site).
Specimen Collection and Traps
Light traps collect a wide range of mosquito species (McCardle et al. 2004), providing information about both primary and secondary vectors and a better understanding of the species composition in an area. The three major WNV and St. Louis encephalitis vectors (Cx. pipiens, Cx. quinquefasciatus, and Cx. tarsalis) can be collected in light traps. However, light traps may collect fewer Cx. pipiens or Cx. quinquefasciatus resulting in small sample sizes and less accurate estimates of WNV infection rates.
CDC miniature light traps (Sudia and Chamberlain 1962) are lightweight and use batteries to provide power to a light source and fan motor. CO2 (usually dry ice) is frequently used as an additional attractant. Light traps have several considerations:
- Collections may consist largely of unfed, nulliparous individuals, which greatly reduces the likelihood of detecting WNV and other arboviruses.
- Not all mosquito species are attracted to light traps and the numbers captured may not reflect the population size of a particular species.
- For day-time active mosquitoes other trapping methods should be considered (CDC 2016).
Gravid traps can be useful for sampling Cx. pipiens and Cx. quinquefasciatus, particularly in urban areas (Andreadis and Armstrong 2007, Reisen et al. 1999). Because gravid females have previously taken a blood meal, this increases the likelihood of capturing infected mosquitoes and detecting virus. Gravid traps can be baited with attractants such as fresh or dry grass clipping infusions, rabbit chow infusions, cow manure, fish oil, or other materials that mimic the stagnant water in habitats where these species lay eggs. These vary in attractiveness depending on the type of infusion and its preparation (Burkett et al. 2004, Lampman et al. 1996). Gravid traps mainly capture mosquitoes in the Cx. pipiens complex, and therefore provide limited information on overall species composition within a region (Reiter et al. 1986).
Collecting resting mosquitoes provides a good representation of vector population structure and underlying WNV infection rates, since unfed, gravid, and blood-fed females (as well as males) may be collected. Resting mosquitoes can be collected using suction traps such as the CDC resting trap (Panella et al. 2011), and by using handheld or backpack mechanical aspirators (Nasci 1981) to remove mosquitoes from natural resting harborages or artificial resting structures (e.g., wooden resting boxes, red boxes, fiber pots, and other similar containers). Because of the wide variety of resting sites and the low density of resting mosquitoes in most locations, sampling resting populations is labor intensive and sufficient sample sizes are often difficult to obtain.
Host-baited traps, often employing chickens or pigeons as bait, can collect large numbers of mosquitoes of interest. However, these methods require live animals and adherence to animal use requirements and permitting. The bait species and variations in individual host attractiveness can impact trap performance. These traps target host-seeking mosquitoes and therefore collect mainly unfed, nulliparous individuals.
Human landing collections may expose collectors to infected mosquitoes and are not recommended as a sampling procedure in areas where WNV transmission is occurring.
Specimen Handling and Processing
Since mosquito-based surveillance relies on identifying virus in the collected mosquitoes through detection of viral proteins, viral RNA, or live virus (see Laboratory Diagnosis and Testing section), specimens should be handled in a way that minimizes exposure to conditions (e.g., heat, successive freeze-thaw cycles) that would degrade the virus. Optimally, a cold chain should be maintained from the time mosquitoes are removed from the traps to the time they are delivered to the processing laboratory. Mosquitoes can be transported from the field in a cooler with cold packs or on dry ice, and then placed on a chill-table, if available, during sorting identification, and pooling. Usually only female mosquitoes are tested in routine arboviral surveillance programs. If virus screening is not done immediately after mosquito identification and pooling, the pooled samples should be stored frozen (e.g. -70°C) or at temperatures below freezing for short-term storage. Lack of a cold chain does not appear to reduce the ability to detect viral RNA by reverse transcription polymerase chain reaction (RT-PCR) for WNV (Turell et al. 2002).
Vector-based Surveillance Indicators
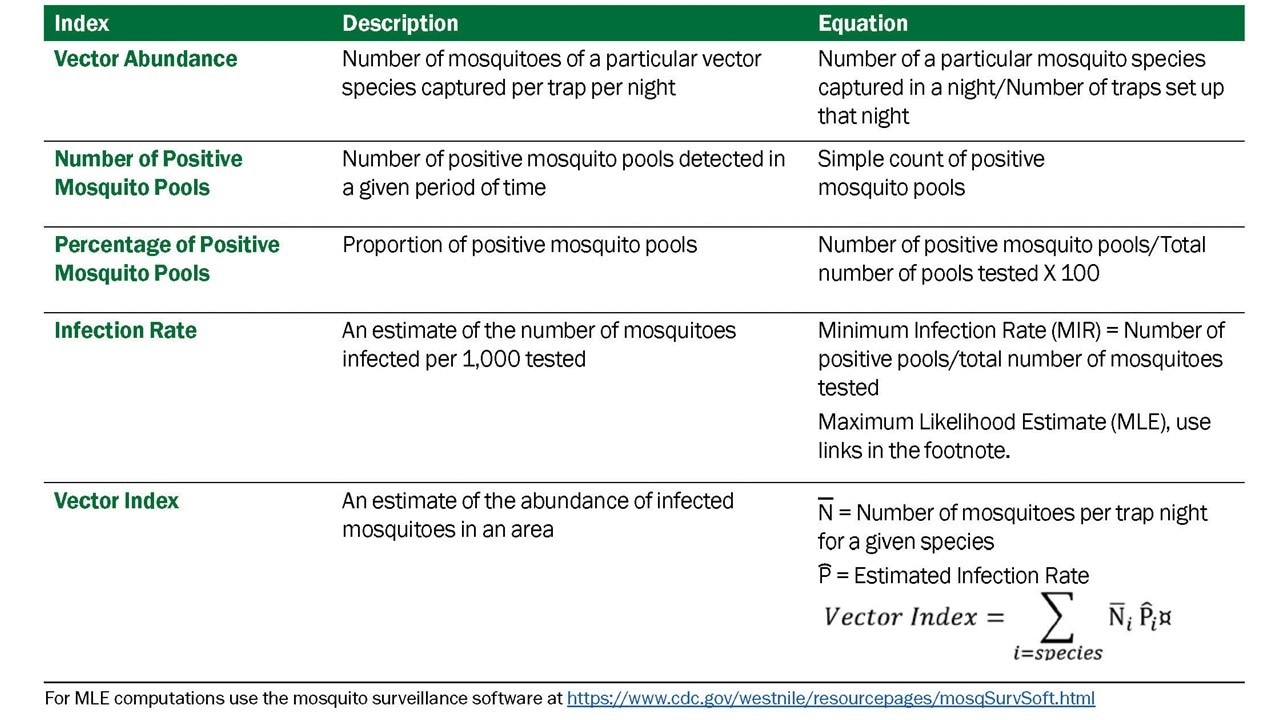
Data derived from mosquito surveillance include estimates of mosquito species abundance and infection rate in those mosquito populations. The indices derived from those data vary in information content, ability to be compared over time and space, and association with transmission levels and levels of human risk. Five indicators that have commonly been used: vector abundance, number of positive pools, percent of pools positive, infection rate, and vector index. (Table 3.1)
- Vector abundance provides a measure of the relative number of mosquitoes in an area during a particular sampling period. It is the total number of mosquitoes of a particular species collected, divided by the number of trapping nights during a specified sampling period, and is expressed as the number/trap night. Risk assessments often consider mosquito abundance because high mosquito densities can be associated with arboviral disease outbreaks (Olson et al. 1979, Eldridge 2004). For example, during a WNV outbreak in Maricopa County, Ariz., 2010, Cx. quinquefasciatus densities were higher in outbreak compared to non-outbreak areas (Godsey et al. 2012, Colborn et al. 2013). However, high mosquito abundance can occur in the absence of virus and outbreaks can occur when abundance is low, but the vector infection rate is high. Vector abundance measures are also used for planning IVM and monitoring the outcomes of mosquito control. Number of traps, their distribution, and the timing of sample collection should be sufficient to obtain spatially and temporally representative data.
- Number of positive pools is the total of the number of arbovirus positive mosquito pools detected in a given surveillance location and period. These may be a tally of the total positive pools separated by species or for all species tested. This indicator provides evidence of WNV activity but is not recommended as a stand-alone indicator. Instead, data can be used to produce more informative indices (i.e., Infection Rate and Vector Index).
- Percent of pools positive is calculated by the number of positive pools divided by the total number of pools tested, as a percentage. It provides a rough estimate of the rate of infection and can be used to compare activity over time and place. However, the comparative value is limited unless the number of pools tested is large and the number of mosquitoes per pool remains constant. As with the number of positive pools index, these data can be used for the (more informative) Infection Rate and Vector Index.
- The Infection Rate in a vector population estimates the prevalence of infected mosquitoes in the population and is a good indicator of human risk. It provides a useful, quantitative basis for comparison, allowing evaluation of changes in infection rate over time and space. Infection rate indices have been used successfully to link infection rates with human risk (Bell et al. 2005). Variable pool numbers and pool sizes can be used, while retaining comparability, but larger sample sizes improve accuracy. Two methods are commonly used to calculate infection rate:
- Minimum infection rate (MIR) for a given mosquito species is the number of positive pools divided by the total number of mosquitoes tested. MIR assumes that infection rates are low and that only one mosquito is positive in a positive pool. MIR is usually expressed as the number infected/1000 tested. It can also be expressed as a proportion or percent positive.
- Maximum likelihood estimate (MLE) is the preferred method, particularly during outbreaks. MLE does not assume only one positive mosquito per positive pool and provides a more accurate estimate when infection rates are high (Gu et al. 2008). The MLE and MIR are similar when infection rates are low. The MLE requires more complex calculations than the MIR; however, both an R package and a Microsoft Excel Add-in are available to compute infection rate estimates from pooled data.
- The Vector Index (VI) estimates the abundance of infected mosquitoes in an area and incorporates into a single index information on presence, relative abundance, and infection rates of individual species (Gujral et al. 2007, Bolling et al. 2009, Jones et al. 2011). The VI is calculated by multiplying the average number of mosquitoes collected per trap night by the proportion infected. VI is expressed as the average number of infected mosquitoes collected per trap night in the area during the sampling period. In areas with multiple vector species, a VI is calculated for each species. Individual VIs are summed to give a combined estimate of infected vector abundance.
- Increases in VI reflect increased risk of human disease and are more reliable prediction measures than vector abundance or infection rate alone (Bolling et al. 2009, Jones et al. 2011, Kwan et al. 2012, Colborn et al. 2013). As with other surveillance indicators, the accuracy of the VI depends on the number of trap nights used to estimate abundance and the number of specimens tested to estimate infection rate. Instructions for calculating the VI in a system with multiple vector species are in Appendix 1.
Use of Vector-based Surveillance Indicators
Mosquito-based surveillance indicators have two important roles in arboviral surveillance and response programs. First, they can provide quantifiable thresholds for proactive vector control efforts. By identifying thresholds for vector abundance and infection rate that are below levels associated with disease outbreaks, IVM programs can institute proactive measures to maintain mosquito populations at levels below which virus amplification can occur. Second, if thresholds related to outbreak levels of transmission can be identified, surveillance can help determine when proactive measures were insufficient to dampen virus amplification and more aggressive measures, such as wide-scale aerial application of mosquito adulticides and expanded public messaging, are needed to stop an outbreak.
Animal surveillance
Bird-based Surveillance
WNV amplifies in nature by replicating to high levels in a variety of bird species (326 affected species reported to ArboNET through 2016; CDC 2016), which then transmit the virus to mosquitoes during several days of sustained high-level viremia. In addition to infection from mosquito bites, some birds are infected by consuming infected prey (insects, small mammals, other birds) or in rare cases, from direct contact with other infected birds. A hallmark of the North American strain of WNV is its propensity to kill many birds it infects. Corvids (species of the family Corvidae, including crows, ravens, magpies, and jays) and other select species are particularly susceptible (Komar 2003). Avian morbidity/mortality surveillance and monitoring infections in wild or captive birds are strategies used to determine WNV activity and can provide a quantitative index of risk for human infection.
Avian Morbidity/Mortality Surveillance
Dead bird reporting systems collect broad information about the temporal and spatial patterns of bird deaths in an area and provide insight into WNV activity. Public participation is essential and must be encouraged through an effective public education and outreach program. A system for carcass reporting should be established including a database to record and analyze dead bird sightings with the following suggested data: caller identification and call-back number, date observed, location geocoded to the highest feasible resolution, species, and condition. A subset of the reported bird deaths can be investigated to confirm WNV activity. Birds in good condition (not scavenged and without obvious decomposition or maggot infestation) may be sampled or retrieved for laboratory testing (see Avian morbidity/mortality testing). Dead bird reporting systems provide a wide surveillance net extending to any area where a person is present to observe a dead bird. These systems have been used with success to estimate risk of human infection (Eidson et al. 2001a, Mostashari et al. 2003, Carney et al. 2011).
There are several limitations to dead bird surveillance systems. Maintaining public interest and willingness to participate is essential to these programs but is difficult to maintain. The surveillance is passive and qualitative and can only be used to assess risk of infection to people in areas where sufficient data are collected to populate risk models such as DYCAST (Carney et al. 2011) and SaTScan (Mostashari et al. 2003). Over time, bird populations can become resistant to morbidity and mortality (Reed et al. 2009), compromising the utility of this surveillance for WNV. Other causes of bird mortality could cause a false alarm for WNV activity, although this might also alert the public health and wildlife disease communities to other pathogens or health threats.
In programs where the objective of avian morbidity/mortality testing is early detection of WNV activity and not a quantitative index of human risk, testing dead birds should be initiated when local adult mosquito activity begins in the spring, and continue as long as local WNV activity is undetected in the area. Once WNV is detected in dead birds, or if vector prevention and control actions have been initiated, continued detection of WNV in carcasses in that area does not provide additional information about WNV activity and is not necessary or cost-effective. However, the number of WNV-infected dead birds can contribute to an effective human risk index (Kwan et al. 2012a).
Contact with WNV-infected carcasses presents a potential health hazard to handlers (Fonseca et al. 2005). Appropriate biosafety precautions should be taken when handling carcasses in the field and in the laboratory. More detailed guidelines for sampling avian carcasses are available in Appendix 2.
To maximize sensitivity of this surveillance system, a variety of bird species should be tested, but corvids should be emphasized if they are present (Nemeth et al. 2007a). In dead corvids and other birds, bloody pulp from immature feathers, and tissues collected at necropsy such as brain, heart, kidney, or skin harbor very high viral loads, and any of these specimen types is sufficient for sensitive detection of WNV (Panella et al. 2001, Komar et al. 2002, Docherty et al. 2004, Nemeth et al. 2009, Johnson et al. 2010). Oral swabs and breast feathers are easy specimens to collect in the field, avoid the need to transfer dead birds to the laboratory, do not require a cold chain, and are effective for detecting WNV in dead corvids (Komar et al. 2002, Nemeth et al. 2009). They are less sensitive for WNV detection in non-corvids; however, the reduced sensitivity of testing non-corvids using these tissue types can be offset by sampling more carcasses. The number of bird specimens tested will be dependent upon resources and whether WNV-infected birds have already been found in the area; triage of specimens by species or by geographic location may be appropriate in some jurisdictions.
Several studies have demonstrated the effectiveness of avian mortality testing for early detection of WNV activity (Eidson et al. 2001b, Julian et al. 2002, Guptill et al. 2003, Nemeth et al. 2007b, Patnaik et al. 2007, Kwan et al. 2012a). Wildlife rehabilitation clinics can be a good source of specimens derived from carcasses (Nemeth et al. 2007b). Collecting samples from living birds that are showing signs of illness requires the assistance of a veterinarian or wildlife technician. Dead crows and raptors alarm the public and carcasses are easily spotted. However, in regions with few or no crows, carcasses may be less obvious. Eye aspirates have been shown to be a sensitive and fast sampling protocol for WNV detection in corvid carcasses brought to the laboratory for testing (Lim et al 2009).
Live Bird Serology
The use of living birds as sentinels for monitoring WNV transmission requires serially blood-sampling a statistically valid number of avian hosts. Captive chickens, frequently referred to as sentinel chickens, (though other species have been used) provide the most convenient source of blood for this purpose. Blood may be collected from a wing vein, the jugular vein, or on Nobuto® strips by pricking the chicken's comb with a lancet. There is no standard protocol for implementing a sentinel chicken program. It can be tailored to the specific circumstances of each surveillance jurisdiction, though sentinel chicken systems generally employ flocks of 6-10 birds at each site and bleed each bird weekly or every other week throughout the WNV transmission season. Sentinel chicken-based WNV surveillance systems can provide evidence of WNV transmission several weeks in advance of human cases (Healy et al. 2012).
While serially sampling free-ranging bird species is very labor intensive, it can provide information about seroconversion in amplifier hosts, similar to the data provided by sentinel chickens. Quantifying seroprevalence in free-ranging birds may provide additional information that benefits surveillance programs (Komar 2001). For example, a serosurvey of the local resident bird population (in particular, juvenile birds) following the arbovirus transmission season may help determine which local species may be important amplifiers of WNV in the surveillance area. This in turn could be used to map areas of greatest risk in relation to the populations of amplifier hosts. Furthermore, a serosurvey of adult birds just prior to arbovirus transmission season can detect pre-existing levels of antibody in the bird population. High levels would suggest less opportunity for WNV amplification because many adult bird species transfer maternal antibodies to their offspring, which can delay or inhibit WNV amplification among the population of juvenile birds that emerges each summer. In Los Angeles, California, serosurveys of local amplifier hosts during winter determined that subsequent outbreaks occurred only after seroprevalence dipped below 10% in these birds (Kwan et al. 2012b).
There are several advantages of sentinel chicken and other live-bird serology surveillance systems. Sentinel chickens are captive, so a seroconversion event indicates local transmission and presence of infected mosquitoes in the area. Chickens do not develop clinical disease, nor do they develop viremias sufficient to infect mosquitoes (Langevin et al. 2001). Chickens are preferred blood-feeding hosts of Cx. pipiens and Cx. quinquefasciatus, which are important urban vectors of WNV. Chickens can be used to monitor seroconversions of multiple arboviruses of public health importance (i.e., WNV, SLE, WEE, and EEE viruses) simultaneously. However, there are also a number of important limitations related to these systems. Determination that a chicken has seroconverted occurs typically 3-4 weeks after the transmission event has occurred and reporting of a positive chicken may not precede the first local case of human disease caused by WNV (Patnaik et al. 2007, Kwan et al. 2010, Unlu et al. 2009). Use of sentinel birds requires institutional animal use and care protocols, and other authorization permits. Linking patterns in sentinel chicken seroconversion with human risk requires multiple years of data.
Horses and Other Vertebrates
Horses are susceptible to encephalitis due to WNV infection; thus, equine cases of WNV-induced encephalitis may serve a sentinel function in the absence of other environmental surveillance programs. Equine health is an important economic issue, so severe disease in horses comes to the attention of the veterinary community. Use of horses as sentinels for active WNV surveillance is theoretically possible, but practically infeasible. Widespread use of equine WNV vaccines decreases the incidence of equine WNV disease, and survivors of natural infections are protected from disease, reducing the usefulness of equines as sentinels. Veterinarians, veterinary service societies/agencies, and state agriculture departments are essential partners in any surveillance activities involving WNV infections in horses. Equine disease due to WNV is rare in tropical ecosystems. However, WNV frequently infects horses in the tropics. Detection of seroconversions in horses has been suggested as a sentinel system to detect risk of WNV transmission to people in Puerto Rico and other tropical locations (Phoutrides et al. 2011, Mattar et al. 2011).
Small numbers of other mammal species have been affected by WNV. Dead squirrels are tested for WNV along with dead birds in some jurisdictions. Among domestic mammals, the most important has been the camelids, such as llamas and alpacas. As with horses, these come to the attention of veterinarians and any veterinary case of disease due to WNV may be used for passive surveillance. Dogs and cats become infected with WNV. Active surveillance of WNV in dogs has been shown to predict human infection with WNV (Resnick et al. 2008). WNV disease in dogs is rare and vaccination of dogs has not been recommended or practiced. Maintaining a large number of seronegative dogs for use as sentinels would be cumbersome, but juvenile stray dogs could be used for this purpose in areas where other surveillance methods are not available. Stray dog removal programs could provide a source of samples at low cost. WNV infects cats but cats have not been evaluated as surveillance sentinels. There is no evidence that dogs or cats develop sufficient viremia to become amplifier hosts (Austgen et al. 2004).
ArboNET, the national arboviral surveillance system, was developed by CDC and state health departments in 2000 in response to the emergence of WNV in 1999. Since its development, ArboNET has expanded to include many other arboviruses of public health importance. ArboNET is an electronic surveillance system administered by CDC's Division of Vector-Borne Diseases. Human arboviral disease data are reported from all states, territories, and freely associated states. In addition to human disease cases, ArboNET maintains data on arboviral infections among human viremic blood donors, non-human mammals, sentinel animals, dead birds, and mosquitoes.
Data Collected. Variables collected for human disease cases include patient age, sex, race, and county and state of residence; date of illness onset; case status (i.e., confirmed, probable, suspected, or not a case); clinical syndrome (e.g., encephalitis, meningitis, or uncomplicated fever); whether illness resulted in hospitalization; and whether the illness was fatal. Cases reported as encephalitis (including meningoencephalitis), meningitis, or acute flaccid paralysis are collectively referred to as neuroinvasive disease; others are considered non-neuroinvasive disease. Acute flaccid paralysis can occur with or without encephalitis or meningitis. Information regarding potential non-mosquito-borne transmission (e.g., blood transfusion or organ transplant recipient, breast-fed infant, or laboratory worker) and recent donation of blood or solid organs should be reported if applicable. Clinical symptoms and diagnostic testing data can also be reported.
Blood donors identified as presumptively viremic by nucleic acid amplification test (NAAT) screening of the donation by a blood collection agency are also reported to ArboNET. Case definitions have been developed for the purposes of national surveillance. The date of blood donation is reported in addition to the variables routinely reported for disease cases.
Arboviral disease in non-human mammals (primarily horses) and infections in trapped mosquitoes, dead birds, and sentinel animals (primarily chickens) are also reported to ArboNET. Variables collected for non-human infections include species, state and county, and date of specimen collection or symptom onset. The total number of mosquitoes or birds tested weekly can also be reported by county and species.
Detailed descriptions of all variables collected by ArboNET and instructions for reporting are included in the ArboNET User Guide, which can be requested from DVBD by phone (970-261-6400) or email (dvbid2@cdc.gov).
Data Transmission. Jurisdictions can transmit data to ArboNET using one or more of four methods supported by DVBD:
- Jurisdictions that have a commercially- or state-developed electronic surveillance system can upload records from their system using an Extensible Markup Language (XML) message;
- Jurisdictions can upload records from a MicrosoftÒ Access database provided by CDC DVBD using an XML message;
- Jurisdictions may enter records manually using a CDC website (https://csams.cdc.gov/arbonet); or
- Jurisdictions can report cases using an HL-7 message via the CDC National Electronic Disease Surveillance System (NEDSS) and DVBD will download records directly from NEDSS to ArboNET. ArboNET data are maintained in a MicrosoftÒ Structured Query Language (SQL) ServerÒ database inside CDC's firewall. Users can access data via a password-protected website but are limited to viewing data only from their own jurisdiction. The ArboNET website and database are maintained by CDC information technology staff and are backed up nightly.
Dissemination of ArboNET Data. CDC epidemiologists periodically review and analyze ArboNET surveillance data and disseminate results to stakeholders via direct communication, briefs in Morbidity and Mortality Weekly Reports and Epi-X, comprehensive annual summary reports, and DVBD's website. CDC also produces maps of domestic and exotic arboviral activity, which are then posted on CDC's disease-specific websites. Surveillance reports are typically updated biweekly during the transmission season and monthly during the off-season. A final report is usually released in the spring of the following year. CDC provides limited-use ArboNET data sets to the general public by formal request. Data release guidelines have been updated to be consistent with those developed by CDC and the Council of State and Territorial Epidemiologists (CSTE).
Limitations of ArboNET Data. Human surveillance for arboviral disease is largely passive, and relies on the receipt of information from physicians, laboratories, and other reporting sources by state health departments. For viruses that can cause neuroinvasive disease, neuroinvasive disease cases are likely to be consistently reported because of the substantial morbidity associated with this clinical syndrome. In comparison, non-neuroinvasive disease cases are inconsistently reported because of a less severe spectrum of illness, geographic differences in disease awareness and healthcare seeking behavior, and variable capacity for laboratory testing. Surveillance data for fever cases associated with neuroinvasive arboviruses should be interpreted with caution and generally should not be used to make comparisons between geographic areas or over time. Accordingly, ratios of reported neuroinvasive disease cases to non-neuroinvasive disease cases should not be interpreted as a measure of virulence in an area.
ArboNET does not routinely collect information regarding clinical signs and symptoms or diagnostic laboratory test results. Therefore, misclassification of the various syndromes caused by arboviruses cannot be detected. In addition, ArboNET does not routinely collect information regarding the specific laboratory methods used to confirm each case. Although serologic assays are relatively specific, false-positive results and cross-reactions occur between related viruses (e.g., flavivirus, such as West Nile, St. Louis encephalitis, and dengue viruses, or California serogroup viruses, such as La Crosse and Jamestown Canyon viruses). Positive IgM results should be confirmed by additional tests, especially plaque-reduction neutralization. However, such confirmatory testing often is not performed. While the electronic mechanisms for data transmission allow for rapid case reporting, the inclusion of both clinical and laboratory criteria in the surveillance case definition creates delays between the occurrence of cases and their reporting. Provisional data are disseminated to allow for monitoring of regional and national epidemiology during the arboviral transmission season. However, these reports generally lag several weeks behind the occurrence of the cases comprising them, and the data may change substantially before they are finalized. For this reason, provisional data from the current transmission season should not be combined with or compared to provisional or final data from previous years.
The collection and reporting of non-human surveillance data are highly variable among states (and even between regions within states) and changes from year to year. Because of this variability, non-human surveillance data should not be used to compare arboviral activity between geographic areas or over time.
For more information about ArboNET, please contact the Division of Vector-Borne Diseases by phone: 970-261-6400 or email: dvbid2@cdc.gov.
A Laboratory Diagnosis of Human Arboviral Diseases
Laboratory testing for evidence of arboviral diseases typically involves serologic and molecular testing. For several viruses where humans are an amplifying host, molecular testing is more specific and can be used to confirm the diagnosis in the first week of illness. For viruses that typically are neuroinvasive, serology is more likely to be used to determine if someone was recently infected.
In most patients, infection with an arbovirus that can cause encephalitis is clinically inapparent or causes a nonspecific viral syndrome. Numerous pathogens cause encephalitis, aseptic meningitis, and febrile disease with similar clinical symptoms and presentations and should be considered in the differential diagnosis. Definitive diagnosis can only be made by laboratory testing using specific reagents. Selection of diagnostic test procedures should take into consideration patient factors (e.g., age, immune status, vaccination history), timing of infection, the range of pathogens in the differential diagnosis, the criteria for classifying a case as confirmed or probable, as well as the capability of the primary and confirming diagnostic laboratories.
Appropriate selection of diagnostic procedures and accurate interpretation of findings requires information describing the patient and the diagnostic specimen. For human specimens, the following data must accompany sera, CSF or tissue specimens for results to be properly interpreted and reported:
- Symptom onset date (when known);
- Date of sample collection;
- Unusual immunological status of patient (e.g., immunosuppression);
- State and county of residence;
- Travel history (especially in flavivirus-endemic areas);
- History of prior vaccination (e.g., yellow fever, Japanese encephalitis, or tick-borne encephalitis viruses); and
- Brief clinical summary including clinical diagnosis (e.g., encephalitis, aseptic meningitis).
Minimally, onset and sample collection dates are required to perform and interpret initial screening tests. The remaining information is required to evaluate any test results from initial screening. If possible, a convalescent serum sample taken at least 14 days following the acute sample should be obtained to enable confirmation by serological testing.
Human Diagnostic Testing
Serology. The front-line screening assay for laboratory diagnosis of human WNV infection is the IgM assay. Currently, the FDA has cleared three commercially available test kits from different manufacturers, for detection of WNV IgM antibodies. These kits are used in many commercial and public health laboratories in the United States. In addition, the CDC-defined IgM and IgG EIA [i.e., ELISA or microsphere-based immunoassay (MIA)] can be used (Martin et al. 2000; Johnson et al. 2000; Johnson et al. 2005). The CDC MIA can differentiate WNV from St. Louis encephalitis (SLE). Protocols are available for the CDC-developed assays from CDC's DVBD Diagnostic Laboratory (Martin et al. 2000; Johnson et al. 2000). CDC also will provide positive controls and limited reagents as commercial sources are available to state public health labs.
Because the IgM and IgG antibody tests can cross-react between flaviviruses (e.g., SLE, dengue, yellow fever, WNV, Powassan), they should be viewed as screening tests only. For a case to be considered confirmed, serum samples that are antibody-positive on initial screening should be evaluated by a more specific test; currently the plaque reduction neutralization test (PRNT) is the recommended test for differentiating between flavivirus infections. Though WNV is the most common cause of arboviral encephalitis in the United States, there are several other arboviral encephalitides present in the country and in other regions of the world. Specimens submitted for WNV testing should also be tested against other arboviruses known to be active or be present in the area or in the region where the patient traveled.
Virus Detection Assays. Numerous procedures have been developed for detecting viable WNV, WNV antigen, or WNV RNA in human diagnostic samples, many of which have been adapted to detecting WNV in other vertebrates and in mosquito samples. These procedures vary in their sensitivity, specificity, and time required to conduct the test (Table 4.1).
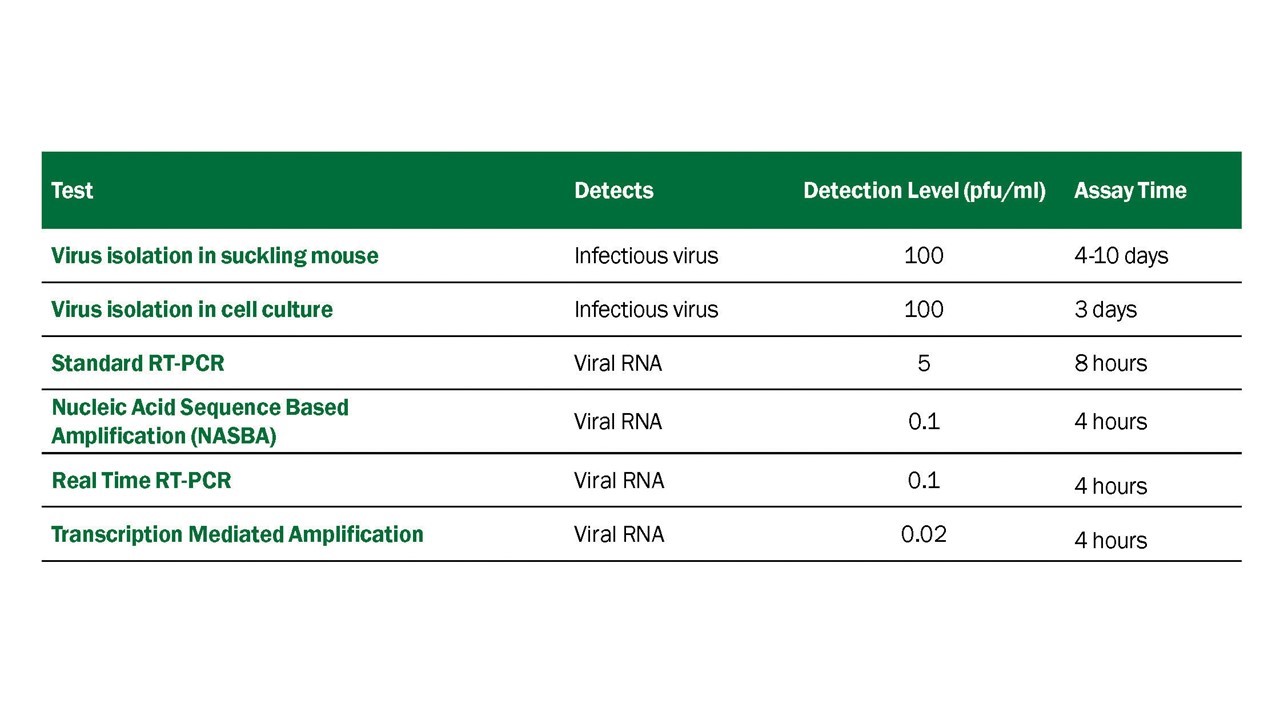
WNV presence can be demonstrated by isolation of viable virus from samples taken from clinically ill humans. Appropriate samples include CSF and serum samples obtained very early in infection, and brain tissue taken at biopsy or postmortem. Virus isolation should be performed in known susceptible mammalian (e.g., Vero) or mosquito cell lines (e.g., C6/36). However, viremia is almost always absent by the time a patient presents with neuroinvasive illness and thus viral isolation is generally not recommended as part of a testing algorithm in immune competent patients. Mosquito origin cells may not show obvious cytopathic effect and must be screened by immunofluorescence or RT-PCR. Confirmation of virus isolate identity can be accomplished by indirect immunofluorescence assay (IFA) using virus-specific monoclonal antibodies (MAbs) or nucleic acid detection (e.g. RT-PCR, real-time RT-PCR or sequencing). IFA using well-defined murine MAbs is an efficient, economical, and rapid method to identify flaviviruses isolated in cell culture. MAbs are available that can differentiate WNV and SLE virus from each other and from other flaviviruses. Incorporating MAbs specific for other arboviruses known to circulate in various regions will increase the rapid diagnostic capacities of state and local laboratories. Nucleic acid detection methods including RT-PCR, real-time and nucleic acid sequence-based amplification (NASBA) methods may be used to confirm virus isolates (Briese et al. 2000; Shi et al. 2001; Lanciotti et al. 2000).
While these tests can be quite sensitive, virus isolation and RT-PCR to detect WNV RNA in sera or CSF of clinically ill patients have limited utility in diagnosing human WNV neuroinvasive disease due to the low-level viremia present in most cases at the time of clinical presentation. Virus isolation or RT-PCR on serum may be helpful in confirming WNV infection in immunocompromised patients when antibody development is delayed or absent.
Immunohistochemistry (IHC) using virus-specific MAbs on brain tissue has been very useful in identifying human cases of WNV infection. In suspected fatal cases, IHC should be performed on formalin fixed autopsy, biopsy, and necropsy material, ideally collected from multiple anatomic regions of the brain, including the brainstem, midbrain, and cortex (Bhatnagar et al. 2007).
Resources for Human Diagnostic Laboratories
Clinical Laboratory Improvements Amendments (CLIA) certification: To maintain certification, CLIA recommendations for performing and interpreting human diagnostic tests should be followed. Laboratories performing arboviral serology or RNA-detection testing are invited to participate in the annual proficiency testing that is available from CDC's Division of Vector-Borne Diseases in Fort Collins, CO. To obtain additional information about the proficiency testing program and about training in arbovirus diagnostic procedures, contact the Division of Vector-Borne Diseases by phone: 970-261-6400 or email: dvbid2@cdc.gov.
Biocontainment: Containment specifications are available in the CDC/National Institutes of Health publication Biosafety in Microbiological and Biomedical Laboratories (BMBL 6).
Shipping of diagnostic samples and agents: Shipping and transport of clinical specimens should follow current International Air Transport Association (IATA) and Department of Commerce recommendations. For more information, visit the IATA dangerous goods Web site at: http://www.iata.org/publications/dgr/Pages/index.aspx, and the USDA Animal and Plant Health Inspection Service (APHIS), National Center for Imports and Exports website: https://www.aphis.usda.gov/aphis/ourfocus/importexport.
Laboratory Testing of Vectors
Identification and Pooling
Mosquitoes should be identified to species or lowest taxonomic unit. Specimens are placed into pools of 50 specimens or less based on species, sex, location, trap-type, and date of collection. Larger pool sizes can be used in some assays with loss of sensitivity (Sutherland and Nasci 2007). If resources are limited, testing of mosquitoes for surveillance purposes can be limited to the primary vector species.
Homogenizing and Centrifugation
After adding the appropriate media, mosquito pools can be macerated or ground by a variety of techniques including mortar and pestle, vortexing sealed tubes containing one or more copper clad BBs, or by use of tissue homogenizing apparatus that are commercially available (Savage et al. 2007). After grinding, samples are centrifuged, and an aliquot is removed for testing. Because mosquito pools may contain arboviruses and other pathogenic viruses, which may be aerosolized during processing, laboratory staff should take appropriate safety precautions including use of a Class II Type A biological safety cabinet and wearing appropriate personal protective equipment (PPE) and adhering to biosafety practices.
Virus Detection
Virus isolation in Vero cell culture remains the standard for confirmation of positive pools (Beaty et al. 1989, Savage et al. 1999, Lanciotti et al. 2000). Virus isolation provides the benefit of detecting other viruses that may be contained in the mosquitoes, a feature that is lost using test procedures that target virus-specific nucleotide sequence or proteins. However, Vero cell culture is expensive and requires specialized laboratory facilities; thus, nucleic acid assays have largely replaced virus isolation as detection and confirmatory assay methods of choice. Virus isolation requires that mosquito pools be ground in a media that protects the virus from degradation such as BA-1 (Lanciotti et al. 2000), and preservation of an aliquot at -70°C to retain virus viability for future testing.
Nucleic acid detection assays are the most sensitive assays for virus detection and confirmation of virus in mosquito pools (Lanciotti et al. 2000, Nasci et al. 2002). Real-Time RT-PCR assays with different primer sets may be used for both detection and confirmation of virus in mosquito pools. Standard RT-PCR primers are also available (Kuno et al 1998). Nucleic acids may be extracted from an aliquot of the mosquito pool homogenate by hand using traditional methods or with kits, or with automated robots in high-through-put laboratories (Savage et al 2007).
Virus antigen detection assays are available in ELISA format (Tsai et al. 1987, Hunt et al. 2002) and in commercial kits that employ lateral flow wicking assays, developed specifically for testing mosquitoes (Komar et al. 2002, Panella et al. 2001, Burkhalter et al. 2006). The antigen capture ELISA of Hunt et al. 2002 and the RAMP (Rapid Analyte Measurement Platform, Response Biomedical Corp, Burnaby, British Columbia, Canada) test are approximately equal in sensitivity and detect virus in mosquito pools at concentrations as low as 103.1 PFU/ml (Burkhalter et al. 2006). The VecTest (Medical Analysis Systems, Inc., Camarillo, CA) is less sensitive and detects virus in mosquito pools at concentrations of 105.17 PFU/ml. The VecTest (evaluated by Burkhalter et al. 2006) is no longer available but is similar to a lateral flow wicking assay marketed as VecTOR Test (VecTOR Test Systems, Inc., Thousand Oaks, CA). Although the antigen detection assays are less sensitive than nucleic acid detection assays, they have been evaluated in operational surveillance programs (Mackay et al. 2008. Lampman et al. 2006. Williges et al. 2009, Kesavaraju et al. 2012) and can provide valuable infection rate data when employed consistently in a mosquito surveillance program.
Laboratory Testing of Non-human Vertebrates
Serology
Diagnostic kits for serologic diagnosis of WNV infection in clinically ill domestic animals are not commercially available. IgM-capture ELISA has been developed for use in horses and can be readily adapted to other animal species where anti-IgM antibody reagents are commercially available. Alternatively, seroconversion for IgG, neutralizing antibodies, and haemagglutinin inhibiting (HAI) assays in acute and convalescent serum samples collected 2-3 weeks apart can be used as screening assays. The latter two approaches do not require species-specific reagents and thus have broad applicability. The ELISA format may be used when employed as inhibition or competition ELISAs, which avoids the use of species-specific reagents. A popular blocking ELISA has been applied to a variety of vertebrate species with very high specificity and sensitivity, reducing the necessity of a second confirmatory test (Blitvich et al 2003a, 2003b). Similarly, the microsphere immunoassay, when used comparatively with WNV antigen-coated beads and St. Louis encephalitis virus (SLEV) antigen-coated beads, performs with high specificity and sensitivity (Johnson et al. 2005). Typically, a confirmatory 90% plaque-reduction neutralization test (PRNT90) with end-point titration is used to confirm serology in non-human vertebrates. Plaque-reduction thresholds below 80% are not recommended. Because of the cross-reactive potential of anti-flavivirus antibodies, the PRNT must be comparative, performed simultaneously with SLEV.
PRNTs require the use of a biosafety cabinet within a containment laboratory utilizing Vero cell culture. As of 2020, WNV was recommended in the Biosafety in Microbiological and Biomedical Laboratories (BMBL 6) to be handled under BSL-2 standards. Modification to the standard PRNT using a recombinant chimeric virus featuring the WNV envelope glycoprotein gene in a yellow fever virus backbone (Chimeravax, originally developed as a live-attenuated vaccine candidate) can be used for an increased safety profile for lab staff. For PRNTs, the Chimeravax provided equivalent results for bird sera, and 10-100 fold lower titers for equine sera (Komar et al. 2009).
The same serologic techniques applied to clinically ill animals may also be used for healthy subjects for vertebrate serosurveys or for healthy sentinel animals serially sampled as sentinels. Serologic techniques for WNV diagnosis should not be applied to carcasses, as in many cases of fatal WNV infection, the host will die before a detectable immune response develops. Furthermore, some morbid or moribund animals that have WNV antibodies due to past infection may be currently infected with a pathogen other than WNV. Fatal cases should have readily detectable WNV in their tissues.
As with human diagnostic samples, serologic results from non-human vertebrates must be interpreted with caution and with an understanding of the cross-reactive tendencies of WNV and other flaviviruses. For primary WNV infections, a low rate of cross-reactivity is expected (<5%) and misdiagnoses are avoided by the requirement that the reciprocal anti-WNV titer be a minimum of 4-fold greater than the corresponding anti-SLEV titer. In rare cases, a secondary flavivirus infection due to WNV in a host with a history of SLEV infection may boost the older anti-SLEV titer to greater levels than the anti-WNV titer, resulting in a misdiagnosis of SLEV infection, a phenomenon known as "original antigenic sin". Some serum samples will have endpoint titers for WNV and SLEV that are the same or just 2-fold different. While it is possible that this serologic result is due to past infections with both of these viruses, it is impossible to rule out cross-reaction from one or the other, or even from a third indeterminate flavivirus. Such a result should be presented as "undifferentiated flavivirus infection."
Virus Detection
Methods for WNV detection, isolation, and identification are the same as described for human and mosquito diagnostics. Specimens typically used are tissues and/or fluids from acutely ill and/or dead animals. Virus detection in apparently healthy animals is very low-yield and inefficient, and therefore not cost-effective, and should not be considered for routine surveillance programs. In bird, mammal, and reptile carcasses, tissue tropisms have varied among individuals within a species, and across species. Some animals, like humans, have few tissues with detectable virus particles or viral RNA at necropsy, such as horses. Others, such as certain bird species, may have fulminant infections with high viral loads in almost every tissue.
Integrated Vector Management
Prevention and control of arboviral diseases is accomplished most effectively through a comprehensive, integrated vector management (IVM) program applying the principles of integrated pest management. IVM is based on an understanding of the underlying biology of the arbovirus transmission system and utilizes regular monitoring of vector mosquito populations and arboviral activity levels to determine if, when, and where interventions are needed to keep mosquito numbers below levels which produce risk of human disease, and to respond appropriately to reduce risk when it exceeds acceptable levels.
Operationally, IVM is anchored by a monitoring program providing data that describe:
- Conditions and habitats that produce vector mosquitoes;
- Abundance of those mosquitoes over the course of a season;
- Arboviral transmission activity levels expressed as infection rate in mosquito vectors;
- Parameters that influence local mosquito populations and virus transmission.
These data inform decisions about implementing mosquito control activities appropriate to the situation, such as:
- Source reduction through habitat modification;
- Larval mosquito control using the appropriate methods for the habitat;
- Adult mosquito control using pesticides applied from trucks or aircraft when established thresholds have been exceeded;
- Community education efforts related to risk levels and intervention activities.
Monitoring also provides quality control for the program, allowing evaluation of the effectiveness of larval and adult control efforts, and causes of control failures (e.g., undetected larval sources, pesticide resistance, equipment failure).
Mosquito Control Activities
Guided by the surveillance elements of the program, integrated efforts to control mosquitoes are implemented to maintain vector populations below thresholds that would facilitate virus amplification and increase human risk (Table 5.1) (Nasci and Mutebi, 2019).
Larval Mosquito Control
The objective of the larval mosquito control component of an IVM program is to manage mosquito populations before they emerge as adults. This can be an efficient method if the mosquito breeding sites are accessible. However, larval control may not attain the levels of mosquito population reduction needed to maintain risk at low levels and must be accompanied by measures to control the adult mosquito populations as well. In outbreak situations, larval control complements adult mosquito control measures by preventing new vector mosquitoes from being produced. However, larval control alone is not able to stop outbreaks once virus amplification has reached levels causing human infections.
Numerous methods are available for controlling larval mosquitoes. Source reduction is the elimination or removal of habitats that produce mosquitoes. This can range from draining roadside ditches to properly disposing of discarded tires and other trash containers. Only through a thorough surveillance program will mosquito sources be identified and appropriately removed. In order to effectively control vector mosquito populations through source reduction, all sites capable of producing vector mosquitoes must be identified and routinely inspected for the presence of mosquito larvae or pupae. This is difficult to accomplish with the vector species Cx. quinquefasciatus and Cx. pipiens that readily utilize cryptic sites such as storm drainage systems, grey water storage cisterns, and storm water runoff impoundments. Vacant housing with unmaintained swimming pools, ponds and similar water features are difficult to identify and contribute a significant number of adult mosquitoes to local populations.
To manage mosquitoes produced in habitats that are not conducive to source reduction, pesticides registered by EPA for larval mosquito control are applied when larvae are detected. No single larvicide product will work effectively in every habitat where vectors are found. Information about pesticides used for larval mosquito control is available from the U.S. EPA (https://www.epa.gov/mosquitocontrol/controlling-mosquitoes-larval-stage). Pesticides should always be used according to their label instructions by field staff trained to identify larval production sites and safely implement the appropriate management tools for that site.
Adult Mosquito Control
Source reduction and larvicide treatments may be inadequate to maintain vector populations at levels sufficiently low to limit virus amplification. The objective of the adult mosquito control component of an IVM program is to complement the larval management program by reducing the abundance of adult mosquitoes in an area, thereby reducing the number of eggs laid in breeding sites. Adult mosquito control is also intended to reduce the abundance of biting, infected adult mosquitoes in order to prevent them from transmitting virus to humans and to break the mosquito-bird transmission cycle.
In situations where vector abundance is increasing above acceptable levels, targeted adulticide applications using pesticides registered by EPA for this purpose can assist in maintaining vector abundance below threshold levels. More detailed information about pesticides used for adult mosquito control is available from the U.S. EPA (https://www.epa.gov/mosquitocontrol/controlling-adult-mosquitoes).
Pesticides for adult mosquito control can be applied from hand-held application devices, from trucks or aircrafts. Hand-held or truck-based applications are useful to manage relatively small areas but are limited in their capacity to treat large areas quickly during an outbreak. Gaps in coverage may occur during truck-based applications due to limitations of the road infrastructure. Aerial application of mosquito control adulticides is used when large areas must be treated quickly. Aerial spraying can be particularly valuable to control Cx. quinquefasciatus or Cx. pipiens which require multiple, closely timed treatments. Both truck and aerially-applied pesticides are applied using ultra-low-volume (ULV) technology in which a very small volume of pesticide is applied per acre in an aerosol of minute droplets designed to contain sufficient pesticide to kill mosquitoes that are contacted by the droplets. Information describing ULV spray technology and the factors affecting effectiveness of ground and aerially applied ULV pesticides is reviewed in Mount et al. 1996, Mount 1998, and Bonds 2012.
Vector Management in Public Health Emergencies
Intensive early season adult mosquito control efforts can decrease viral transmission activity and result in reduced human risk (Lothrop et al. 2008). However, depending on local conditions, proactive vector management may not maintain mosquito populations at levels sufficiently low to avoid development of outbreaks. As evidence of sustained or intensified virus transmission in a region increases, emergency vector control efforts to reduce the abundance of infected, biting adult mosquitoes must be implemented. This is particularly important in areas where vector surveillance indicates that infection rates in mosquitoes are continually increasing or being sustained at high levels and evidence of infection found in other species (e.g., human or non-human mammal cases). Delaying adulticide applications until numerous human cases occur negates the value and purpose of the surveillance system. Timely application of adulticides interrupts arboviral transmission and prevents human cases (Carney et al. 2008).
Safety and Quality of Vector Control Pesticides and Practices
Insecticides to control larval and adult mosquitoes are registered specifically for that use by the U.S. Environmental Protection Agency (EPA). Instructions provided on the product labels prescribe the required application and use parameters and must be carefully followed. Properly applied, these products do not negatively affect human health or the environment. In persons living in treated areas, ULV application of mosquito control adulticides does not produce any detectable biological changes indicating exposure (Currier et al. 2005, Duprey et al. 2008) or increase asthma or other adverse health events (Karpati et al. 2004). The risks from arboviruses demonstrably exceed the risks from mosquito control practices (Davis and Peterson 2008, Macedo et al. 2010, Peterson et al. 2006).
Legal Action to Achieve Access or Control
Individually owned private properties may be major sources of mosquito production. Examples include accumulations of discarded tires or other trash, neglected swimming pools, and similar water features that become stagnant and produce mosquitoes. Local public health statutes or public nuisance regulations may be employed to gain access for surveillance and control, or to require the property owner to mitigate the problem. Executing such legal actions may be a prolonged process during which adult mosquitoes are continuously produced. Proactive communication with residents and public education programs may alleviate the need to use legal actions. However, legal efforts may be required to eliminate persistent mosquito production sites.
Quality of Control
Pesticide products and application procedures (for both larval and adult control) must periodically be evaluated to ensure an effective rate of application is being used and that the desired degree of control is obtained. Application procedures should be evaluated regularly (minimally once each season) to assure equipment is functioning properly to deliver the correct dosages and droplet parameters and to determine appropriate label rates to use locally. Finally, mosquito populations should routinely be evaluated to ensure insecticide resistance is not emerging.
Records
Surveillance data describing vector sources, abundance and infection rates, records of control efforts (e.g., source reduction, larvicide applications, adulticide applications), and quality control data must be maintained and used to evaluate IVM needs and performance. Long-term data are essential to track trends and to evaluate levels of risk.
Insecticide Resistance Management
For vector control to be effective, mosquitoes must be susceptible to the insecticide selected for use. In order to delay or prevent the development of insecticide resistance in vector populations, IVM programs should include a resistance management component (Florida Coordinating Council on Mosquito Control 1998). This should include routine monitoring of the status of resistance in the target populations to:
- Provide baseline data for program planning and pesticide selection before the start of control operations;
- Detect resistance at an early stage so that timely management can be implemented;
- Continuously monitor the effect of control strategies on insecticide resistance, and determine potential causes for control failures, should they occur.
Insecticide resistance may be monitored using bioassays in larvae or adult mosquitoes (Brogden and McAllister 1998). The CDC bottle bioassay is a simple, rapid, and economical tool to detect insecticide resistance by determining the time taken for a pesticide active ingredient to kill mosquito vectors. The results can help guide the choice of insecticide used for spraying. The CDC bottle bioassay can be used as part of a broader insecticide resistance monitoring program, which may include field cage tests and biochemical and molecular methods. Download a practical laboratory manual for the CDC bottle bioassay. For additional information contact CDC at USBottleAssayKit@cdc.gov.
The IVM program should include options for managing resistance that are appropriate for the local conditions. The techniques regularly used include the following:
- Management by moderation. Preventing onset of resistance by reducing overall chemical use or persistence by:
- Using dosages no lower than the lowest label rate to avoid genetic selection;
- Using chemicals of short environmental persistence and avoiding slow-release formulations that increase selection for resistance;
- Avoiding use of the same class of insecticide to control adult and immature stages;
- Applying locally:many districts treat only hot spots and use area-wide treatments only during public health alerts or outbreaks;
- Using less frequent applications; leaving generations, population segments,or areas untreated (when appropriate);
- Establishing higher thresholds for mosquito mitigation with insecticides, except during public health alerts or outbreaks.
- Management by continued suppression. This strategy is used in regions of high value or persistent high risk (e.g., heavily populated regions or locations with recurring WNV outbreaks) where mosquitoes must be kept at very low densities. It involves the application of dosages within label rates but sufficiently high to be lethal to heterozygous individuals that are partially resistant. If the heterozygous individuals are killed, resistance will be slow to emerge. This method should not be used if any significant portion of the population in question is fully resistant. Another approach more commonly used is the addition of synergists that inhibit existing detoxification enzymes and thus eliminate the competitive advantage of these individuals. Commonly, the synergist of choice in mosquito control is piperonyl butoxide (PBO).
- Management by multiple attack. This strategy involves the use of insecticides with different modes of action in mixtures or in rotations. There are economic limitations associated with this approach (e.g., costs and logistics of switching or storing chemicals), and critical variables in addition to the pesticide mode of action that must be taken into consideration (i.e., mode of resistance inheritance, frequency of mutations, population dynamics of the target species, availability of refuges, and migration). Programs should evaluate resistance patterns routinely and the need for rotating insecticides at annual or longer intervals.
Continuing Education
Continuing education for operational vector control workers is required to instill or refresh knowledge related to practical mosquito control. Training focusses on safety, applied technology, and requirements for the regulated certification program mandated by most states. Training should also include information on the identification of mosquito species, their behavior, ecology, and appropriate methods of control.
Guidelines for a Phased Response
The objective of a phased response to WNV surveillance data is to implement public health interventions appropriate to the level of WNV risk in a community (Table 5.1). A surveillance program adequate to monitor WNV activity levels associated with human risk must be in place in order to provide detection of epizootic transmission in advance of human disease outbreaks. The surveillance programs and environmental surveillance indicators described above demonstrate that enzootic/epizootic WNV transmission can be detected several weeks before the onset of human disease, allowing for implementation of effective interventions (Bolling et al. 2009, Jones et al. 2011, Mostashari et al. 2003, Unlu et al. 2009).
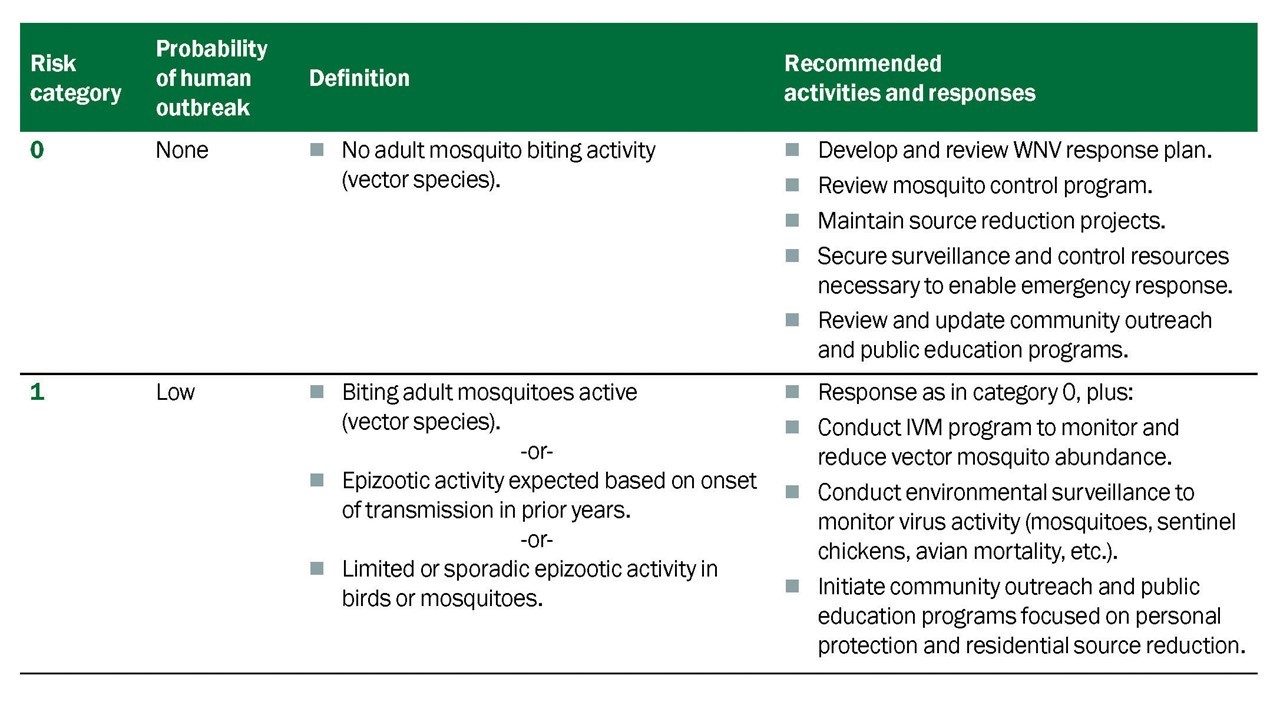
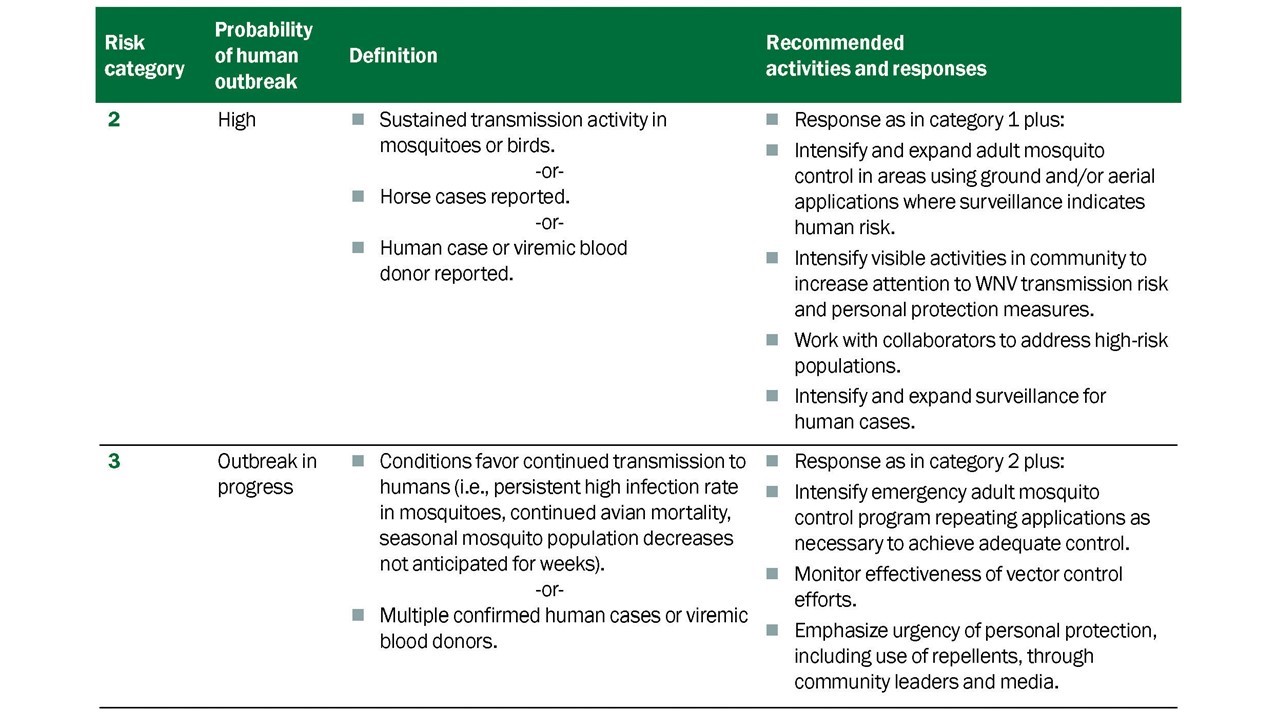
All communities should prepare for WNV activity. For reasons that are not well understood, some regions are at risk of higher levels of WNV transmission and epidemics than others (CDC 2010), but there is evidence of WNV presence and the risk of human disease and outbreaks in most counties in the contiguous 48 states. The ability to develop a useful phased response depends upon the existence of some form of WNV monitoring in the community to provide the information needed to gauge risk levels. Measures of the intensity of WNV epizootic transmission in a region, preferably from environmental surveillance indicators, should be considered when determining the level of the public health response. As noted previously, human case reports lag weeks behind human infection events and are poor indicators of current risk levels. Effective public health actions depend on interpreting the best available surveillance data and initiating prompt and aggressive intervention when necessary.
Individual-Level Actions to Reduce Risk
Without an available, effective vaccine for people, the best way to prevent mosquito-borne disease is by preventing mosquito bites. This can be accomplished through community-based IVM programs and by personal protection behaviors, such as:
- Mosquito-avoidance. Health officials may recommend residents avoid outdoor activities when mosquitoes are most active and high virus activity levels have been detected or when mosquitoes are most active.
- Use of personal repellents. CDC recommends using EPA-registered insect repellents or covering up with long-sleeved shirts and long pants when outside.
- Removal of residential mosquito sources. Once a week, residents should empty, cover, or throw out items that hold water, such as tires, buckets, planters, toys, pools, birdbaths, flowerpots, or trash containers.
Jurisdictions can promote individual and community-based prevention measures through public education and risk communication activities. Messages should acknowledge the seriousness of the disease without promoting undue fear or panic in the target population. Fear-driven messages may heighten the powerlessness people express in dealing with vector-borne diseases. Messages should be clear and consistent with the recommendations of coordinating agencies and include a call to action. Use plain language and adapt materials for lower literacy and non-English speaking audiences.
Mosquito bites can be avoided simply by not going outdoors when mosquitoes are biting, and recommendations to avoid outdoor activity when and where high virus activity levels have been detected are a component of prevention programs. Recommendations to avoid being outdoors during peak mosquito biting times may conflict with neighborhood social patterns, community events, or the practices of persons without air-conditioning. It is important to communicate when the important mosquito vectors are most active. Emphasize that insect repellent use is protective and should be used when outdoors, particularly during the prime mosquito-biting hours.
Additional information about preventing mosquito bites and controlling mosquitoes at home:
Prevention Strategies for High-Risk Groups
Audience members have different disease-related concerns and motivations for action. Proper message targeting (including use of plain language) permits better use of limited communication and prevention resources. The following are some population segments that require specific targeting. See Human Disease Section for additional information about risk groups that should be targeted.
Persons with Outdoor Exposure. People who engage in extensive outdoor work or recreational activities are at greater risk of being bitten by mosquitoes and ticks. Messages for these individuals should encourage use of insect repellent and protective clothing, particularly if outdoor activities occur during dusk to dawn hours. Local spokespersons (e.g., union officials, job-site supervisors, golf pros, sports organizations, lawn care professionals, public works officials, gardening experts) may be useful collaborators. Place messages in locations where people engage in outdoor activities (e.g., parks, golf courses, hiking trails).
Homeless Populations. Extensive outdoor exposure and limited financial resources in this group present special challenges. Application of insect repellents to exposed skin and clothing may be most appropriate prevention measures for this population. Work with social service groups in your area to educate and provide insect repellents to this population segment.
Residences Lacking Window Screens. The absence of intact window/door screens is a likely risk factor for exposure to mosquito bites. Focus attention on the need to repair screens and provide access to resources to do so. Partner with community organizations that can assist older persons or others with financial or physical barriers to screen installation or repair.
Older Adults. For many mosquito-borne diseases, older adults are at greater risk for serious disease. Messages on mosquito avoidance, insect repellent use, and removal of mosquito sources around the home should be shared with this audience.
Communication and Community Engagement
At the community level, reporting dead birds and nuisance mosquito problems, advocating for organized mosquito abatement, and participating in community mobilization projects to address sources of mosquitoes such as trash, standing water or neglected swimming pools are activities that can help protect individuals and at-risk groups.
Providing clear messages and understandable concepts promotes community understanding and acceptance. The following provides a description of selected best practices for reaching high-risk groups, offers suggestions for cultivating partnerships with media and communities, and provides select outreach measures for mobilizing communities.
Communicating About Vector Control
Public understanding and acceptance of emergency adult mosquito control operations using insecticides is critical to its success, especially where these measures are unfamiliar. Questions about the products being used, their safety, and their effects on the environment are common. Improved communication about surveillance and how decisions to use mosquito adulticides are made may help residents weigh the risks and benefits of control. When possible, provide detailed information regarding the schedule for adulticiding through newspapers, radio, government-access television, the internet, recorded phone messages, social media or other means your agency uses to successfully communicate with its constituencies.
Community Mobilization and Outreach
Community mobilization can improve education and help achieve behavior change goals. Promote the concept that health departments and mosquito control programs require community assistance to reduce mosquito-borne disease risk. Leverage online platforms to further disseminate your messages.
A community task force that includes civic, business, public health, and environmental concerns can be valuable in achieving buy-in from various segments of the community, and in developing a common message. Community mobilization activities can include clean-up days to get rid of mosquito breeding sites. Community outreach involves presenting messages in person, in addition to media and educational materials, and involving citizens in prevention activities. Hearing the message of personal prevention from community leaders can validate the importance of the disease. Health promotion events and activities reinforce the importance of prevention in a community setting.
Partnership with Media and the Community
It can be beneficial to cultivate relationships with the media (e.g., radio, TV, newspaper, web-based news outlets) prior to an outbreak. Obtain media training for at least one member of your staff and designate that individual as the organization's spokesperson. Develop clear press releases and an efficient system to answer press inquiries. Many communities have heard similar prevention messages repeated for several years. Securing the public's attention when risk levels increase can be a challenge. Evaluate and update mosquito bite prevention messages annually, and test new messages with different population segments to evaluate effectiveness. Develop partnerships with agencies/organizations that have relationships with populations at higher risk (such as persons over 50 years of age) or are recognized as community leaders (e.g., churches, service groups). Working through sources trusted by the priority audience can heighten the credibility of and attention to messages. Partnerships with businesses that sell materials to fix or install window screens or that sell insect repellent may be useful in some settings (e.g., local hardware stores, grocery stores).
Social Media
Social media can be an inexpensive and rapid method for disseminating information to the community. Outreach can be conducted using Twitter, Facebook, YouTube, blogs, and other websites that may reach constituents less connected to more traditional media sources. Using images or videos in your posts make them more attention grabbing. It is also best practice to include a call-to-action people can take. Provide links that direct users to webpages or other resources with more complete information.
Online Resources
The Internet has become a primary source of health information for many Americans. Encourage constituents to seek advice from credible sources. Make sure local public health agency websites are clear, accurate, and up to date. Useful information is available from a number of resources:
- The CDC web pages are updated frequently to reflect new findings and recommendations. Materials on the CDC web site are in the public domain and serve as a resource for state and local health departments and other organizations.
- CDC staff can provide technical assistance in the development of audience research and strategies for public education and community outreach. Contact CDC/Division of Vector-Borne Diseases' health communications staff in Fort Collins, CO at 970-221-6400.
- The U.S. Environmental Protection Agency (EPA) is the government's regulatory agency for insecticide and insect repellent use, safety, and effectiveness. Information about mosquito control insecticides and repellents is available at https://www.epa.gov/mosquitocontrol. These include guidance for using insect repellents safely (https://www.epa.gov/pesticides) and a search tool to assist in finding an insect repellent that is right for you (http://cfpub.epa.gov/oppref/insect/#searchform) which allows the user to examine the protection time afforded by registered insect repellents containing various concentrations of the active ingredients.
There are a number of non-governmental organizations that have developed useful tools and information that can be adapted for local needs. Examples include: the American Mosquito Control Association (https://www.mosquito.org) and the National Pesticide Information Center (NPIC) (npic.orst.edu).
Background
The establishment of West Nile virus (WNV) across North America has been accompanied by expanded efforts to monitor WNV transmission activity in many communities. Surveillance programs use various indicators to demonstrate virus activity. These include detecting evidence of virus in dead birds, dead horses, and mosquitoes; and detection of antibody against WNV in sentinel birds, wild birds, or horses (Reisen & Brault 2007). While all of these surveillance practices can demonstrate the presence of WNV in an area, few provide reliable, quantitative indices that may be useful in predictive surveillance programs. Only indices derived from a known and quantifiable surveillance effort conducted over time in an area will provide information that adequately reflects trends in virus transmission activity that may be related to human risk. Of the practices listed above, surveillance efforts are controlled and quantifiable only in mosquito and sentinel-chicken based programs. In these programs, the number of sentinel chicken flocks/number of chickens, and the number of mosquito traps set per week is known and allows calculation of meaningful infection rates that reflect virus transmission activity.
Premise Behind Developing the Vector Index (VI)
Mosquito-based arbovirus surveillance provides three pieces of information: The variety of species comprising of the mosquito community; density of each species population (in terms of the number collected in each trap unit of a given trap type); and if the specimens are tested for the presence of arboviruses, the incidence of the agent in the mosquito population. Taken individually, each parameter describes one aspect of the vector community that may affect human risk, but the individual elements don't give a comprehensive estimate of the number of potentially infectious vectors seeking hosts at a given time in the surveillance area.
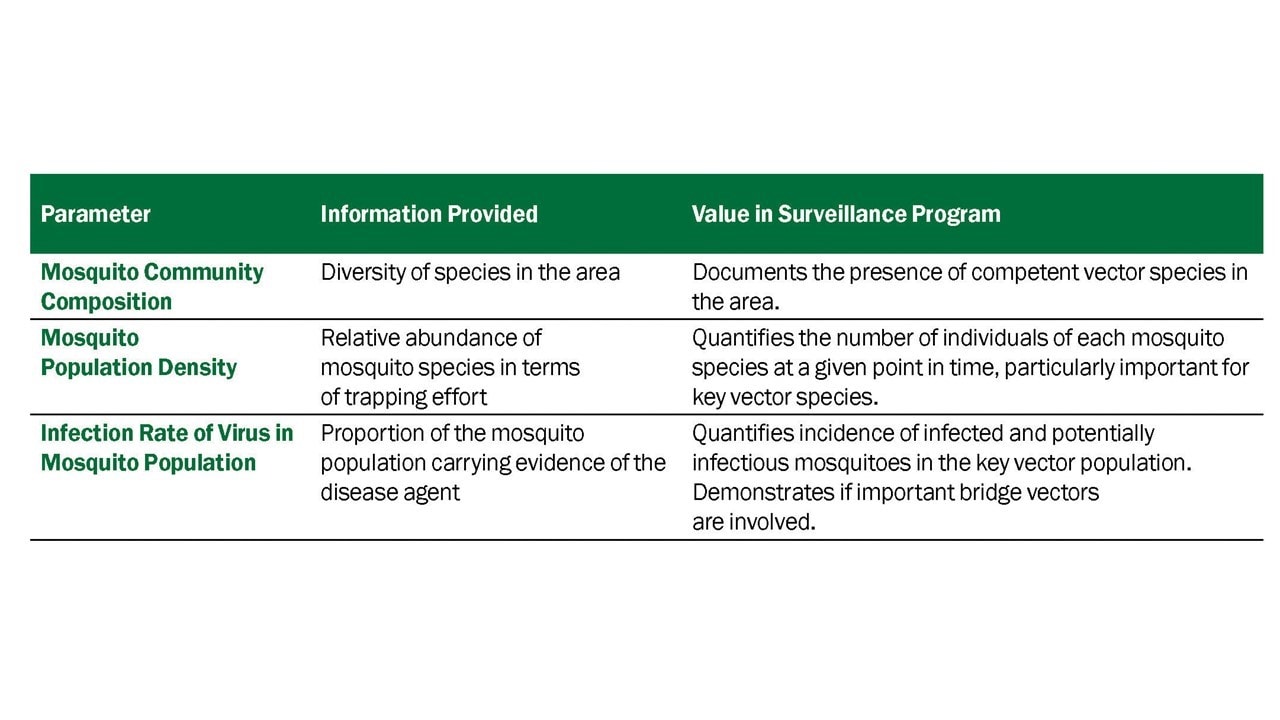
Vector Index
To express the arbovirus transmission risk posed by a vector population adequately, information from all three parameters (vector species presence, vector species density, vector species infection rate) must be considered. The VI combines all three of the parameters quantified through standard mosquito surveillance procedures in a single value (Gujaral et al. 2007, Bolling et al. 2009, Jones et al. 2011, Kwan et al. 2012, Colborn et al. 2013 in press). The VI is simply the estimated average number of infected mosquitoes collected per trap night summed for the key vector species in the area. Summing the VI for the key vector species incorporates the contribution of more than one species and recognizes the fact that WNV transmission may involve one or more primary vectors and several accessory or bridge vectors in an area.
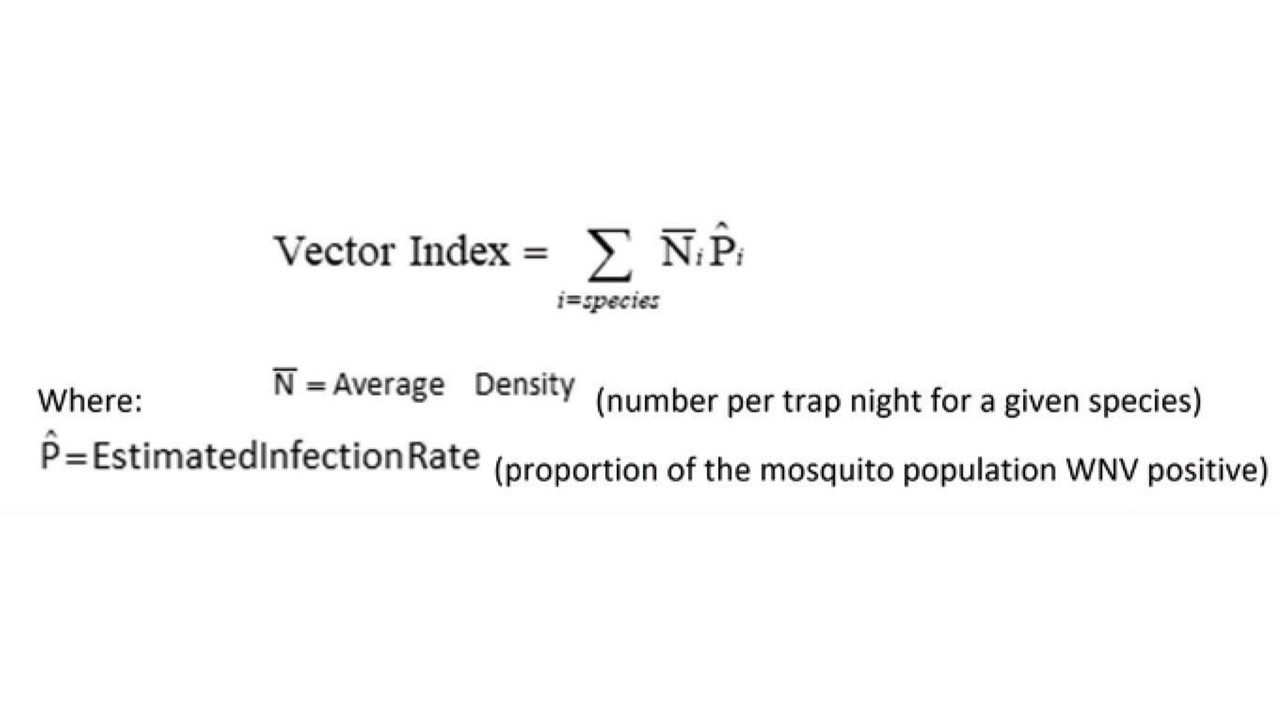
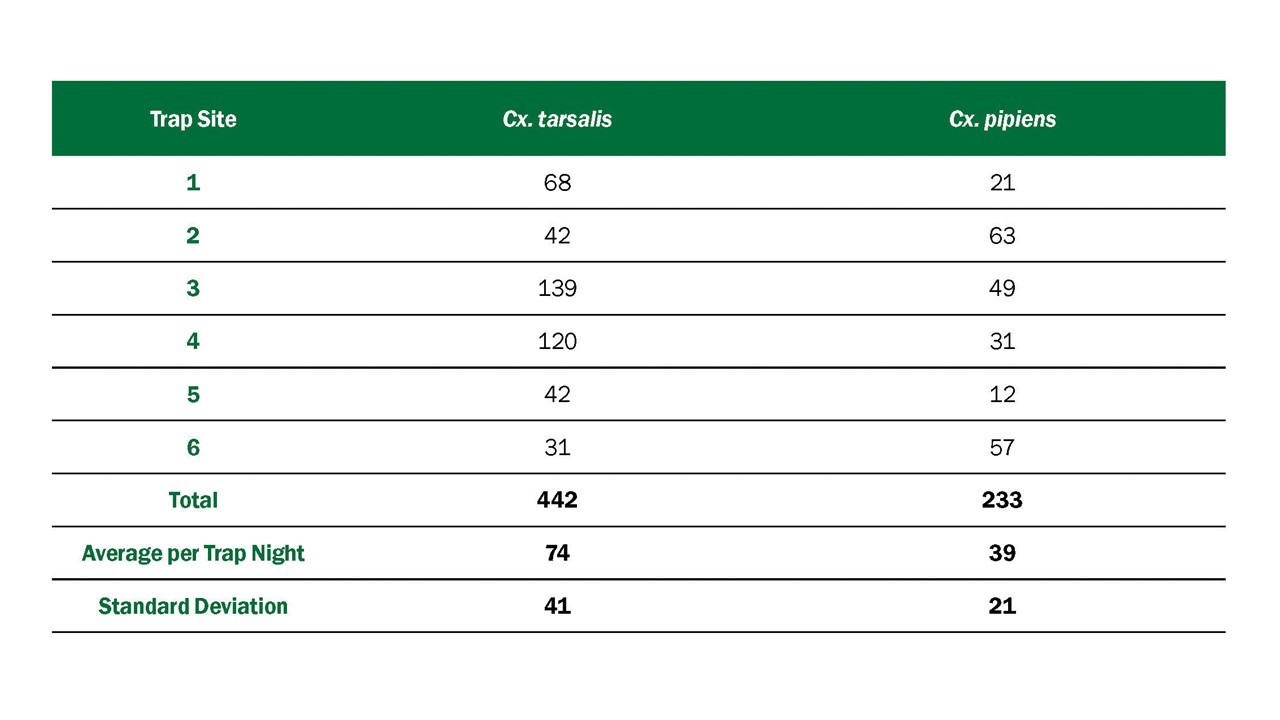
This guidance, which is directed to state health departments, supplements current West Nile Virus in the United States: Surveillance, Prevention, and Control and An Early Detection System for Highly Pathogenic H5N1 Avian Influenza in Wild Migratory Birds: U.S. Interagency Strategic Plan.
Surveillance of dead birds for WNV has proven useful for the early detection of WNV in the United States. In recent months, it has also proven useful for the early detection of highly pathogenic H5N1 avian influenza A (HPAI H5N1, hereafter referred to as H5N1 virus) in Europe. Given the potential for H5N1 to infect wild birds in North America in the future, the following interim guidance is offered to support the efforts of states conducting avian mortality surveillance.
General Considerations for States Conducting Avian Mortality Surveillance
- If different agencies within a state are separately responsible for conducting surveillance for WNV or H5N1 among wild birds, the sharing of resources, including dead birds submitted for testing, may increase the efficiency of both systems.
- Any dead bird might be infected with any one of a number of zoonotic diseases currently present in the United States, such as WNV. However, in countries where H5N1 has been found in captive and wild birds, it frequently has resulted in multiple deaths within and across species, and if H5N1 enters the US, it is likely to result in the death of wild birds. If wild birds in the United States are exposed to the virus, both single and groups of dead birds should be considered potentially infected.
Avian mortality due to the introduction of H5N1 could occur at any time of the year, whereas WNV is more often detected when mosquitoes are active.
- To date, no human infections of WNV have been confirmed due to contact with live or dead wild birds in outdoor settings.
- Most human H5N1 cases overseas have been associated with close contact with infected poultry or their environment; however, a very small number of cases appear to be related to the handling of infected wild birds or their feathers or feces without the use of proper personal protective equipment (PPE). There is no evidence of H5N1 transmission to humans from exposure to H5N1 virus-contaminated water during swimming; however, this may be theoretically possible. (Highly Pathogenic Avian Influenza (H5N1): Pathways of Exposure at the Animal-Human Interface, a Systematic Review - PMC (nih.gov))
- Although handling infected birds is unlikely to lead to infection, persons who develop an influenza-like illness after handling sick or dead birds should seek medical attention. Their health care provider should report the incident to public health agencies if clinical symptoms or laboratory test results indicate possible H5N1 or WNV infection.
Infection Control and Health and Safety Precautions
These guidelines are intended for any person handling dead birds. The risk of infection with WNV from such contact is small. The risk of infection with H5N1 from handling dead birds is difficult to quantify and is likely to vary with each situation. Risk is related to the nature of the work environment, the number of birds to be collected, and the potential for aerosolization of bird feces, body fluids, or other tissues. The most important factor that will influence the degree of infection risk from handling wild birds is whether H5N1 has been reported in the area. Local public health officials can be consulted to help in selecting the most appropriate PPE for the situation.
General Precautions for Collection of Single Dead Birds (These precautions are applicable to employees as well as the general public)
When collecting dead birds, the risk of infection from WNV, H5N1, or any other pathogen may be eliminated by avoiding contamination of mucous membranes, eyes, and skin by material from the birds. This can be accomplished by eliminating any direct contact with dead birds via use of the following safety precautions:
- When picking up any dead bird, wear disposable impermeable gloves and place it directly into a plastic bag. Gloves should be changed if torn or otherwise damaged. If gloves are not available, use an inverted double-plastic bag technique for picking up carcasses or use a shovel to scoop the carcass into a plastic bag.
In situations in which the bird carcass is in a wet environment or in other situations in which splashing or aerosolization of viral particles is likely to occur during disposal, safety goggles or glasses and a surgical mask may be worn to protect mucous membranes against splashed droplets or particles.
Bird carcasses should be double bagged and placed in a trash receptacle that is secured from access by children and animals. If the carcass will be submitted for testing, hold it a cool location until it pickup or delivery to authorities. Carcasses should not be held in close contact with food (e.g., not in a household refrigerator or picnic cooler).
After handling any dead bird, avoid touching the face with gloved or unwashed hands.
Any PPE that was used (e.g. gloves, safety glasses, mask) should be discarded or disinfected* when done, and hands should then be washed with soap and water (or use an alcohol-based hand gel when soap and water are not available). http://www.cdc.gov/cleanhands/
- If possible, before disposing of the bird, members of the public may wish to consult with their local animal control, health, wildlife or agricultural agency or other such entity to inquire whether dead bird reports are being tallied and if the dead bird in question might be a candidate for WNV or H5N1 testing.
Additional Precautions for Personnel Tasked with Collecting Dead Birds in Higher-Risk Settings (e.g., when collecting large numbers or in confined indoor spaces, particularly once H5N1 has been confirmed in an area)
- Minimize any work activities that generate airborne particles. For example, during the cleanup phase of the bird removal, avoid washing surfaces with pressurized water or cleaner (i.e., pressure washing), which could theoretically aerosolize H5N1 viral particles that could then be inhaled. If aerosolization is unavoidable, the use of a filtering face-piece respirator (e.g., N95) would be prudent, particularly while handling large quantities of dead birds repeatedly as part of regular work requirements.
If using safety glasses, a mask, or a respirator, do not remove until after gloves have been removed and hands have been washed with soap and water (or use an alcohol-based hand gel when soap and water are not available). After PPE has been removed, hands should immediately be cleaned again (http://www.cdc.gov/cleanhands/) Personal protective equipment worn (e.g., gloves, mask, or clothing) should be disinfected* or discarded.
Discuss appropriate biosafety practices and PPE use with your employer.
*Recommendations for PPE Disinfection
For machine-washable, reusable PPE: Disinfect PPE in a washing machine with detergent in a normal wash cycle. Adding bleach will increase the speed of viral inactivation as will hot water but detergent alone in cold water will be effective. Follow manufacturer recommendations for drying the PPE. Non machine-washable, reusable PPE should be cleaned following the manufacturer's recommendations for cleaning.
Laboratory Biosafety Recommendations
Laboratory handling of routine diagnostic specimens of avian carcasses requires a minimum of BSL-2 laboratory safety precautions. However, if either WNV or H5N1 infection of the specimens is suspected on the basis of previous surveillance findings, at a minimum BSL-3 precautions are advisable. Consult your institutional biosafety officer for specific recommendations. Biosafety levels are described in the Biosafety in Microbiological and Biomedical Laboratories (BMBL), 6th edition.
Additional Information Sources
Anderson JF, Main AJ, Cheng G, Ferrandino FJ, Fikrig E. 2012. Horizontal and vertical transmission of West Nile virus genotype NY99 by Culex salinarius and genotypes NY99 and WN02 by Culex tarsalis. Am J Trop Med Hyg. 86(1):134-9.
Andreadis TG, Armstrong PM. 2007. A two-year evaluation of elevated canopy trapping for Culex mosquitoes and West Nile virus in an operational surveillance program in the Northeastern United States. J Am Mosq Control Assoc. 23(2):137-148.
Austgen LE, Bowen RA, Bunning ML, Davis BS, Mitchell CJ, Chang GJ. 2004. Experimental infection of cats and dogs with West Nile virus. Emerg Inf Dis. 10(1)82-86.
Beaty BJ, Calisher CH, Shope RS. 1989. In Schmidt NJ, Emmons RW (ed.), Diagnostic procedures for viral, rickettsial and chlamydia infections. American Public Health Assoc, Washington DC. Arboviruses, p. 797-856.
Bell JA, Mickelson NJ, Vaughan JA. 2005. West Nile virus in host-seeking mosquitoes within a residential neighborhood in Grand Forks, North Dakota. Vector-Borne Zoonotic Dis. 5:373.
Bhatnagar J, Guarner J, Paddock CD, et al. 2007. Detection of West Nile virus in formalin-fixed, paraffin-embedded human tissues by RT-PCR: a useful adjunct to conventional tissue-based diagnostic methods. J Clin Virol. 38(2):106-11.
Blitvich BJ, Bowen RA, Marlenee NL, Hall RA, Bunning ML, Beaty BJ. 2003b. Epitope-blocking enzyme-linked immunosorbent assays for detection of West Nile virus antibodies in domestic mammals. J Clin Microbiol. 41(6):2676-9.
Blitvich BJ, Marlenee NL, Hall RA, et al. 2003a. Epitope-blocking enzyme-linked immunosorbent assays for the detection of serum antibodies to West Nile virus in multiple avian species. J Clin Microbiol. 41(3):1041-7.
Bolling BG, Barker CM, Moore CG, Pape WJ, Eisen L. 2009. Seasonal patterns for entomological measures of risk for exposure to Culex vectors and West Nile virus in relation to human disease cases in Northeastern Colorado. J Med Entomol. 46:1519-1531.
Bonds JA. 2012. Ultra-low-volume space sprays in mosquito control: a critical review. Med Vet Entomol. 26(2):121-30.
Briese T, Glass WG, Lipkin WI. 2000. Detection of West Nile virus sequences in cerebrospinal fluid. Lancet. 355:1614-5.
Brogdon WG, McAllister JC. 1998. Insecticide resistance and vector control. Emerging Infectious Diseases. 4:605-613.
Burkett DA, Kelly R, Porter CH, Wirtz RA. 2004. Commercial mosquito trap and gravid trap oviposition media evaluation, Atlanta, Georgia. J Am Mosq Control Assoc. 20(3): 223-228.
Burkhalter KL, Lindsay R, Anderson R, Dibernardo A, Fong W, Nasci RS. 2006. Evaluation of commercial assays for detecting West Nile virus antigen. J Am Mosq Control Assoc. 22:64-69.
Campbell GL, Marfin AA, Lanciotti RS, Gubler DJ, 2002. West Nile virus. Lancet Infect Dis. 2: 519-29.
Carney RM, Ahearn SC, McConchie A, et al. 2011. Early warning system for West Nile virus risk areas, California, USA. Emerg Infect Dis. 7(8):1445-54.
Carney RM, Husted S, Jean S, Glaser C, Kramer V. 2008. Efficacy of aerial spraying of mosquito adulticide in reducing incidence of West Nile virus, California. Emerg Infect Dis. 14:747-754. doi: 10.3201/eid1405.071347
CDC 2016. Surveillance and Control of Aedes aegypti and Aedes albopictus in the United States.
CDC. 2002. Laboratory-acquired West Nile virus infections—United States, 2002. Morb Mortal Wkly Rep. 51: 1133-5.
CDC. 2003a. West Nile virus infection among turkey breeder farm workers—Wisconsin, 2002. Morb Mortal Wkly Rep. 52: 1017-9.
CDC. 2003b. Detection of West Nile virus in blood donations—United States, 2003. Morb Mortal Wkly Rep. 52: 769-72.
CDC. 2010. Surveillance for human West Nile virus disease—United States, 1999-2008. Morb Mortal Wkly Rep. 59(No SS-2):1-17.
CDC. 2016. Species of dead birds in which West Nile virus has been detected, United States, 1999-2016.
CDC. 2021. West Nile virus: Mosquito Control. Key Resources for Professionals. https://www.cdc.gov/westnile/vectorcontrol/index.html.
Colborn JM, Smith KA, Townsend J, Damian D, Nasci RS, Mutebi JP. 2013. West Nile virus outbreak in Phoenix, Arizona—2010: entomological observations and epidemiological correlations. J Amer Mosq Control Assoc. 29(2):123-32.
Currier M, McNeill, M, Campbell D, et al. 2005. Human exposure to mosquito-control pesticides- Mississippi, North Carolina, and Virginia, 2002 and 2003. Morb Mortal Wkly Rep. 54:529-532.
Darsie RF, Ward RA. 2005. Identification and geographical distribution of the mosquitoes of North America, North of Mexico. University of Florida Press, Gainesville, FL. 383 pp.
Davis RS, Peterson RK. 2008. Effects of single and multiple applications of mosquito insecticides on nontarget arthropods. J Am Mosq Control Assoc. 24-270-280.
Docherty DE, Long RR, Griffin KM, Saito EK. 2004. Corvidae feather pulp and West Nile virus detection. Emerg Infect Dis. 10(5):907-9.
Duprey Z, Rivers S, Luber G, et al. 2008. Community aerial mosquito control and naled exposure. J Am Mosq Control Assoc. 24:42-46.
Eidson M. 2001a. “Neon needles” in a haystack: the advantages of passive surveillance for West Nile virus. Ann N Y Acad Sci. 951:38-53.
Eidson M, Schmit K, Hagiwara Y, Anand M, Backenson PB, Gotham I. 2001b. Dead crow densities and human cases of West Nile virus, New York State. Emerg Infect Dis. 7:662–4.
Eldridge BF. 2004. Surveillance for arthropodborne diseases. In Eldridge and Edman eds. Medical Entomology, Kluwer Academic Press, Dordrecht, The Netherlands, pp 645.
Fonseca K, Prince GD, Bratvold J, et al. 2005. West Nile virus infection and conjunctival exposure. Emerg Infect Dis. 11(10):1648-9.
Godsey MS Jr., Burkhalter K, Young G, et al. 2012. Entomologic investigations during an outbreak of West Nile virus disease in Maricopa County, Arizona, 2010. Am J Trop Med Hyg. 87(6):1125-1131.
Gu W, Unnasch TR, Katholi CR, Lampman R, Novak RJ. 2008. Fundamental issues in mosquito surveillance for arboviral transmission. Trans R Soc Trop Med Hyg. 102: 817-822.
Gubler, DJ. 2007. The continuing spread of West Nile Virus in the Western Hemisphere. Clinical Inf Dis. 45:1039–46 51.
Gujral IB, Zielinski-Gutierrez EC, LeBailly A, Nasci R. 2007. Behavioral risks for West Nile virus disease, northern Colorado, 2003. Emerg Infect Dis. 13(3):419-25.
Guptill SC, Julian KG, Campbell GL, Price SD, Marfin AA. 2003. Early-season avian deaths from West Nile virus as warnings of human infection. Emerg Infect Dis. 9(4):483-4.
Hamer GL, Kitron UD, Goldberg TL, Brawn JD, Loss SR, Ruiz OR, et al. 2009. Host selection by Culex pipiens mosquitoes and West Nile virus amplification. Am J Trop Med Hyg. 80:268–278.
Hayes EB, Komar N, Nasci RS, Montgomery SP, O’Leary DR, Campbell GL, 2005a. Epidemiology and transmission dynamics of West Nile virus disease. Emerg Infect Dis. 11: 1167–1173.
Hayes EB, Sejvar JJ, Zaki SR, Lanciotti RS, Bode AV, Campbell GL. 2005b. Virology, pathology, and clinical manifestations for West Nile virus disease. Emerg Infect Dis. 11: 1174-9.
Healy J, Reisen WK, Kramer V, Barker CM. 2012. Do current surveillance methods provide adequate warning for human infections with West Nile virus? Proc Mosq Control Assoc Calif. 80:17-21.
Hinckley AF, O’Leary DR, Hayes EB. 2007. Transmission of West Nile virus through human breast milk seems to be rare. Pediatrics. 119(3): e666-71.
Hunt AR, Hall RA, Kerst AJ, et al. 2002. Detection of West Nile virus antigen in mosquitoes and avian tissues by a monoclonal antibody-based capture enzyme immunoassay. J Clin Microbiol. 40: 2023–30.
Iwamoto M, Jernigan DB, Guasch A, et al. 2003. Transmission of West Nile virus from an organ donor to four transplant recipients. N Eng J Med. 348(22): 2196-203.
Johnson AJ, Martin DA, Karabatsos N, Roehrig JT. 2000. Detection of anti-arboviral immunoglobulin G by using a monoclonal antibody-based capture enzyme-linked immunosorbent assay. J Clin Microbiol. 38:1827-31.
Johnson AJ, Noga AJ, Kosoy O, Lanciotti RS, Johnson AA, Biggerstaff BJ. 2005. Duplex microsphere-based immunoassay for detection of anti-West Nile virus and anti-St. Louis encephalitis virus immunoglobulin m antibodies. Clin Diagn Lab Immunol. 12(5):566-74.
Johnson G, Nemeth N, Hale K, Lindsey N, Panella NA, Komar N. 2010. Surveillance for West Nile virus in American white pelicans, Montana, USA, 2006-2007. Emerg Infect Dis. 16(3):406–11.
Jones RC, Weaver KN, Smith S, et al. 2011. Use of the vector index and geographic information system to prospectively inform West Nile virus interventions. J Am Mosq Control Assoc. 27:315-319.
Julian KG, Eidson M, Kipp AM, et al. 2002. Early season crow mortality as a sentinel for West Nile virus disease in humans, northeastern United States. Vector Borne Zoonotic Dis. 2(3):145-55.
Karpati AM, Perrin MC, Matte T, Leighton J, Schwartz J, Barr RG. 2004. Pesticide spraying for West Nile virus control and emergency department asthma visits in New York City, 2000. Environ Health Perspect. 112(11):1183-7.
Kesavaraju B, Farajollahi A, Lampman RL, et al. 2012. Evaluation of a rapid analyte measurement platform for West Nile virus detection based on United States mosquito control programs. Am J Trop Med Hyg. 87(2):359-63.
Kilpatrick AM, Daszak P, Jones MJ, Marra PP, Kramer LD. 2006b. Host heterogeneity dominates West Nile virus transmission. Proc Biol Sci. 273(1599):2327-33.
Kilpatrick AM, Kramer LD, Campbell SR, Alleyne EO, Dobson AP, Daszak P. 2005. West Nile virus risk assessment and the bridge vector paradigm. Emerg Infect Dis. 11(3):425-9.
Kilpatrick AM, Kramer LD, Jones MJ, Marra PP, Daszak P. 2006a. West Nile virus epidemics in North America are driven by shifts in mosquito feeding behavior. PLoS Biol. 4:606–610.
Komar N, Lanciotti R, Bowen R, Langevin S, Bunning M. 2002. Detection of West Nile virus in oral and cloacal swabs collected from bird carcasses. Emerg Infect Dis. 8(7):741-2.
Komar N. 2001. West Nile virus surveillance using sentinel birds. Annals NY Acad Sci. 951:58-73.
Komar N. 2003. West Nile virus: epidemiology and ecology in North America. Adv. Vir. Res. 61:185-234.
Komar N, Langevin S, Monath TP. 2009. Use of a surrogate chimeric virus to detect West Nile virus-neutralizing antibodies in avian and equine sera. Clinical and Vaccine Immunology. 16(1):134-135.
Kramer, LD, LM. Styer,GD. Ebel. 2008. A global perspective on the epidemiology of West Nile virus. Ann Rev Entomol. 53:61–81.
Kuno G, Chang G-J J, Tsuchiya KR, Karabatsos N, Cropp CB. 1998. Phylogeny of the genus Flavivirus. J Virol. 72:73-83.
Kwan JL, Kluh S, Madon MB, Nguyen DV, Barker CM, Reisen WK. 2010. Sentinel chicken seroconversions track tangential transmission of West Nile virus to humans in the greater Los Angeles area of California. Am J Trop Med Hyg. 83(5):1137-45.
Kwan JL, Kluh S, Reisen WK. 2012b. Antecedent avian immunity limits tangential transmission of West Nile virus to humans. PLoS One. 7(3):e34127.
Kwan JL, Park BK, Carpenter TE, Ngo V, Civen R, Reisen WK. 2012. Comparison of enzootic risk measures for predicting West Nile disease, Los Angeles, California, USA, 2004-2010. Emerg Infect Dis. 18(8):1298-306.
Lampman RL, Krasavin NM, Szyska M, Novak RJ. 2006. A comparison of two West Nile virus detection assays (TaqMan reverse transcriptase polymerase chain reaction and VecTest antigen assay) during three consecutive outbreaks in northern Illinois. J Am Mosq Control Assoc. 22(1):76-86.
Lampman RL, Novak RJ. 1996. Oviposition preferences of Culex pipiens and Culex restuans for infusion-baited traps. J Am Mosq Control Assoc. 12(1):23-32.
Lanciotti RS, Kerst AJ, Nasci RS, et al. 2000. Rapid detection of West Nile virus from human clinical specimens, field-collected mosquitoes, and avian samples by a TaqMan reverse transcriptase-PCR assay. J Clin Microbiol. 38:4066-71.
Langevin SA, Bunning M, Davis B, Komar N. 2001. Experimental infection of chickens as candidate sentinels for West Nile virus. Emerg Infect Dis. 7(4):726-729.
Lim AK, Dunne G, Gurfield N. 2009. Rapid bilateral intraocular cocktail sampling method for West Nile virus detection in dead corvids. J Vet Diagn Invest. 21(4):516-9.
Lindsey NP, Staples JE, Lehman JA, Fischer M. 2012. Medical risk factors for severe West Nile virus disease, United States, 2008-2010. Am J Trop Med Hyg. 87(1):179-84.
Lloyd, A.M., C.R. Connelly, and D.B. Carlson (eds.). 2018. Florida Coordinating Council on Mosquito Control. Florida Mosquito Control: The state of the mission as defined by mosquito controllers, regulators, and environmental managers. Vero Beach, FL: University of Florida, Institute of Food and Agricultural Sciences, Florida Medical Entomology Laboratory.
Lothrop HD, Lothrop BB, Gomsi DE, Reisen WK. 2008. Intensive early season adulticide applications decrease arbovirus transmission throughout the Coachella Valley, Riverside County, California. Vector Borne and Zoonotic Dis. 8:475-490.
Macedo, PA, Schleier, III JJ, et al. 2010. Evaluation of efficacy and human health risk of aerial ultra-low volume applications of pyrethrins and piperonyl butoxide for adult mosquito management in response to West Nile virus activity in Sacramento County, California. J Am Mosq Control Assoc. 26-57-66.
Mackay AJ, Roy A, Yates MM, Foil LD. 2008. West Nile virus detection in mosquitoes in East Baton Rouge Parish, Louisiana, from November 2002 to October 2004. J Am Mosq Control Assoc. 24(1):28-35.
Martin DA, Muth DA, Brown T, Johnson AJ, Karabatsos N, Roehrig JT. 2000. Standardization of immunoglobulin M capture enzyme-linked immunosorbent assays for routine diagnosis of arboviral infections. J Clin Microbiol. 38:1823-6.
Mattar S, Komar N, Young G, Alvarez J, Gonzalez M. 2011. Seroconversion to West Nile and St. Louis encephalitis viruses among sentinel horses, Colombia. Mem Inst Oswaldo Cruz. 106(8): 976-79.
McCardle PW, Webb RE, Norden BB, Aldrich JR. 2004. Evaluation of five trapping systems for the surveillance of gravid mosquitoes in Prince Georges County, Maryland. J Am Mosq Control Assoc. 20(3):254-260.
McDonald ES, Mathis S, Martin SW, Staples JE, Fischer M, Lindsey NP. 2021. Surveillance for West Nile virus disease — United States, 2009‒2018. Morb Mortal Wkly Rep. 70(1):1-15.
Molaei G, Andreadis TG, Armstrong PM, Anderson JF, Vossbrinck CR. 2006. Host feeding patterns of Culex mosquitoes and West Nile virus transmission, northeastern United States. Emerg Infect Dis. 12(3):468-74.
Mostashari F, Bunning ML, Kitsutari PT, et al. 2001. Epidemic West Nile encephalitis, New York, 1999: results of a household-based seroepidemiological survey. Lancet. 358: 261-4. 55.
Mostashari F, Kulldorff M, Hartman JJ, Miller JR, Kulasekera V. 2003. Dead bird clusters as an early warning system for West Nile virus activity. Emerg Infect Dis. 9:641-646.
Mount GA, Biery TL, Haile DG. 1996. A review of ultralow-volume aerial sprays of insecticide for mosquito control. J Am Mosq Control Assoc. 12(4):601-18.
Mount GA. 1998. A critical review of ultralow-volume aerosols of insecticide applied with vehicle-mounted generators for adult mosquito control. J Am Mosq Control Assoc. 14(3):305-34.
Murray K, Baraniuk S, Resnick M, et al. 2006. Risk factors for encephalitis and death from West Nile virus infection. Epidemiol Infect. 134:1325–32.
Nasci RS, Gottfried KL, Burkhalter KL, et al. 2002. Comparison of vero cell plaque assay, TaqMan reverse transcriptase polymerase chain reaction RNA assay, and VecTest antigen assay for detection of West Nile virus in field-collected mosquitoes. J Am Mosq Control Assoc. 18:294-300.
Nasci RS, Mutebi JP. 2019. Reducing West Nile virus through vector management. J Med Entomol. 56(6):1516-1521.
Nasci RS. 1981. A lightweight battery-powered aspirator for collecting resting mosquitoes in the field. Mosq News. 41: 808-811.
Nash DMF, Fine A, Miller J, et al. 2001. The outbreak of West Nile virus infection in the New York City area in 1999. N Engl J Med. 344:1807–1814.
Nemeth N, Beckett S, Edwards E, Klenk K, Komar N. 2007a. Avian mortality surveillance for West Nile virus in Colorado. Am J Trop Med Hyg. 76:431-7.
Nemeth N, Kratz G, Edward E, Scherpelz J, Bowen R, Komar N. 2007b. Evaluation of clinic-admitted raptors for West Nile virus surveillance. Emerg Infect Dis. 13(2): 305-307.
Nemeth NM, Burkhalter KL, Young GR, Brault AC, Reisen WK, Komar N. 2009. West Nile virus detection in nonvascular feathers from avian carcasses. J Vet Diagn Invest. 21:616–622.
Nett RJ, Kuehnert MJ, Ison MG, Orlowski JP, Fischer M, Staples JE. 2012. Current practices and evaluation of screening solid organ donors for West Nile virus. Transpl Infect Dis. 14(3):268-77.
O’Leary DR, Kuhn S, Kniss KL, et al. 2006. Birth outcomes following West Nile virus infection of pregnant women in the United States: 2003-2004. Pediatrics. 117(3): e537-45.
Olson JG, Reeves WC, Emmons RW, Milby MM. 1979. Correlation of Culex tarsalis population indices with the incidence of St. Louis encephalitis and western equine encephalomyelitis in California. Am J Trop Med Hyg. 28: 335-343.
Panella NA, Crockett RJ, Biggerstaff BJ, Komar N. 2011. The Centers for Disease Control and Prevention resting trap: a novel device for collecting resting mosquitoes. J Am Mosq Control Assoc. 27(3):323-325.
Panella NA, Kerst AJ, Lanciotti RS, Bryant P, Wolf B, Komar N. 2001. Comparative West Nile virus detection in organs of naturally infected American crows (Corvus brachyrhynchos). Emerg Infect Dis. 7(4):754-5.
Patnaik JL, Juliusson L, Vogt RL. 2007. Environmental predictors of human West Nile virus infections, Colorado. Emerg Infect Dis. 13(11):1788-90.
Pealer LN, Marfin AA, Petersen LR, et al. 2003. Transmission of West Nile virus through blood transfusion in the United States in 2002. N Engl J Med. 349(13):1236-45.
Petersen LR, Carson PJ, Biggerstaff BJ, Custer B, Borchardt SM, Busch MP. 2012. Estimated cumulative incidence of West Nile virus infection in US adults, 1999-2010. Epidemiol Infect. 1-5.
Peterson RKD, Macedo PA, Davis RS. 2006. A human-health risk assessment for West Nile virus and insecticides used in mosquito management. Environ Health Perspect. 114-366-372.
Phoutrides E, Jusino-Mendez T, Perez-Medina T, et al. 2011. The utility of animal surveillance in the detection of West Nile virus activity in Puerto Rico, 2007. Vector Borne Zoonotic Dis. 11(4):447-50.
Reed LM, Johannson MJ, Panella N, et al. 2009. Declining mortality in American crow (Corvus brachyrhynchos) following natural West Nile virus infection. Avian Dis. 53:458–61.
Reisen WK, Boyce K, Cummings RC, et al. 1999. Comparative effectiveness of three adult mosquito sampling methods in habitats representative of four different biomes of California. J Med Entomol. 36(1):23-29.
Reisen W, Brault AC. 2007. West Nile virus in North America: perspectives on epidemiology and intervention. Pest Manag Sci. 63(7):641-646.
Reiter P, Jakob WL, Francy DB, Mullenix JB. 1986. Evaluation of the CDC gravid trap for the surveillance of St. Louis encephalitis vectors in Memphis, Tennessee. J Am Mosq Control Assoc. 2(2):209-211.
Resnick MP, Grunenwald P, Blackmar D, Hailey C, Bueno R, Murray KO. 2008. Juvenile dogs as potential sentinels for West Nile virus surveillance. Zoonoses Public Health. 55(8-10):443-7
Savage HM, Aggarwal D, Apperson CS, et al. 2007. Host choice and West Nile virus infection rates in blood-fed mosquitoes, including members of the Culex pipiens complex, from Memphis and Shelby County, Tennessee, 2002-2003. Vector Borne Zoonotic Dis. 7:365-86.
Savage HM, Ceianu C, Nicolescu G, et al. 1999. Entomologic and avian investigations of an epidemic of West Nile fever in Romania in 1996, with serologic and molecular characterization of a virus isolate from mosquitoes. Am J Trop Med Hyg. 61:600-11.
Savage HM, Kothera L. 2012. The Culex pipiens complex in the Mississippi River basin: identification, distribution, and bloodmeal hosts. J Am Mosq Control Assoc. 28(4 Suppl):93-9.
Andreadis TG, Anderson JF, Vossbrinck CR, et al. 2004. Epidemiology of West Nile virus in Connecticut: A five-year analysis of mosquito data 1999–2003. Vector-Borne Zoonotic Dis. 4:360–378.
Sejvar JJ, Marfin AA. 2006. Manifestations of West Nile neuroinvasive disease. Rev Med Virol. 16(4): 209-24.
Shi PY, Kauffman EB, Ren P, et al. 2001. High-throughput detection of West Nile virus RNA. J Clin Microbiol. 39:1264-71.
Smithburn KC, Hughes TP, Burke AW, Paul JH. 1940. A neurotropic virus isolated from the blood of a native of Uganda. Am J Trop Med Hyg. 20:471-92.
Soverow JE, Wellenius GA, Fisman DN, Mittleman MA. 2009. Infectious disease in a warming world: how weather influenced West Nile virus in the United States (2001-2005). Environmental Health Perspect. 117(7):1049-1052.
Sudia WD, Chamberlain RW. 1962. Battery-operated light trap an improved model. Mosq News. 22:126-129.
Sutherland GL, Nasci RS. 2007. Detection of West Nile virus in large pools of mosquitoes. J Am Mosq Control Assoc. 23:389-95.
Taylor RM, Work TH, Hurlbut HS, Rizk F. 1956. A study of the ecology of West Nile virus in Egypt. Am J Trop Med Hyg. 5:579-620.
Theodoropoulos NM, Greenwald MA, Chin-Hong P, Ison MG. 2021. Testing deceased organ donors for infections: An organ procurement organization survey. Am J Transplant. 21(5):1924-1930.
Tsai TF, Bolin RA, Montoya M, et al. 1987. Detection of St. Louis encephalitis virus antigen in mosquitoes by capture enzyme immunoassay. J Clin Microbiol. 25:370-6.
Turell MJ, Spring AR, Miller MK, Cannon CE. 2002. Effect of holding conditions on the detection of West Nile viral RNA by reverse transcriptase-polymerase chain reaction from mosquito (Diptera: Culicidae) pools. J Med Entomol. 39(1):1-3.
Unlu I, Roy AF, Yates M, et al. 2009. Evaluation of surveillance methods for detection of West Nile virus activity in East Baton Rouge Parish, Louisiana, 2004-2006. J Am Mosq Control Assoc. 25(2):126-33.
Watson JT, Pertel PE, Jones RC, et al. 2004. Clinical characteristics and functional outcomes of West Nile fever. Ann Intern Med. 141: 360-5.
Williges E, Farajollahi A, Nelder MP, Gaugler R. 2009. Comparative field analyses of rapid analyte measurement platform and reverse transcriptase polymerase chain reaction assays for West Nile virus surveillance. J Vector Ecol. 34(2):324-8.
Zou S, Foster GA, Dodd RY, Petersen LR, Stramer SL. 2010. West Nile fever characteristics among viremic persons identified through blood donor screening. J Inf Dis. 202:1354-1361.