


What to know
- CDC developed the wastewater viral activity level (WVAL) to compare the current levels of common respiratory viruses to low viral levels at that location over the last 24 months.
- WVALs allow data to be compared between sites, states/territories, regions, and nationally.
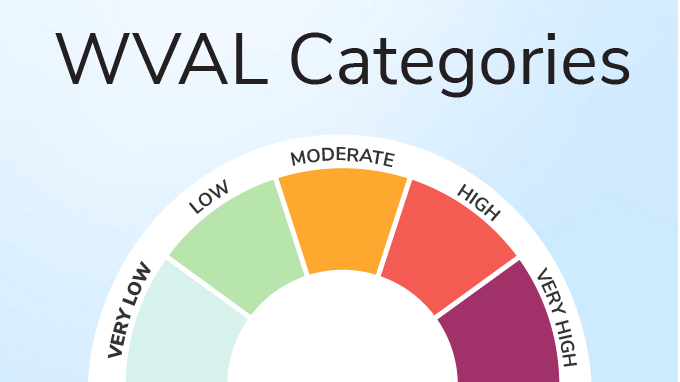
Understanding the WVAL
CDC developed the wastewater viral activity level (WVAL) metric to create a standardized method for comparing wastewater data within and across sites. This metric compares current levels to low levels of a virus at a site over the last 24 months.
CDC has validated the WVAL methodology for the following common respiratory illnesses: Influenza A, COVID-19, and RSV.
Why it is important
For You
If you see increased WVALs, it might mean there is a higher risk of infection. You can use these data to make informed decisions on how to protect yourself and others from respiratory viruses.
For Public Health
Public health officials use data from wastewater (sewage),
along with clinical data, to understand virus levels in a community. The WVAL
helps public health officials:
- See the bigger picture across a state/territory, region, or the United States
- Compare data across cities, states/territories, and time
- Spot unusual increases in influenza A, COVID-19, or RSV
- Inform healthcare providers and the public about relevant trends
What data to review
Current levels
See the current status of the virus in your community
Trends
Review whether the virus is increasing, decreasing, or staying the same
Other data
Look at other data, such as clinical data, to see if they're showing similar trends. Example resource: Respiratory Illnesses Data Channel
How it is calculated
Step 1: Group data together
To ensure that similar data are being compared, group the amount of virus present in a sample by:
- Which virus is being measured
- Which site the sample came from
- Which lab and laboratory method are used
Step 2: Validate data
To ensure data are ready for comparison:
- Log transform the data: This enables us to see overall trends clearly by reducing the influence of very large differences in viral concentrations.
- Limit the influence of unusually high values: Extremely high concentrations are capped at the 99th percentile for similarly grouped data. This reduces the impact of extreme values, which could lead to inaccurate interpretation, while keeping all observations.
Step 3: Determine typical low levels for each site
When looking at viral concentration data from the past 2 years, select the value that is higher than 10% of values. This baseline represents a typical low level of the virus for a site and is used to compare current viral concentrations.
For new sites, an adapted laboratory-based baseline and standard deviation are used while the site becomes established (365 days for influenza A and RSV; 182 days for SARS-CoV-2). During this initial period, the baseline and standard deviation are calculated from laboratory-level data to provide more stable values.
Step 4: Compare current levels to baselines
To calculate the WVAL, determine the difference between the current amount of virus and the baseline level, then divide that value by the standard deviation.
This produces a standardized value that shows how far current viral levels are from the typical low level for a site. Higher WVALs indicate that viral levels are further above the site's typical low level. The standardization of values allows activity to be compared across sites.
Step 5: Identify average weekly values
For each week, average the values for each site. This approach shows weekly trends.
Step 6: Categorize values
Group the WVAL values into one of five categories (see below for thresholds): Very low, low, moderate, high, or very high. These categories provide a quick understanding of the levels.
Note: Each virus has its own thresholds because each virus behaves differently. For example, a WVAL value of 10.0 would align with moderate influenza A levels, high COVID-19 levels, and very high RSV levels.
| Very Low | Low | Moderate | High | Very High | |
|---|---|---|---|---|---|
| Influenza A | Up to 2.4 | Greater than 2.4 and up to 5.5 | Greater than 5.5 and up to 10.2 | Greater than 10.2 and up to 15.6 | Greater than 15.6 |
| COVID-19 | Up to 2.6 | Greater than 2.6 and up to 4.9 | Greater than 4.9 and up to 7.9 | Greater than 7.9 and up to 11.6 | Greater than 11.6 |
| RSV | Up to 1.7 | Greater than 1.7 and up to 3.4 | Greater than 3.4 and up to 5.4 | Greater than 5.4 and up to 8.1 | Greater than 8.1 |
How WVALs are aggregated
State/territory
The median of site-level WVALs
Regional
The median of state/territory-level WVALs
National
The median of state/territory-level WVALs
States and territories may have a higher density of sampling sites in certain geographic areas, so the median WVAL may not represent viral activity for every community in the state or territory.
WVAL inclusion criteria
COVID-19
New wastewater sampling sites and sites with a substantial change in laboratory methods are included in national, regional, state, or territorial median values once there are at least 8 weeks of samples reported for that location.
Influenza A and RSV
New wastewater sampling sites and sites with a substantial change in laboratory methods are included in national and state or territorial median values once there are at least 8 weeks of samples reported for that pathogen. Sites must begin sampling by October 1 each year for their WVAL data to be displayed on the website. If sites begin sampling after October 1, their WVAL data will not be displayed until the following year.
Data resource
Annual recalibration
Each year, CDC works with wastewater monitoring scientists at state and local health departments, along with infectious disease experts, to review and update the statistical methods used to calculate the wastewater viral activity level (WVAL). Wastewater monitoring is an evolving science, and more data allows us to evaluate how well current methods perform and make improvements. WVALs are calculated using a baseline based on the most recent two years of data, so the range of WVALs can shift as new data replace older data. CDC updates the thresholds for these categories (very low, low, moderate, high, and very high) each year to ensure they continue to meaningfully distinguish different levels of wastewater viral activity. This is similar to routine recalibration used for other respiratory illness tracking systems. Updates ensure the WVAL metric reflects what’s happening in communities.
The annual review process occurs each summer, before the next fall/winter respiratory season, with updated methods published and applied each August. CDC works collaboratively with wastewater and infectious disease experts to evaluate method performance, including comparisons with clinical data from the National Syndromic Surveillance Program (NSSP). When CDC updates WVAL methods, updated methods are applied to all historical data, not just to new data going forward. This means past and current WVALs are updated using the recalibrated approach, ensuring that comparisons across sites and over time reflect differences in wastewater viral activity, not differences in how the data were analyzed.
WVAL methodology updates – August 2026
- Previously, any wastewater concentrations with a z-score greater than four were removed.
- As of August 2026, extreme values are modified with Winsorization at the 99th percentile instead of being removed.
- This methodological update allows for inclusion of extreme values, while limiting their impact.
- As of August 2026, new sites use a baseline and standard deviation calculated from all data at their testing laboratory for the first 182 days (COVID-19) or 365 days (influenza A and RSV). After this period, the baseline and standard deviation are replaced with values calculated from the site’s own data.
- These updates increase WVAL stability for new sites and reduce the frequency of WVALs that are extreme due to limited data.
- Previously, the national WVAL was calculated as the median of the regional WVALs.
- As of August 2026, the national WVAL is calculated as the median of the jurisdictional WVALs.
- This updated approach improves consistency across reporting programs who use various regional definitions and increases clarity in the relationship between jurisdictional and national WVALs.
- Previously, WVAL thresholds for influenza A and RSV were calculated using Jenks Natural Breaks, whereas thresholds for COVID-19 were calculated using percentiles.
- As of August 2026, WVAL thresholds were re-evaluated using Jenks Natural Breaks applied to the most recent 24 months of data for influenza A, COVID-19, and RSV. Threshold performance was assessed by comparing WVAL thresholds with National Syndromic Surveillance Program categories.
- Minor updates were made to WVAL thresholds to maintain continued alignment with recent wastewater activity.
- WVAL thresholds were recalculated using the most recent 24 months of wastewater data. This update ensures that thresholds reflect recent patterns of viral activity and current wastewater trends across the U.S.
This page was last updated on this date. Updates may include minor edits, image changes, or other modifications to page content.
The information on this page was last reviewed by subject matter experts to ensure accuracy.