QuickStats From NCHS

CELEBRATING 15 YEARS OF QUICKSTATS FROM NCHS
QuickStats from NCHS is a weekly feature in the Morbidity and Mortality Weekly Report (MMWR), a major CDC publication. QuickStats presents important findings from all NCHS data systems in an easy-to-read format containing a chart and a brief caption. The first QuickStats published on January 14, 2005, reported on the percentage of women who had ever received a mammogram. Since then, 694 QuickStats have been published, covering health topics of current and continuing interest. QuickStats is now one of the most popular MMWR features, and an important way to share NCHS data with a wide audience—to see all NCHS QuickStats, visit: https://www.cdc.gov/nchs/pressroom/quickstats.htm.
To honor the 15th anniversary of this unique resource, NCHS is publishing two special QuickStats that summarize the topics covered since 2005 and the population groups reported on.
QuickStats: Number of published QuickStats from NCHS, by
topic—2005–2019
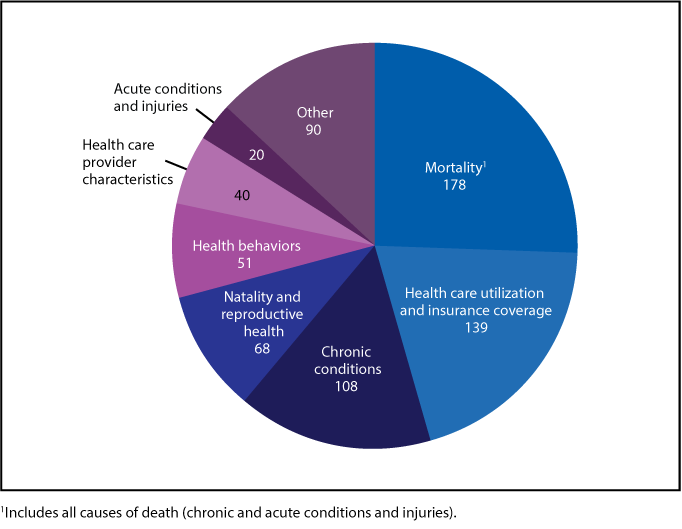
From 2005 through 2019, 694 QuickStats from NCHS have presented data on a wide array of health topics. The most frequently covered topics are mortality (178 QuickStats), health care utilization and insurance coverage (139), chronic conditions (108), and natality and reproductive health (68). Behavioral aspects of health, such as smoking and physical activity, were addressed in 51 QuickStats, characteristics of health care providers in 40 QuickStats, and acute conditions and injuries in 20 QuickStats.
Source: NCHS, QuickStats, 2005–2019, available from: https://www.cdc.gov/nchs/pressroom/quickstats.htm.
Reported by: Alex Strashny, PHD, kpr9@cdc.gov, 301–458–4564; Sandra Smith, MPH, sss4@cdc.gov, 301–458–4513.
QuickStats: Number of published QuickStats from NCHS, by
population characteristics—2005–2019
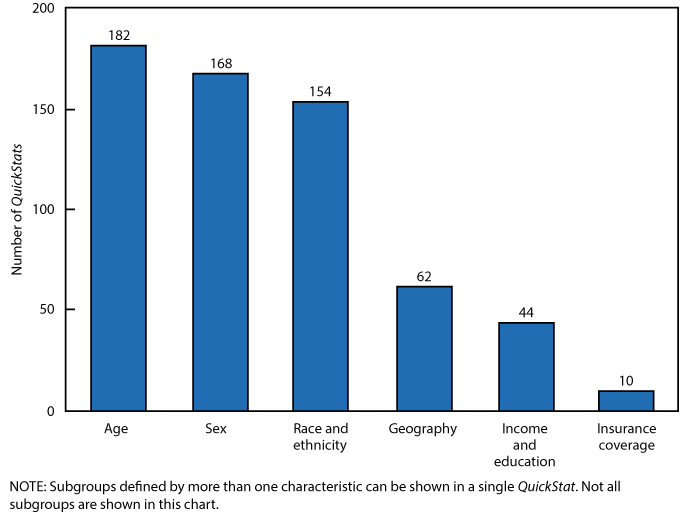
QuickStats can show trends for the total population or for subgroups (99 QuickStats show trends), or can provide information for population subgroups for 1 year or a group of years combined. The subgroups most frequently shown in QuickStats include those defined by age (182 QuickStats), sex (168), and race and ethnicity (154). Geographic classifications, such as state and region, were used in 62 QuickStats, measures of income and education were used in 44, and insurance coverage in 10.
Source: NCHS, QuickStats, 2005–2019, available from: https://www.cdc.gov/nchs/pressroom/quickstats.htm.
Reported by: Alex Strashny, PHD, kpr9@cdc.gov, 301–458–4564; Sandra Smith, MPH, sss4@cdc.gov, 301–458–4513.
View Page In: PDF [161 KB]