Osteoporosis or Low Bone Mass at the Femur Neck or Lumbar Spine in Older Adults: United States, 2005–2008
- Key findings
- In 2005–2008, what was the skeletal status of the noninstitutionalized U.S. population aged 50 years and over based on bone mineral density at either the femur neck or lumbar spine?
- What is the prevalence of osteoporosis or low bone mass at the femur neck or the lumbar spine when considered separately?
- What is the prevalence of osteoporosis or low bone mass at either the femur neck or lumbar spine by age?
- Does the prevalence of osteoporosis or low bone mass at either the femur neck or lumbar spine differ by sex?
- Does the prevalence of osteoporosis or low bone mass at the femur neck or lumbar spine differ by race and ethnicity in men?
- Does the prevalence of osteoporosis or low bone mass at the femur neck or lumbar spine differ by race and ethnicity in women?
- Summary
- Definitions
- Data source and methods
- About the authors
- References
- Suggested citation
NCHS Data Brief No. 93, April 2012
PDF Version (748 KB)
Anne C. Looker, Ph.D.; Lori G. Borrud, Ph.D.; Bess Dawson-Hughes, M.D.; John A. Shepherd, Ph.D.; and Nicole C. Wright, Ph.D.
Key findings
Data from the National Health and Nutrition Examination Survey, 2005–2008
- Nine percent of adults aged 50 years and over had osteoporosis, as defined by the World Health Organization, at either the femur neck or lumbar spine. About one-half had low bone mass at either site, while 48% had normal bone mass at both sites.
- Estimates of poor skeletal status at the femur neck or lumbar spine when considered alone were not the same as estimates based on the two skeletal sites together because some individuals had the condition at one site but not the other.
- The prevalence of osteoporosis or low bone mass at either the femur neck or lumbar spine differed by age, sex, and race and ethnicity. The prevalence was higher in women and increased with age. Differences between racial and ethnic groups varied by sex and skeletal status category.
Many current clinical guidelines recommend that assessment of osteoporosis or low bone mass, as defined by the World Health Organization (WHO) (1), be based on bone mineral density at either the femur neck region of the proximal femur (hip) or the lumbar spine (2,3). This data brief presents the most recent national data on osteoporosis or low bone mass at either the femur neck or lumbar spine among older adults in the United States population based on these WHO categories. Results are presented by age, sex, and race and ethnicity.
Keywords: femur neck, lumbar spine, osteoporosis, low bone mass
In 2005–2008, what was the skeletal status of the noninstitutionalized U.S. population aged 50 years and over based on bone mineral density at either the femur neck or lumbar spine?
Nine percent of persons aged 50 years and over had osteoporosis at either the femur neck or lumbar spine in 2005–2008 (Figure 1). Roughly one-half of older adults in the population had low bone mass at either the femur neck or lumbar spine. Forty-eight percent of older adults in the United States had normal bone density at both the femur neck and lumbar spine.
Figure 1. Skeletal status of persons aged 50 years and over: United States, 2005–2008
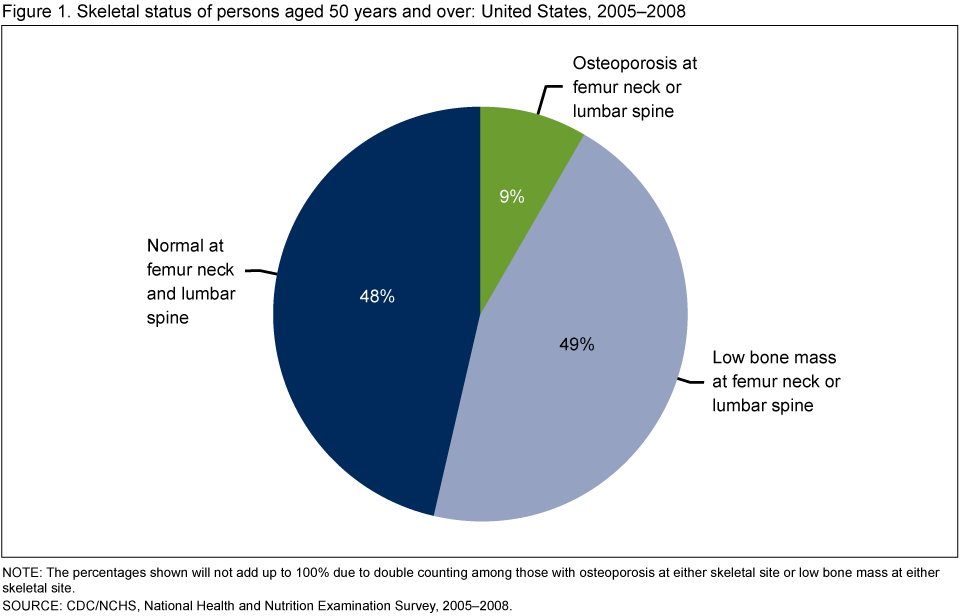
NOTE: The percentages shown will not add up to 100% due to double counting among those with osteoporosis at either skeletal site or low bone mass at either skeletal site.
SOURCE: CDC/NCHS, National Health and Nutrition Examination Survey, 2005–2008.
What is the prevalence of osteoporosis or low bone mass at the femur neck or the lumbar spine when considered separately?
The prevalence of osteoporosis at the femur neck is 5% and the prevalence of osteoporosis at the lumbar spine is 6% (Figure 2). The prevalence estimates of low bone mass at the femur neck or lumbar spine when considered separately are 39% and 27%, respectively. These prevalence estimates are not the same as the prevalence of osteoporosis or low bone mass at either the femur neck or lumbar spine when considered together. This occurs because the prevalence of osteoporosis or low bone mass at either the femur neck or lumbar spine includes some individuals who have the condition at one of the two skeletal sites but not the other. In specific, the prevalence of osteoporosis at either the femur neck or lumbar spine is 9%, which consists of 4% with osteoporosis at the lumbar spine only, 3% with osteoporosis at the femur neck only, and 2% with osteoporosis at both the lumbar spine and femur neck. The prevalence of low bone mass at either skeletal site is 49%, which consists of 10% with low bone mass at the lumbar spine, 22% with low bone mass at the femur neck, and 17% with low bone mass at both the lumbar spine and femur neck.
Figure 2. Osteoporosis or low bone mass at the femur neck only, lumbar spine only, or either site in adults aged 50 years and over
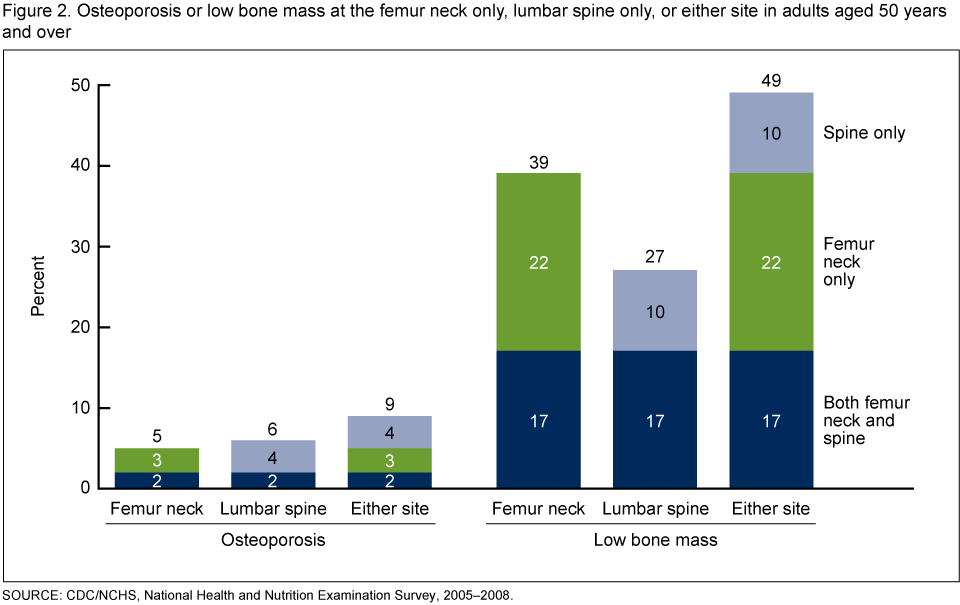
SOURCE: CDC/NCHS, National Health and Nutrition Examination Survey, 2005–2008.
What is the prevalence of osteoporosis or low bone mass at either the femur neck or lumbar spine by age?
The prevalence of osteoporosis at either skeletal site by age ranged from 3% to 10% in men and 7%–35% in women (Figure 3). In men, the prevalence of osteoporosis did not increase with age until aged 80 years and over, but in women, it increased for each decade after age 50 years. The prevalence of low bone mass at either skeletal site by age ranged from 32% to 60% in men and 54%–67% in women. In men, the prevalence of low bone mass did not increase with age until aged 70 years, after which it increased progressively. In women, the prevalence of low bone mass increased until age 70 years, after which it remained stable.
Figure 3. Osteoporosis or low bone mass at the femur neck or lumbar spine, by age in adults aged 50 years and over
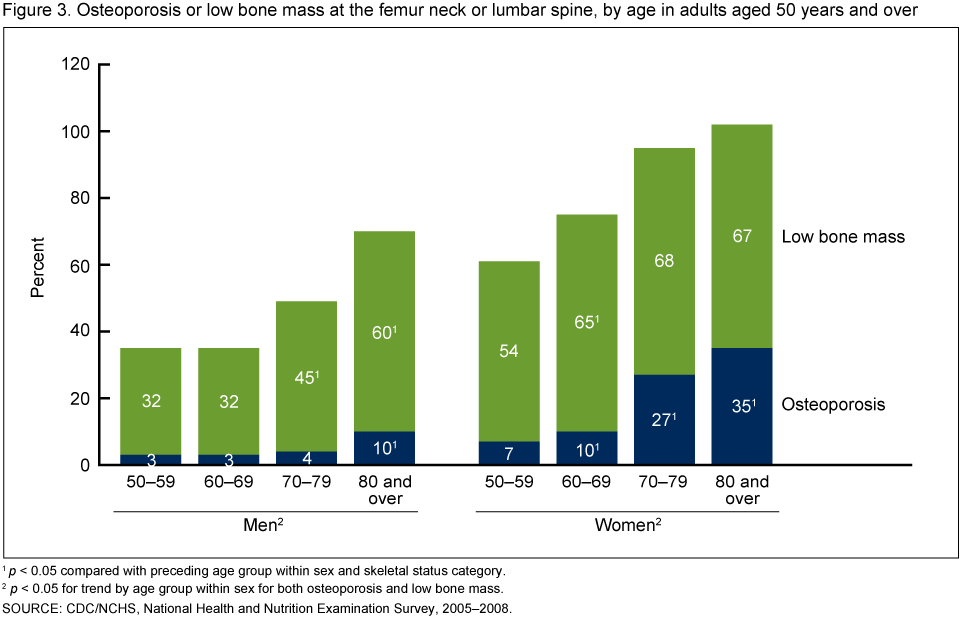
1p < 0.05 compared with preceding age group within sex and skeletal status category.
2p < 0.05 for trend by age group within sex for both osteoporosis and low bone mass.
SOURCE: CDC/NCHS, National Health and Nutrition Examination Survey, 2005–2008.
Does the prevalence of osteoporosis or low bone mass at either the femur neck or lumbar spine differ by sex?
The prevalence of osteoporosis or low bone mass at either the femur neck or lumbar spine is higher in women than men in each decade (Figure 3) or when compared overall for aged 50 years and over after adjusting for age differences between the two sexes (Figure 4). The age-adjusted prevalence of osteoporosis at either skeletal site was 16% in women compared with 4% in men (Figure 4). The age-adjusted prevalence of low bone mass at either skeletal site was 61% in women compared with 38% in men (Figure 4).
Figure 4. Osteoporosis or low bone mass at the femur neck or lumbar spine, by sex in adults aged 50 years or over
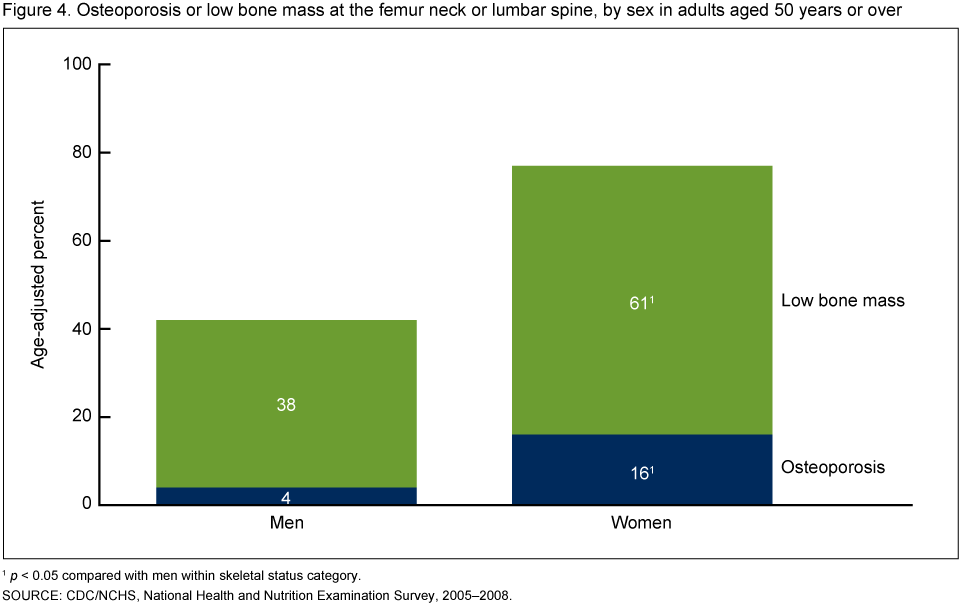
1p < 0.05 compared with men within skeletal status category.
SOURCE: CDC/NCHS, National Health and Nutrition Examination Survey, 2005–2008.
Does the prevalence of osteoporosis or low bone mass at the femur neck or lumbar spine differ by race and ethnicity in men?
The prevalence of osteoporosis or low bone mass at either skeletal site differ by race and ethnicity in men after adjusting for age differences between the racial and ethnic groups (Figure 5). The age-adjusted prevalence of osteoporosis at either skeletal site in men of other races (9%) was higher than the prevalence in non-Hispanic white men (4%). The age-adjusted prevalence of low bone mass at either skeletal site was lower in non-Hispanic black men (24%) compared with non-Hispanic white men (39%).
Figure 5. Osteoporosis or low bone mass at the femur neck or lumbar spine, by race and ethnicity in men aged 50 years and over
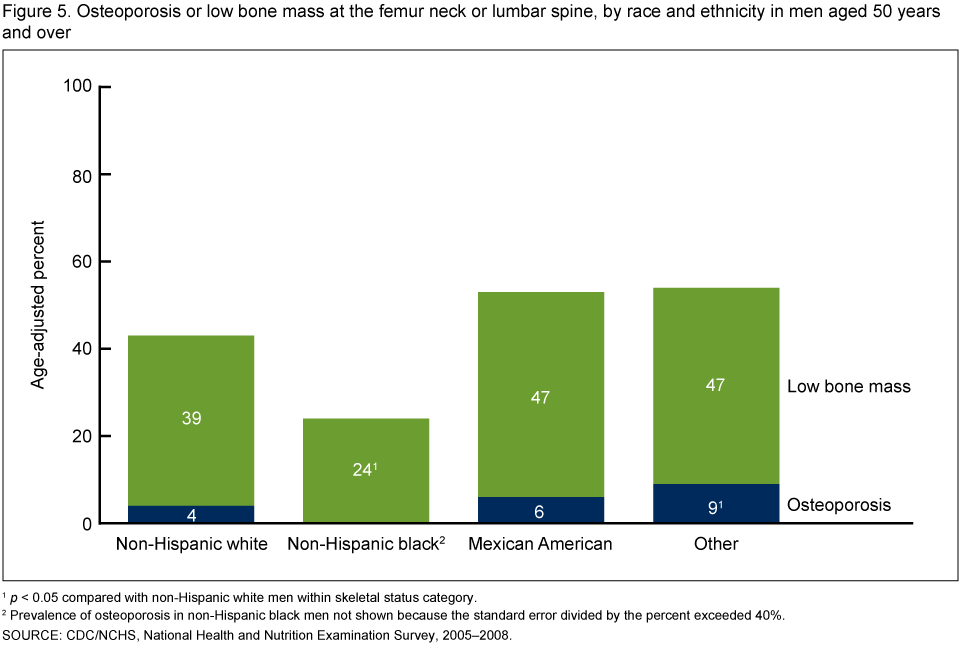
1p < 0.05 compared with non-Hispanic white men within skeletal status category.
2Prevalence of osteoporosis in non-Hispanic black men not shown because the standard error divided by the percent exceeded 40%.
SOURCE: CDC/NCHS, National Health and Nutrition Examination Survey, 2005–2008.
Does the prevalence of osteoporosis or low bone mass at the femur neck or lumbar spine differ by race and ethnicity in women?
The prevalence of osteoporosis or low bone mass at either the femur neck or lumbar spine differ by race and ethnicity in women after adjusting for age differences between the racial and ethnic groups (Figure 6). When compared with the age-adjusted prevalence of osteoporosis in non-Hispanic white women (15%), the age-adjusted prevalence of osteoporosis at either skeletal site is higher in Mexican-American women (26%) and lower in non-Hispanic black women (9%). When compared with the age-adjusted prevalence in non-Hispanic white women (62%), the age-adjusted prevalence of low bone mass at either skeletal site is higher in women of other races (72%) and lower in non-Hispanic black women (44%).
Figure 6. Osteoporosis or low bone mass at the femur neck or lumbar spine, by race and ethnicity in women aged 50 years and over
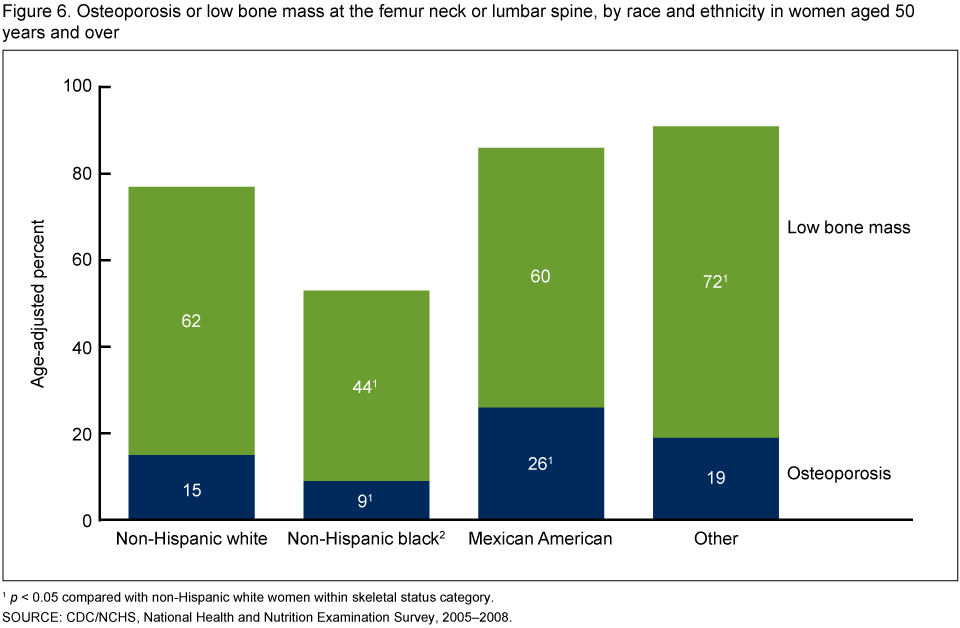
1p < 0.05 compared with non-Hispanic white women within skeletal status category.
SOURCE: CDC/NCHS, National Health and Nutrition Examination Survey, 2005–2008.
Summary
Nine percent of adults over age 50 years had osteoporosis at either the femur neck or lumbar spine and roughly one-half had low bone mass at either of these two skeletal sites. Having osteoporosis raises the risk of experiencing fractures (1,2). The prevalence of osteoporosis or low bone mass at either the femur neck or lumbar spine was not the same as the prevalence of these conditions when the two skeletal sites were considered separately because some individuals had these conditions at one of the skeletal sites but not the other. The prevalence of osteoporosis or low bone mass differed by age, sex, and race and ethnicity. The prevalence was higher in women and increased with age. Differences by race and ethnicity varied depending on sex and skeletal status category, but when compared with non-Hispanic white persons, Mexican-American persons, and persons of other races tended to be at higher risk, and non-Hispanic black persons tended to be at lower risk of either osteoporosis or low bone mass at the femur neck or lumbar spine.
Definitions
Low bone mass: A value for bone mineral density more than 1 standard deviation (SD) below the young female adult mean but less than 2.5 SD below this value (1).
Osteoporosis: A value for bone mineral density 2.5 SD or more below the young female adult mean (1).
Young female adult mean and standard deviation (SD): For the femur neck, the mean and SD were based on data for 20–29-year-old non-Hispanic white females from the Third National Health and Nutrition Examination Survey (NHANES III) (4). For the lumbar spine, the mean and SD were based on data for 30-year-old white women from the dual-energy x-ray absorptiometry densitometer manufacturer (5).
Other races: Persons from racial and ethnic groups other than non-Hispanic white, non-Hispanic black, or Mexican American. This group consists primarily of Hispanic persons other than Mexican American, Asian, Native American, and multiracial persons, among others.
Data source and methods
The National Health and Nutrition Examination Survey (NHANES) data were used for these analyses. NHANES is a cross-sectional survey designed to monitor the health and nutritional status of the civilian, noninstitutionalized U.S. population (6). The survey consists of interviews conducted in participants’ homes and standardized physical examinations that include laboratory tests utilizing blood and urine specimens provided by participants during the physical examination.
The NHANES sample is selected through a complex, multistage design that includes selection of primary sampling units (counties), household segments within the counties, and finally sample persons from selected households. The sample design includes oversampling to obtain reliable estimates of health and nutritional measures for population subgroups. In 1999, NHANES became a continuous survey, fielded on an ongoing basis. Each year of data collection is based on a representative sample covering all ages of the civilian, noninstitutionalized population. Public-use data files are released in 2-year cycles.
Sample weights, which account for the differential probabilities of selection, nonresponse, and noncoverage, were incorporated into the estimation process. The standard errors of the percentages were estimated using Taylor Series Linearization, a method that incorporates the sample weights and sample design. Prevalence estimates were age adjusted to the 2000 U.S. standard population using the following age groups: 50–59, 60–69, 70–79, and aged 80 years and over. Differences between groups were evaluated using a t-statistic at the p < 0.05 significance level. Tests of trends were done using the p < 0.05 significance level. All results presented have a relative standard error less than 30%. All differences reported are statistically significant unless otherwise indicated. Statistical analyses were conducted using the SAS System for Windows (release 9.2; SAS Institute Inc., Cary, N.C.) and SUDAAN (release 10.0; Research Triangle Institute, Research Triangle Park, N.C.).
About the authors
Anne C. Looker and Lori G. Borrud are with the Centers for Disease Control and Prevention’s National Center for Health Statistics, Division of Health and Nutrition Examination Surveys. Bess Dawson-Hughes is with the USDA Nutrition Center at Tufts University. John A. Shepherd is with the Department of Radiology at the University of California at San Francisco. Nicole C. Wright is with the Department of Epidemiology at the University of Alabama at Birmingham.
References
- Kanis JA, McCloskey EV, Johansson H, et al. A reference standard for the description of osteoporosis. Bone 42(4) 67–75. 2008.
- National Osteoporosis Foundation. Clinician’s Guide to Prevention and Treatment of Osteoporosis. National Osteoporosis Foundation, Washington, DC. 1–36. 2008.
- Baim S, Binkley N, Bilezikian JP, Kendler DL, et al. Official positions of the International Society for Clinical Densitometry and executive summary of the 2007 ISCD Position Development Conference. J Clin Densitom 11:75–91. 2008.
- Looker AC, Wahner HW, Dunn WL, Calvo MS, et al. Updated data on proximal femur bone mineral levels of U.S. adults. Osteoporos Int 8:468–89. 1998.
- Kelly TJ. Bone mineral density reference databases for American men and women. J Bone Miner Res 5 (Suppl1):S249. 1990.
- Centers for Disease Control and Prevention, National Center for Health Statistics. 1999 – Current National Health and Nutrition Examination Survey (NHANES). Accessed March 12, 2012. 1990.
Suggested citation
Looker AC, Borrud LG, Dawson-Hughes B, Shepherd JA, Wright NC. Osteoporosis or low bone mass at the femur neck or lumbar spine in older adults: United States, 2005–2008. NCHS data brief no 93. Hyattsville, MD: National Center for Health Statistics. 2012.
Copyright information
All material appearing in this report is in the public domain and may be reproduced or copied without permission; citation as to source, however, is appreciated.
National Center for Health Statistics
Edward J. Sondik, Ph.D., Director
Jennifer H. Madans, Ph.D., Associate Director for Science
Division of Health Care Statistics
Clifford L. Johnson, M.S.P.H., Director