Vitamin D Status: United States, 2001–2006
- Key findings
- In 2001–2006, what was the vitamin D status of the U.S. population based on the IOM thresholds for serum 25OHD?
- What is the prevalence of serum 25OHD values indicating risk of deficiency, by age and sex?
- What is the prevalence of serum 25OHD values indicating risk of inadequacy, by age and sex?
- Does the prevalence of serum 25OHD values indicating risk of deficiency and inadequacy differ by sex or race and ethnicity? Among women of childbearing age, does this prevalence differ by pregnancy and lactation status?
- Has the prevalence at risk of deficiency and inadequacy changed since the 1990s?
- Summary
- Definitions
- Data source and methods
- About the authors
- References
- Suggested citation
NCHS Data Brief No. 59, March 2011
Anne C. Looker, Ph.D.; Clifford L. Johnson, M.P.H.; David A. Lacher, M.D.; Christine M. Pfeiffer, Ph.D.; Rosemary L. Schleicher, Ph.D.; and Christopher T. Sempos, Ph.D.
Key findings
Data from the National Health and Nutrition Examination Surveys (NHANES)
- In 2001–2006, two-thirds of the population had sufficient vitamin D, defined by the Institute of Medicine as a serum 25-hydroxyvitamin D (25OHD) value of 50–125 nmol/L. About one-quarter were at risk of vitamin D inadequacy (serum 25OHD 30–49 nmol/L), and 8% were at risk of vitamin D deficiency (serum 25OHD less than 30 nmol/L).
- The risk of vitamin D deficiency differed by age, sex, and race and ethnicity. The prevalence was lower in persons who were younger, male, or non-Hispanic white. Among women, the prevalence at risk was also lower in pregnant or lactating women.
- The risk of vitamin D deficiency increased between 1988–1994 and 2001–2002 in both sexes but did not change between 2001–2002 and 2005–2006.
The Institute of Medicine (IOM) recently released new dietary reference intakes for calcium and vitamin D (1). The IOM defined four categories of vitamin D status based on serum 25-hydroxyvitamin D (25OHD): (i) risk of deficiency, (ii) risk of inadequacy, (iii) sufficiency, and (iv) above which there may be reason for concern (1). This brief presents the most recent national data on vitamin D status in the U.S. population based on these IOM categories. Results are presented by age, sex, race and ethnicity, and, for women, by pregnancy and lactation status.
Keywords: serum 25-hydroxyvitamin D, prevalence, deficiency, inadequacy
In 2001–2006, what was the vitamin D status of the U.S. population based on the IOM thresholds for serum 25OHD?
In 2001–2006, two-thirds (67%) of persons aged 1 year and over had serum 25OHD values considered sufficient (Figure 1). Roughly one quarter of the population had serum 25OHD values that put them at risk of inadequacy. Eight percent were at risk of deficiency, and 1% had a high serum 25OHD value that may possibly be harmful. Serum 25OHD percentile values, which provide a more detailed description of the serum 25OHD distribution in the U.S. population, are shown in the Table.
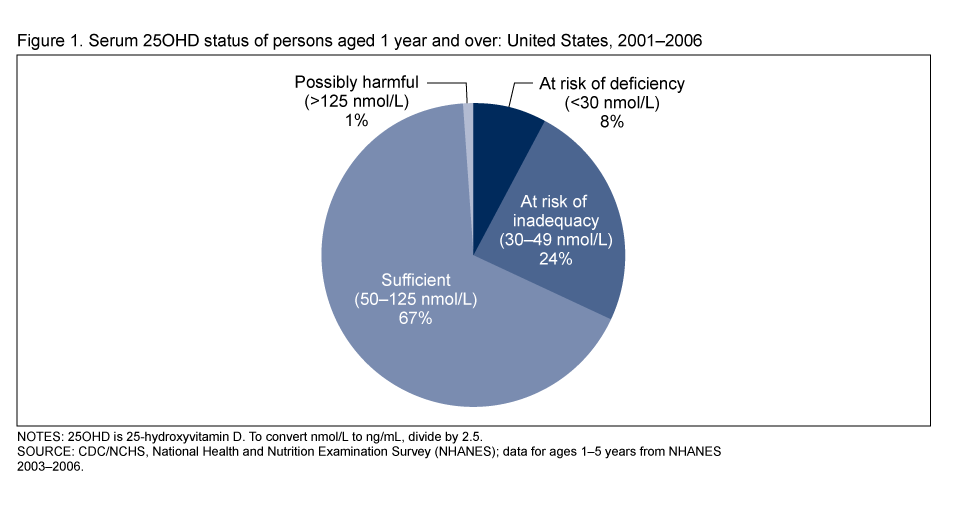
Table a. Selected percentile values for serum 25-hydroxyvitamin D (25OHD) among males, by age: United States, 2001–2006
| Serum 25OHD (nmol/L) percentile | ||||||||
|---|---|---|---|---|---|---|---|---|
| Age (years) | n | 5th | 10th | 25th | 50th | 75th | 90th | 95th |
| 1–3 | 581 | 40.7 | 48.3 | 58.2 | 69.5 | 84.4 | 94.7 | 101.0 |
| 4–8 | 970 | 42.6 | 47.8 | 58.0 | 67.3 | 78.8 | 92.0 | 99.9 |
| 9–13 | 1,473 | 32.5 | 40.4 | 49.9 | 62.1 | 74.5 | 87.4 | 98.5 |
| 14–18 | 1,978 | 25.3 | 33.0 | 45.7 | 58.5 | 71.2 | 84.9 | 95.7 |
| 19–30 | 1,611 | 23.0 | 29.4 | 41.9 | 55.3 | 68.7 | 83.6 | 94.3 |
| 31–50 | 2,244 | 25.1 | 31.3 | 44.2 | 57.4 | 71.5 | 84.5 | 94.3 |
| 51–70 | 1,853 | 25.6 | 32.7 | 44.1 | 58.1 | 71.3 | 83.7 | 91.8 |
| Over 70 | 1,217 | 25.4 | 31.7 | 44.6 | 57.2 | 69.7 | 82.7 | 90.1 |
SOURCE: CDC/NCHS, National Health and Nutrition Examination Survey (NHANES), 2001–2006; data for ages 1–5 years from NHANES 2003–2006.
Table b. Selected percentile values for serum 25-hydroxyvitamin D (25OHD) among female , by age and by pregnancy and lactation status: United States, 2001–2006
| Serum 25OHD (nmol/L) percentile | ||||||||
|---|---|---|---|---|---|---|---|---|
| Age (years) | n | 5th | 10th | 25th | 50th | 75th | 90th | 95th |
| 1–3 | 584 | 43.3 | 49.8 | 58.5 | 68.3 | 79.4 | 89.2 | 94.9 |
| 4–8 | 989 | 38.4 | 44.2 | 54.5 | 67.2 | 80.0 | 93.4 | 101.0 |
| 9–13 | 1,515 | 27.7 | 34.6 | 46.3 | 57.6 | 68.4 | 80.9 | 87.5 |
| 14–18 | 1,823 | 20.8 | 27.2 | 41.1 | 57.2 | 71.6 | 87.1 | 104.0 |
| 19–30 | 1,346 | 18.5 | 25.4 | 40.0 | 55.9 | 76.2 | 95.6 | 111.0 |
| 31–50 | 2,097 | 19.2 | 25.3 | 38.9 | 55.3 | 71.0 | 87.6 | 101.0 |
| 51–70 | 1,866 | 21.2 | 27.0 | 39.7 | 54.7 | 69.7 | 85.4 | 93.4 |
| Over 70 | 1,197 | 22.6 | 27.1 | 40.5 | 55.5 | 69.6 | 84.1 | 93.6 |
| Pregnant or lactating | 1,067 | 24.5 | 31.4 | 44.5 | 62.4 | 78.2 | 94.7 | 109.0 |
SOURCE: CDC/NCHS, National Health and Nutrition Examination Survey (NHANES), 2001–2006; data for ages 1–5 years from NHANES 2003–2006.
What is the prevalence of serum 25OHD values indicating risk of deficiency, by age and sex?
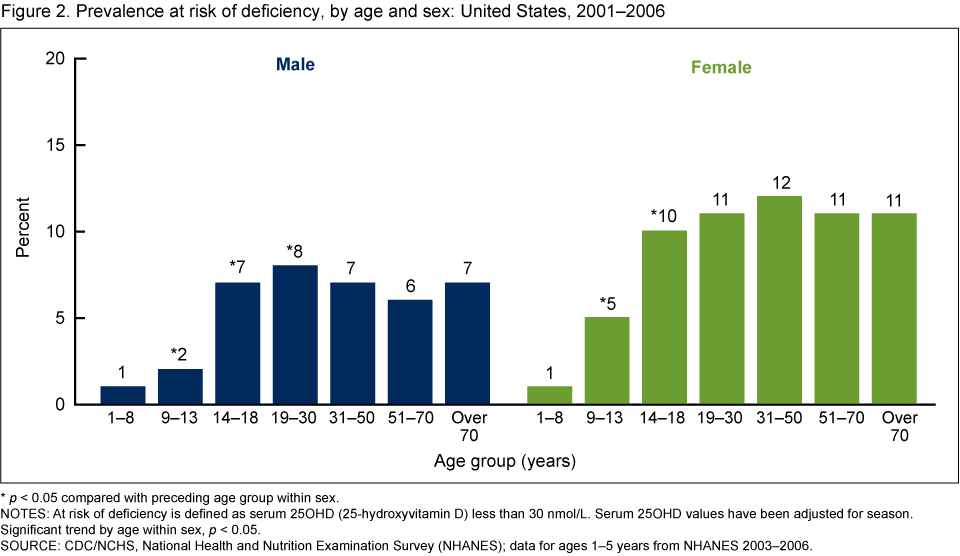
The season-adjusted prevalence at risk of deficiency by age ranged from 1% to 8% in males and 1% to 12% in females (Figure 2). In both sexes, the prevalence was lowest in children aged 1–8 years. Risk of deficiency increased significantly with age until age 30 in males and age 18 in females, after which it did not change significantly with age.
What is the prevalence of serum 25OHD values indicating risk of inadequacy, by age and sex?
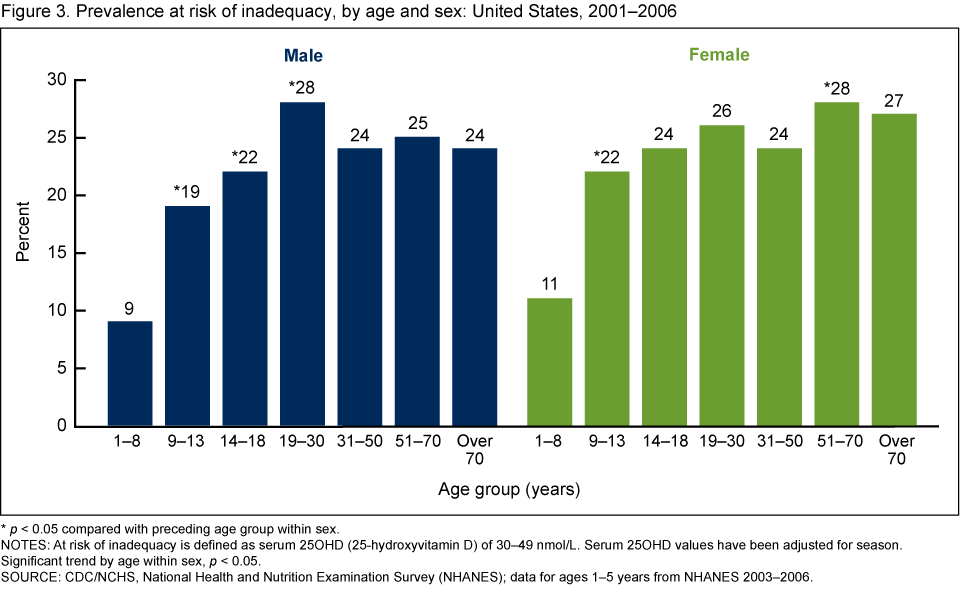
The season-adjusted prevalence at risk of inadequacy by age ranged from 9% to 28% in males and 11% to 28% in females (Figure 3). In both sexes, the prevalence was lowest in children aged 1–8 years. Risk of inadequacy increased significantly with age until age 30 in males, after which it did not change further with age. Risk of inadequacy increased significantly with age until age 14 years in females. After age 14, risk of inadequacy among females remained constant until age 51, when it increased significantly. After the increase at age 51, risk of inadequacy remained stable in females.
Does the prevalence of serum 25OHD values indicating risk of deficiency and inadequacy differ by sex or race and ethnicity? Among women of childbearing age, does this prevalence differ by pregnancy and lactation status?
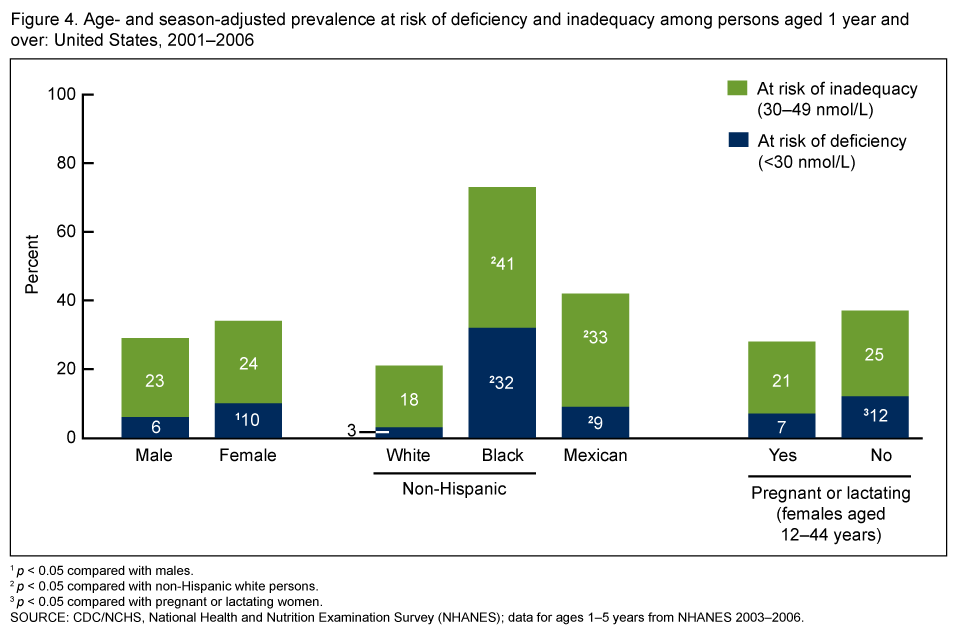
Males were less likely to be at risk of deficiency than females, after adjusting for age and season (Figure 4). The age- and season-adjusted prevalence at risk of inadequacy did not differ by sex. Non-Hispanic white persons were less likely to be at risk of deficiency or at risk of inadequacy than non-Hispanic black or Mexican-American persons, after adjusting for age and season. According to IOM (1), interpretation of serum 25OHD thresholds for risk of deficiency or inadequacy in nonwhite persons is uncertain because many nonwhite groups have better skeletal status than white persons despite having lower serum 25OHD values. Among women of childbearing age, those who were pregnant or lactating were less likely to be at risk of deficiency than women who were not pregnant or lactating, after adjusting for age and season. The age- and season-adjusted prevalence at risk of inadequacy did not differ by pregnancy and lactation status in women of childbearing age.
Has the prevalence at risk of deficiency and inadequacy changed since the 1990s?
In 1988–1994, 3% of males aged 12 years and over had serum 25OHD values that put them at risk of deficiency, after adjusting for age and season; in comparison, the age- and season-adjusted prevalence at risk of deficiency in 2001–2002 increased to 7% (Figure 5). The corresponding figures for those at risk of inadequacy were 20% and 24%, respectively. The age- and season-adjusted prevalence at risk of deficiency or inadequacy did not change between 2001–2002 and 2005–2006 in adolescent and adult men.
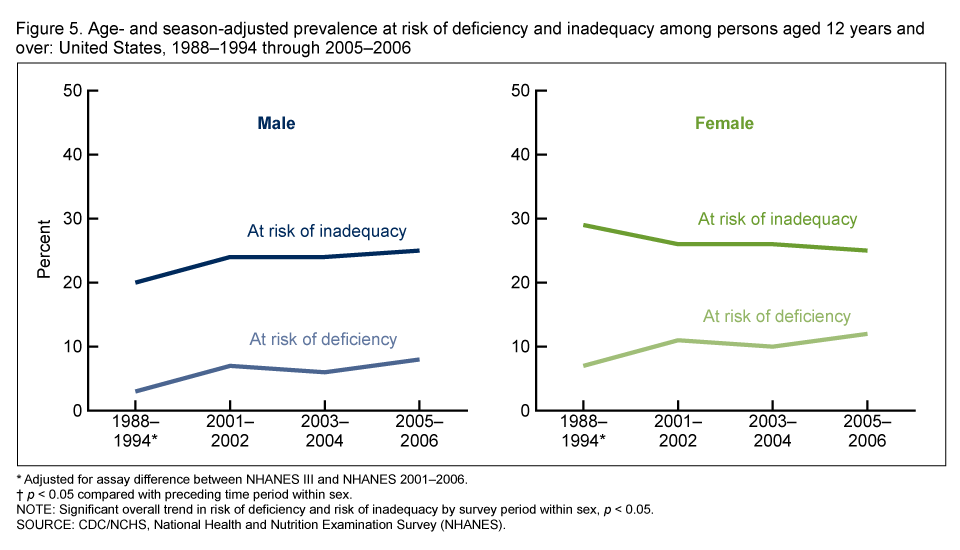
The age- and season-adjusted prevalence at risk of deficiency also increased between 1988–1994 and 2001–2002 among females aged 12 years and over (Figure 5). In 1988–1994, 7% of females aged 12 and over were at risk of deficiency, after adjusting for age and season, compared with 11% in 2001–2002. However, the age- and season-adjusted prevalence of adolescent and adult women at risk of inadequacy decreased from 29% in 1988–1994 to 26% in 2001–2002. The age- and season-adjusted prevalence at risk of deficiency or inadequacy did not change between 2001–2002 and 2005–2006 in adolescent and adult women.
Summary
Most persons in the United States are sufficient in vitamin D, based on serum 25OHD thresholds proposed by IOM. Roughly one-quarter were at risk of inadequacy and 8% were at risk of deficiency. The prevalence at risk of deficiency or inadequacy differed by age, sex, and race and ethnicity. Groups at lower risk included children, males, non-Hispanic white persons, and pregnant or lactating women. Between 1988–1994 and 2001–2002, the prevalence at risk of deficiency increased in adolescents and adults of both sexes, but the prevalence at risk of deficiency or inadequacy did not change between 2001–2002 and 2005–2006.
Definitions
At risk of vitamin D deficiency: Serum 25OHD less than 30 nmol/L (12 ng/mL) (1).
At risk of vitamin D inadequacy: Serum 25OHD 30–49 nmol/L (12–19 ng/mL) (1).
Sufficient in vitamin D: Serum 25OHD 50–125 nmol/L (20–50 ng/mL) (1).
Possibly harmful vitamin D: Serum 25OHD greater than 125 nmol/L (50 ng/mL) (1).
Season: Two categories, based on month of blood draw: November–March and April–October. Season is important to consider for two reasons: (i) vitamin D is produced in the skin by sunlight exposure, so it varies by season; and (ii) for practical reasons, data are collected in NHANES in the South during the winter and North during the summer.
NHANES III (1988–1994) serum 25OHD adjustment: The assay method used to measure serum 25OHD in NHANES III differed from the method used in NHANES 2001–2006. A statistical adjustment was applied to the NHANES III serum 25OHD so that the data could be validly compared with serum 25OHD from NHANES 2001–2006. Details about the adjustment have been published elsewhere (2).
Data source and methods
NHANES data were used for these analyses. NHANES is a cross-sectional survey designed to monitor the health and nutritional status of the civilian noninstitutionalized U.S. population (3). The survey consists of interviews conducted in participants’ homes and standardized physical examinations that include laboratory tests utilizing blood and urine specimens provided by participants during the examination.
The NHANES sample is selected through a complex, multistage design that includes selection of primary sampling units (counties), household segments within the counties, and finally sample persons from selected households. The sample design includes oversampling to obtain reliable estimates of health and nutritional measures for population subgroups. In 1988–1994 and 2001–2006, non-Hispanic black and Mexican-American persons were oversampled. In 1999, NHANES became a continuous survey, fielded on an ongoing basis. Each year of data collection is based on a representative sample covering all ages of the civilian noninstitutionalized population. Public-use data files are released in 2-year cycles.
Sample weights, which account for the differential probabilities of selection, nonresponse, and noncoverage, were incorporated into the estimation process. The standard errors of the percentages were estimated using Taylor series linearization, a method that incorporates the sample weights and sample design. Prevalence estimates were statistically adjusted for age when making comparisons by sex, race and ethnicity, and pregnancy or lactation status. Serum 25OHD data were statistically adjusted for season when making comparisons by age, sex, race and ethnicity, and pregnancy or lactation status, to control for differences in the time of year when blood was drawn in different groups. Differences between groups were evaluated using a t statistic at the p < 0.05 significance level. Tests of trends were done using the p < 0.05 significance level. All results presented have a relative standard error less than 30%. All differences reported are statistically significant unless otherwise indicated. Statistical analyses were conducted using the SAS System for Windows (release 9.2; SAS Institute, Cary, NC) and SUDAAN (release 10.0; Research Triangle Institute, Research Triangle Park, NC).
About the authors
Anne C. Looker, Clifford L. Johnson, and David A. Lacher are with the Centers for Disease Control and Prevention’s (CDC) National Center for Health Statistics, Division of Health and Nutrition Examination Surveys. Christine M. Pfeiffer and Rosemary L. Schleicher are with CDC’s National Center for Environmental Health, Division of Laboratory Sciences. Christopher T. Sempos is with the National Institutes of Health, Office of Dietary Supplements.
References
- Institute of Medicine. Dietary reference intakes for calcium and vitamin D. Washington, DC: National Academies Press. 2010.
- Looker AC, Pfeiffer CM, Lacher DA, Schleicher RL, Picciano MF, Yetley EA. Serum 25-hydroxyvitamin D status of the U.S. population: 1988–1994 compared with 2000–2004. Am J Clin Nutr 88(6):1519–27. 2008.
- National Center for Health Statistics. National Health and Nutrition Examination Survey, 2001–2006.
Suggested citation
Looker AC, Johnson CL, Lacher DA, et al. Vitamin D status: United States 2001–2006. NCHS data brief, no 59. Hyattsville, MD: National Center for Health Statistics. 2011.
Copyright information
All material appearing in this report is in the public domain and may be reproduced or copied without permission; citation as to source, however, is appreciated.
National Center for Health Statistics
Edward J. Sondik, Ph.D., Director
Jennifer H. Madans, Ph.D., Associate Director for Science
Division of Health and Nutrition Examination Surveys
Clifford L. Johnson, M.S.P.H., Director