Prevalence and Severity of Dental Fluorosis in the United States, 1999-2004
- Key findings
- Less than one-quarter of persons aged 6-49 had dental fluorosis.
- Prevalence of dental fluorosis was higher among younger persons and ranged from 41% among adolescents aged 12-15 to 9% among adults aged 40-49.
- Children aged 12-15 in 1999-2004 had higher prevalence of dental fluorosis compared with the same aged children in 1986-1987.
- Summary
- Definitions
- Data source and methods
- About the authors
- References
- Suggested citation
NCHS Data Brief No. 53, November 2010
PDF Version (848 KB)
Eugenio D. Beltrán-Aguilar, D.M.D., M.S., Dr.P.H.; Laurie Barker, M.S.P.H.; and Bruce A. Dye, D.D.S., M.P.H.
Key findings
Data from the National Health and Nutrition Examination Survey, 1999-2004 and the 1986-1987 National Survey of Oral Health in U.S. School Children
- Less than one-quarter of persons aged 6-49 in the United States had some form of dental fluorosis.
- The prevalence of dental fluorosis was higher in adolescents than in adults and highest among those aged 12-15.
- Adolescents aged 12-15 in 1999-2004 had a higher prevalence of dental fluorosis than adolescents aged 12-15 in 1986-1987.
Dental fluorosis refers to changes in the appearance of tooth enamel that are caused by long-term ingestion of fluoride during the time teeth are forming (1). Studies conducted in the 1930s showed that the severity of tooth decay was lower and dental fluorosis was higher in areas with more fluoride in the drinking water (2). In response to these findings, community water fluoridation programs were developed to add fluoride to drinking water to reach an optimal level for preventing tooth decay, while limiting the chance of developing dental fluorosis (3). By the 1980s, studies in selected U.S. communities reported an increase in dental fluorosis (4,5), paralleling the expansion of water fluoridation and the increased availability of other sources of ingested fluoride, such as fluoride toothpaste (if swallowed) and fluoride supplements (6). This report describes the prevalence of dental fluorosis in the United States and changes in the prevalence and severity of dental fluorosis among adolescents between 1986-1987 and 1999-2004.
Keywords: children, dental public health, National Health and Nutrition Examination Survey, National Survey of Oral Health in U.S. School Children
Less than one-quarter of persons aged 6-49 had dental fluorosis.
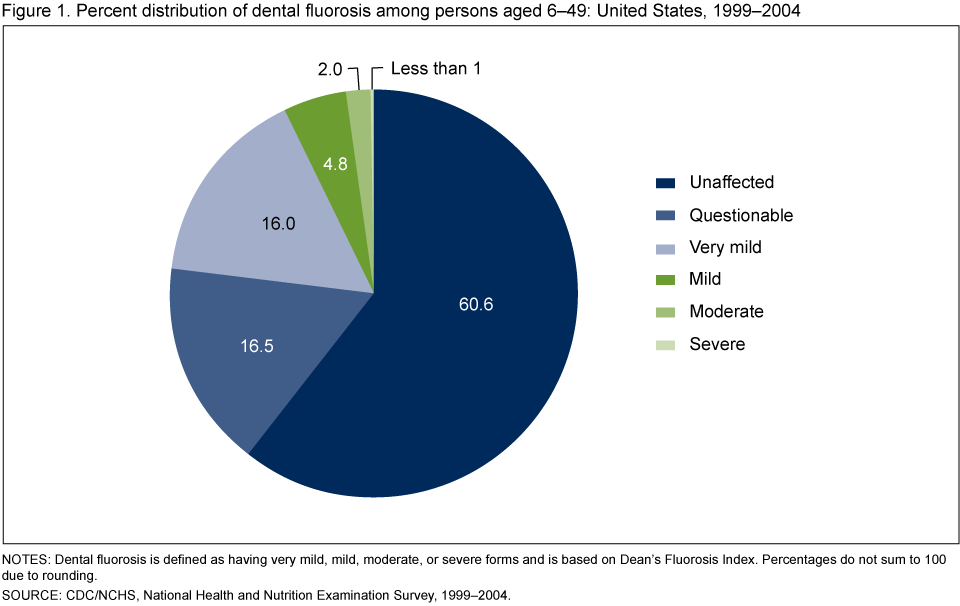
Among persons aged 6-49, 16.0% had very mild fluorosis, 4.8% had mild fluorosis, 2.0% had moderate fluorosis, and less than 1% had severe fluorosis (Figure 1).
For the remaining three-quarters of persons in this age group, 60.6% were unaffected by dental fluorosis and 16.5% were classified as having questionable dental fluorosis.
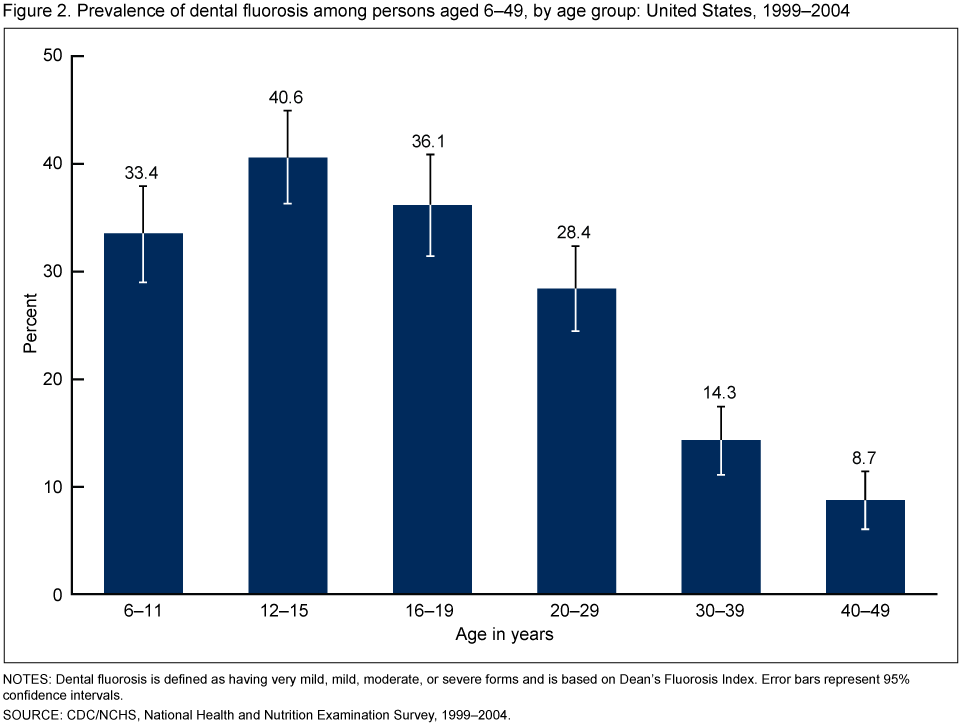
Prevalence of dental fluorosis was higher among younger persons and ranged from 41% among adolescents aged 12-15 to 9% among adults aged 40-49.
Adolescents aged 12-15 had the highest prevalence of dental fluorosis (40.6%) (Figure 2). The prevalence is lower among older age groups. The lowest prevalence was among those aged 40-49 (8.7%). The prevalence of dental fluorosis among children aged 6-11 (33.4%) was lower than the prevalence among those aged 12-15 (40.6%).
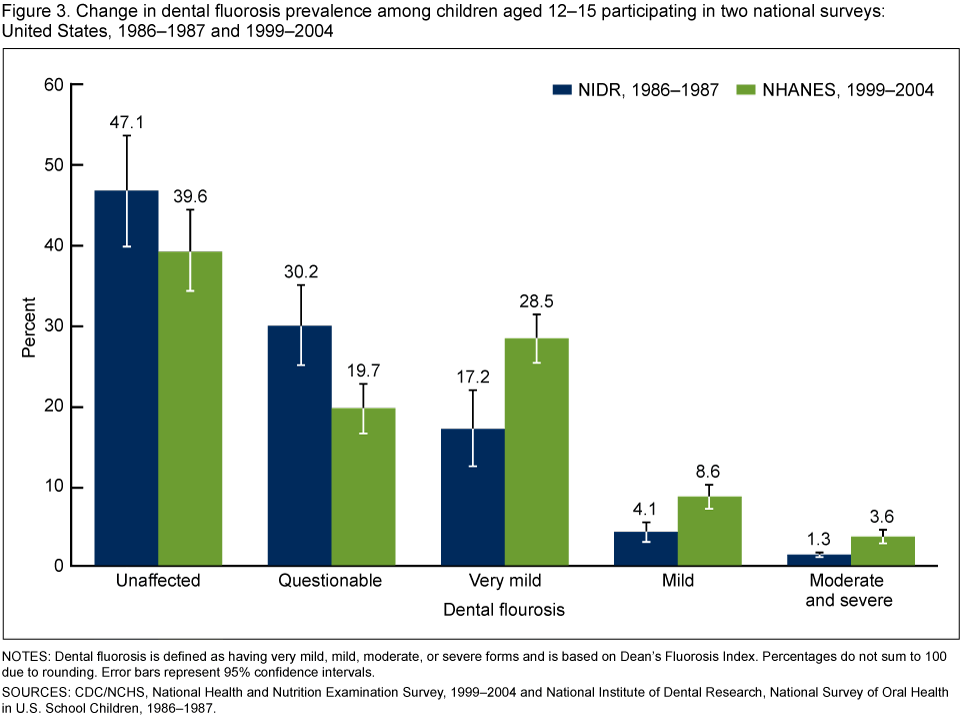
Children aged 12-15 in 1999-2004 had higher prevalence of dental fluorosis compared with the same aged children in 1986-1987.
In 1986-1987, 22.6% of adolescents aged 12-15 had dental fluorosis, whereas in 1999-2004, 40.7% of adolescents aged 12-15 had dental fluorosis (Figure 3). The estimates for severe alone were statistically unreliable.
The prevalence of very mild fluorosis increased from 17.2% to 28.5% and mild fluorosis increased from 4.1% to 8.6%. The prevalence of moderate and severe fluorosis increased from 1.3% to 3.6%.
Summary
Twenty-three percent of persons aged 6-49 had dental fluorosis in 1999-2004. Approximately 2% had moderate dental fluorosis and less than 1% had severe dental fluorosis. Dental fluorosis was most prevalent among children aged 12-15, and less prevalent among older age groups. The prevalence of dental fluorosis among children aged 6-11 was lower than the prevalence among adolescents aged 12-15. This may be explained by an incomplete set of permanent teeth among children aged 6-11; some posterior permanent teeth, including premolars and second molars, erupt between ages 10 and 12.
The levels of very mild, mild, and moderate or severe dental fluorosis were higher among adolescents aged 12-15 in 1999-2004 than in 1986-1987.
In the analyses of changes in prevalence between both national surveys, moderate and severe dental fluorosis were aggregated into one category because all estimates of severe fluorosis were statistically unreliable after stratification (standard error of the percentage was greater than 30% the value of the percentage).
Definitions
Dental fluorosis: Defined as a change in the mineralization of the dental hard tissues (enamel, dentin, and cementum) caused by long-term ingestion (eating and drinking) of fluoride during the period of tooth development prior to eruption into the mouth (first 8 years of life for most permanent teeth excluding third molars). Once the tooth erupts, dental fluorosis refers to a range of visually detectable changes in enamel. Changes range from barely visible lacy white markings in milder cases to converged opaque areas and pitting of the teeth in severe forms. After eruption the pitted areas can become stained yellow to dark brown.
Dean’s Fluorosis Index: Developed in the 1930s by H.T. Dean to assess the prevalence and severity of dental fluorosis in various communities in the United States (2). Major criteria for each category are listed below:
- Unaffected: The enamel is translucent. The surface of the tooth is smooth, glossy, and usually has a pale creamy white color.
- Questionable: The enamel shows slight changes ranging from a few white flecks to occasional white spots. This classification is utilized in those instances in which a definitive determination of the mildest form of fluorosis is not warranted and a classification of unaffected is not justified.
- Very mild: Small opaque paper-white areas are scattered over the tooth surface, but do not involve as much as 25% of the surface.
- Mild: White opaque areas on the surface are more extensive, but do not involve as much as 50% of the surface.
- Moderate: White opaque areas affect more than 50% of the enamel surface.
- Severe: All enamel surfaces are affected. The major aspect of this classification is the presence of discrete or confluent pitting.
Prevalence of dental fluorosis: Defined as the proportion of the population with very mild or higher levels of dental fluorosis, by convention established by H.T. Dean (2). The questionable category is excluded.
Data source and methods
Data from the National Health and Nutrition Examination Survey (NHANES) were used for most of these analyses. NHANES is a cross-sectional survey designed to monitor the health and nutritional status of the civilian noninstitutionalized U.S. population. The oral health exam was conducted in mobile examination centers by trained dentists. In 1999, NHANES became a continuous survey with each year of data collection based on a representative sample covering all ages. The NHANES sample is selected through a complex, multistage design that includes selection of primary sampling units (PSUs) (counties or county equivalents), household segments within the PSUs, and finally, sample persons from selected households. The sample design includes oversampling in order to obtain reliable estimates of health and nutritional measures for population subgroups. In 1999-2004, oversampling included non-Hispanic black and Mexican-American persons as well as adolescents. Visit NHANES for additional information.
Data from the 1986-1987 National Survey of Oral Health in U.S. School Children were also used, which was conducted by the National Institute of Dental Research (NIDR, currently the National Institute of Dental and Craniofacial Research). The oral health exam was conducted using portable dental equipment on the school premises by trained dentists. The 1986-1987 NIDR sample was selected through a multistage design that included selection of school districts, schools, and classrooms. Because the 1986-1987 NIDR survey was school-based, children not attending school were not part of the sampling frame. Additional information for the 1986-1987 NIDR survey is available in the public-use data file documentation and survey methodology report (7).
Both surveys included intraoral assessment of all permanent teeth conducted by trained and standardized dental examiners who used the Dean’s Fluorosis Index (2). Accordingly, each tooth was assigned one of six diagnostic codes: unaffected, questionable, very mild, mild, moderate, and severe. Examiners in both surveys reached acceptable levels of interexaminer reliability against a standard examiner (8-10). Data from the 1986-1987 NIDR survey represent the first national data on dental fluorosis, while data from the 1999-2004 NHANES represent the most recent national data. The age group 12-15 was used to compare changes between surveys because, on average, all permanent teeth are fully erupted at that age.
Publicly available datasets from both surveys were used to calculate a person-based score for dental fluorosis following Dean’s criteria, that is, using the score corresponding to the two most affected teeth. For example, in order to have a category of “moderate” fluorosis, the person should have at least two permanent teeth with the score of moderate. For analyses using age, data from the 1999-2004 NHANES were grouped into six age groups (6-11, 12-15, 16-19, 20-29, 30-39, and 40-49) and comparisons to the 1986-1987 NIDR survey used data from respondents aged 12-15.
Population estimates and standard errors were calculated in SAS-callable SUDAAN software (release 9.0; Research Triangle Institute, Research Triangle Park, N.C.). Sample weights provided by the National Center for Health Statistics and NIDR to account for differing probabilities of selection, nonresponse, and noncoverage, were used for analysis. The standard errors of the percentages were estimated using Taylor Series Linearization to take into account the complex sampling design. Graphs include 95% confidence intervals.
About the authors
Eugenio D. Beltrán-Aguilar and Laurie Barker are with the Centers for Disease Control and Prevention’s (CDC) National Center for Chronic Disease Prevention and Health Promotion, Division of Oral Health. Bruce A. Dye is with CDC’s National Center for Health Statistics, Division of Health and Nutrition Examination Surveys.
References
- Aoba T, Fejerskov O. Dental fluorosis: Chemistry and biology. Crit Rev Oral Biol Med 13(2):155-70. 2002.
- Dean HT. The investigation of physiological effects by the epidemiological method. Report no 19. Washington, DC: American Association for the Advancement of Science. 1942.
- CDC. Fluoridation of drinking water to prevent dental caries. MMWR 48:933-40. 1998.
- Leverett D. Prevalence of dental fluorosis in fluoridated and nonfluoridated communities-A preliminary investigation. J Public Health Dent 46(4):184-7. 1986.
- Szpunar SM, Burt BA. Dental caries, fluorosis, and fluoride exposure in Michigan schoolchildren. J Dent Res 67(5):802-6. 1988.
- Mascarenhas AK. Risk factors for dental fluorosis: A review of the recent literature. Pediatr Dent 22(4):269-77. 2000.
- National Institute of Dental Research. Oral health of United States children. The National Survey of Oral Health in U.S. School Children, 1986-1987. Public-use data file documentation and survey methodology. Bethesda, MD: National Institutes of Health. 1992.
- National Institute of Dental Research. Oral health of United States children. The National Survey of Dental Caries in U.S. School Children, 1986-1987. National and regional findings. NIH Publ no 89-2247. Bethesda, MD: National Institutes of Health. 1989.
- Dye BA, Barker LK, Selwitz RH, Lewis BG, Wu T, Fryar CD, et al. Overview and quality assurance for the National Health and Nutrition Examination Survey (NHANES) oral health component, 1999-2002. Community Dent Oral Epidemiol 35(2):140-51. 2007.
- Dye BA, Nowjack-Raymer R, Barker LK, Nunn JH, Steele JG, Tan S, et al. Overview and quality assurance for the oral health component of the National Health and Nutrition Examination Survey (NHANES), 2003-04. J Public Health Dent 68(4):218-26. 2008.
Suggested citation
Beltrán-Aguilar ED, Barker L, Dye BA. Prevalence and severity of dental fluorosis in the United States, 1999-2004. NCHS data brief, no 53. Hyattsville, MD: National Center for Health Statistics. 2010.
Copyright information
All material appearing in this report is in the public domain and may be reproduced or copied without permission; citation as to source, however, is appreciated.
National Center for Health Statistics
Edward J. Sondik, Ph.D., Director
Jennifer H. Madans, Ph.D., Associate Director for Science
Division of Health and Nutrition Examination Surveys
Clifford L. Johnson, M.S.P.H., Director