Blood Lead and Mercury Levels in Pregnant Women in the United States, 2003–2008
- Key findings
- Pregnant women have lower mercury and lead levels than nonpregnant women.
- Mercury levels among pregnant women increase with age.
- Mercury levels are higher and lead levels are lower for pregnant women with no prior pregnancy.
- Pregnant women with less than a high school education have higher lead levels than those with more education.
- Mercury and lead levels among pregnant women vary by race and ethnicity.
- Mexican-American pregnant women born in Mexico have higher lead levels than Mexican-American pregnant women born in the United States.
- Summary
- Definitions
- Data source and methods
- About the authors
- References
- Suggested citation
NCHS Data Brief No. 52, December 2010
PDF Version (624 KB)
Lindsey Jones, M.A.; Jennifer D. Parker, Ph.D.; and Pauline Mendola, Ph.D.
Key findings
Data from the National Health and Nutrition Examination Survey, 2003–2008
- In general, U.S. pregnant women have low levels of lead (less than 5 µg/dL) in their blood.
- Pregnant women have lower mercury and lead levels than nonpregnant women.
- Among pregnant women, mercury levels, but not lead levels, increase with age.
- Pregnant women with a prior pregnancy have lower mercury levels and higher lead levels than those without a prior pregnancy.
- Mexico-born Mexican-American pregnant women have higher lead levels than their U.S.-born counterparts, but similar mercury levels.
Chemical exposure during pregnancy is potentially harmful to the developing fetus, as the placenta cannot protect against heavy metals such as lead and mercury (1–4). Cord blood mercury levels have been associated with childhood cognitive function (3,4). High levels of lead exposure during pregnancy have been associated with adverse birth outcomes and, in some studies, with lower cognitive function test scores in childhood (3); relatively low lead levels have recently been associated with a small risk of decreased birthweight (5). While intervention for pregnant women with blood lead levels greater than or equal to 5 µg/dL has been recommended (6,7), no comparable recommendation for blood mercury in pregnant women has been established.
This report presents geometric mean lead and mercury blood levels of pregnant women in the United States based on using the 2003–2008 National Health and Nutrition Examination Surveys (NHANES). Throughout this report, the term mean refers to the geometric mean.
Keywords: pregnancy, National Health and Nutrition Examination Survey, environmental health
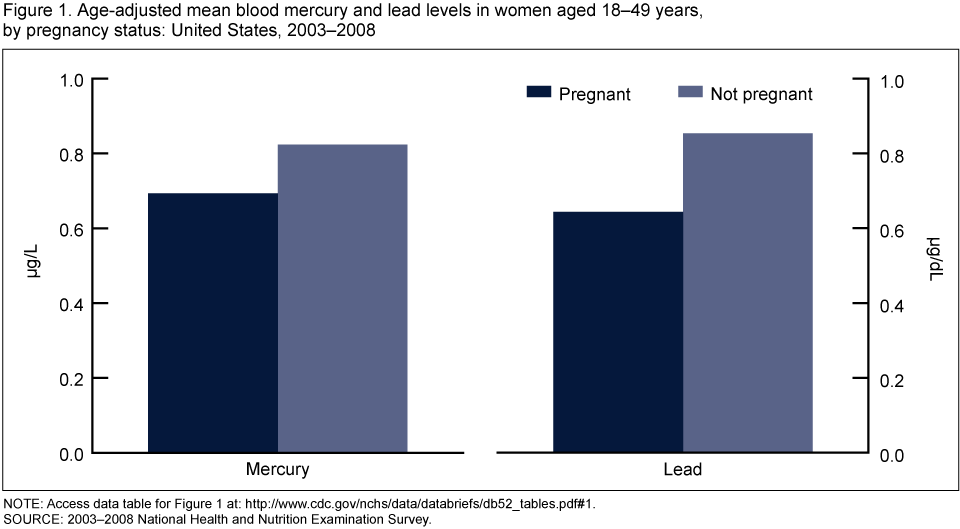
Pregnant women have lower mercury and lead levels than nonpregnant women.
NOTE: Access data table for Figure 1 [PDF – 52 KB].
SOURCE: 2003–2008 National Health and Nutrition Examination Survey.
- Pregnant women experience physiological and metabolic changes over the course of pregnancy that may affect measured lead and mercury levels, so levels among nonpregnant women may not be directly comparable.
- Mean mercury levels among pregnant women are lower than those for nonpregnant women (0.69 µg/L compared with 0.82 µg/L), even after adjusting for the younger ages of pregnant women (Figure 1).
- Mean lead levels among pregnant women are lower than those for nonpregnant women (0.64 µg/dL compared wtih 0.85 µg/dL), even after adjusting for the younger ages of pregnant women.
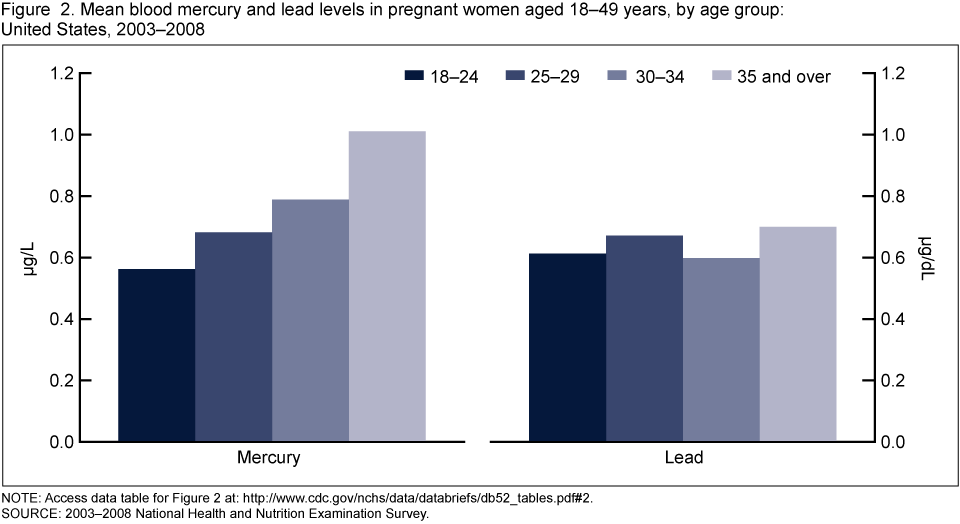
Mercury levels among pregnant women increase with age.
- Mean mercury levels among pregnant women increase with age, from 0.56 µg/L for women aged 18–24 years to 1.01 µg/L for women aged 35 years and over (Figure 2).
- Lead levels do not vary by age among pregnant women.
NOTE: Access data table for Figure 2 [PDF – 52 KB].
SOURCE: 2003–2008 National Health and Nutrition Examination Survey.
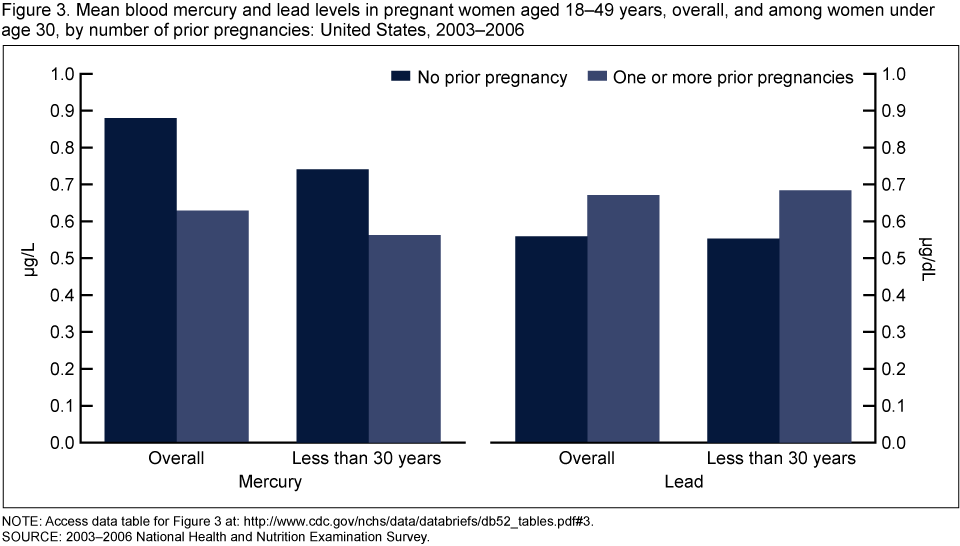
Mercury levels are higher and lead levels are lower for pregnant women with no prior pregnancy.
- Blood mercury levels are higher for pregnant women with no prior pregnancies (0.88 µg/L) than for women with one or more prior pregnancies (0.63 µg/L). This pattern is similar for pregnant women younger than age 30, but not statistically significant (Figure 3).
- Lead levels are lower for pregnant women with no prior pregnancy (0.56 µg/dL) than for women with one or more prior pregnancies (0.67 µg/dL). This pattern is similar for pregnant women younger than age 30.
NOTE: Access data table for Figure 3 [PDF – 52 KB].
SOURCE: 2003–2006 National Health and Nutrition Examination Survey.
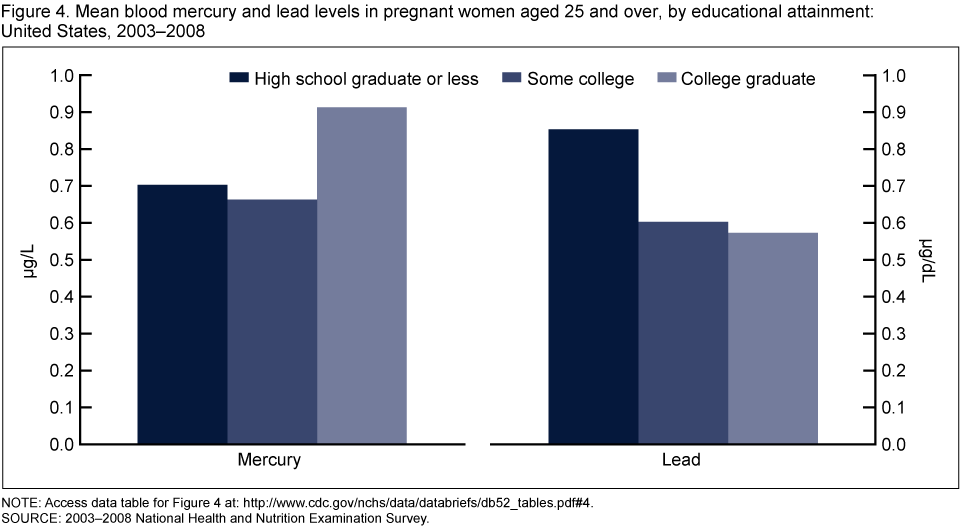
Pregnant women with less than a high school education have higher lead levels than those with more education.
- There are no statistically significant differences in mean mercury levels of pregnant women 25 years of age or over based on their educational level (Figure 4).
- Mean lead levels for pregnant women aged 25 years and over with less than a high school education (0.85 µg/dL) are higher than those for women with some college education (0.60 µg/dL) and those for college graduates (0.57 µg/dL).
NOTE: Access data table for Figure 4 [PDF – 52 KB].
SOURCE: 2003–2008 National Health and Nutrition Examination Survey.
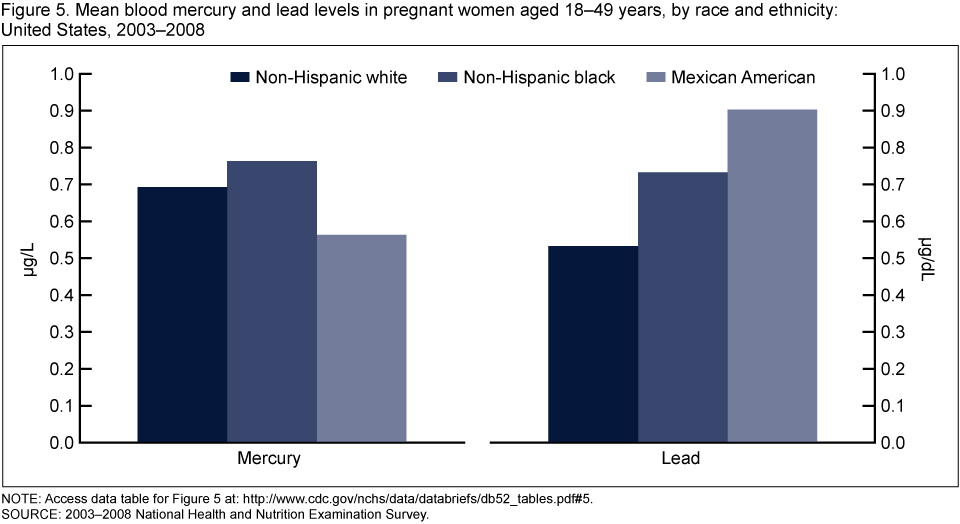
Mercury and lead levels among pregnant women vary by race and ethnicity.
- Pregnant Mexican-American women have lower mean mercury levels than pregnant non-Hispanic black women (0.56 µg/L compared with 0.76 µg/L) (Figure 5).
- Mean mercury levels for pregnant Mexican-American women are not different from those for pregnant non-Hispanic white women.
- Non-Hispanic white pregnant women have lower mean lead levels (0.53 µg/dL) than other race and ethnicity groups (non-Hispanic black: 0.73 µg/dL and Mexican-American: 0.90 µg/dL).
NOTE: Access data table for Figure 5 [PDF – 52 KB].
SOURCE: 2003–2008 National Health and Nutrition Examination Survey.
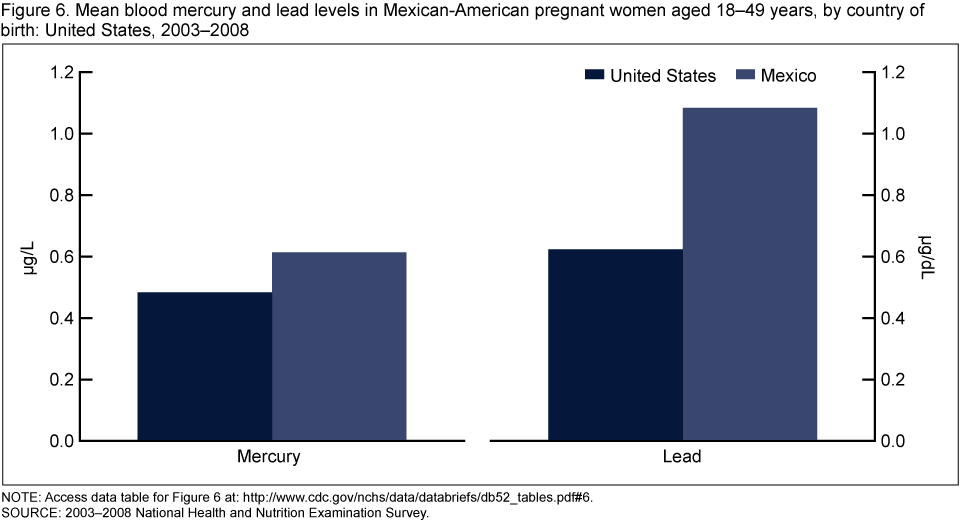
Mexican-American pregnant women born in Mexico have higher lead levels than Mexican-American pregnant women born in the United States.
- Mexican-American pregnant women born in Mexico and the United States have similar mean mercury levels (Figure 6).
- Mean lead levels for Mexican-American pregnant women born in Mexico (1.08 µg/dL) are over 50% higher than for those born in the United States (0.62 µg/dL).
NOTE: Access data table for Figure 6 [PDF – 52 KB].
SOURCE: 2003–2008 National Health and Nutrition Examination Survey.
Summary
Based on a nationally representative sample, this analysis demonstrates that mean lead levels are generally low in U.S. pregnant women (less than 5 µg/dL for blood lead). Although no standard exists for blood mercury in pregnant women, based on studies of cord blood (4), levels greater than 5.8 μg/L have raised concern (8,9). The mean blood mercury level in pregnant women in this analysis is 0.69 µg/L. Pregnant women experience physiological and metabolic changes over the course of pregnancy that may affect measured lead and mercury levels so levels among nonpregnant women may not be directly comparable. However, results for mercury are similar to previously published results by the Centers for Disease Control and Prevention (CDC) for women of childbearing age and for pregnant women using earlier NHANES data (8,10). Although there are no previous nationally representative studies published on lead levels in pregnant women, data from 10 states within the Adult Blood Lead Epidemiology and Surveillance (ABLES) system have reported the prevalence of blood lead levels greater than 5 µg/dL for women of childbearing age and higher blood lead levels among occupationally exposed women from 37 states (6); earlier studies from NHANES II reported levels of blood lead among women of childbearing age during 1976–1980, when ambient lead levels were higher (11,12). In this analysis, so few pregnant women had blood lead levels that could be considered high (less than 0.5% in the weighted sample) that no reliable estimates for high levels could be calculated (relative standard errors are greater than 50%).
There were some observed differences among mothers by number of previous pregnancies, education level, race and ethnicity, and country of birth. Some of these differences could possibly be explained by differences in diet (e.g., fish consumption) (10,13) and other environmental exposures.
Definitions
Geometric mean: A type of average that is commonly used to estimate central tendency for data that are distributed with a long tail at the upper end of the distribution. In this report, the geometric mean was calculated by taking the natural logarithm of each concentration, computing the mean of those log-transformed values, and exponentiating the value to the original scale.
Pregnant: Defined as currently pregnant and determined by the use of either a lab pregnancy test or self-reported pregnancy status.
Data source and methods
The 2003–2008 NHANES data were used for all analysis. NHANES selects a sample for the survey that is representative of the noninstitutionalized civilian U.S. population of all ages. A national sample of about 5,000 civilian, noninstitutionalized persons is surveyed annually. During 1999–2006, the NHANES sampling criterion included oversampling of pregnant women to produce reliable estimates of health and nutritional measures for this subgroup; data for the number of prior pregnancies are only available for 1999–2006. Therefore, estimates by number of prior pregnancies in this report are for 2003–2006 rather than 2003–2008. Consistent laboratory methods for mercury detection are available in NHANES from 2003 onward. The sample design utilizes a multistage stratified cluster design where first counties are randomly chosen, then within county, segments (smaller geographical units) are randomly chosen followed by households within those units and lastly, one or more individuals is selected from each household. This report is based on an analysis of the household interview data and laboratory data files. Information about laboratory methods can be found in CDC’s Fourth National Report on Human Exposure to Environmental Chemicals (14).
Because the distribution of age among pregnant women 18–49 years of age is lower than that for nonpregnant women in the same age range, lead and mercury levels for pregnant and nonpregnant women shown in Figure 1 were age-adjusted to the age distribution of births to women in 2004 with the following weights: ages under 25 years, weight = 0.3543; ages 25–34 years, weight = 0.5034; and ages greater than 34 years, weight = 0.1424.
Survey sample weights were used for all analysis, which accounts for differential probabilities of selection, nonresponse, and noncoverage. All data analysis was completed using SAS version 9.1 (SAS Institute, Cary, N.C.) and SUDAAN version 9.0 (RTI, Research Triangle Park, N.C.). Confidence intervals were calculated and pair-wise statistical tests were conducted using the log-transformed values. Statements about differences and similarities in the text are based on the results of statistical tests using p = 0.05 as the criterion for statistical significance; no adjustments for multiple comparisons were made. None of the reported geometric mean estimates are considered unreliable; all have an estimated relative standard error less than 30%.
About the authors
Jennifer Parker is with CDC’s National Center for Health Statistics (NCHS), Office of Analysis and Epidemiology (OAE). Pauline Mendola is with CDC, NCHS, OAE, Infant, Child, and Women’s Health Statistics Branch. At the time of this report, Lindsey Jones was a Graduate Research Assistant at the University of Maryland, School of Public Health, Department of Epidemiology and Biostatistics. Ms. Jones is currently a CDC/CSTE Applied Epidemiology Fellow at the Tennessee Department of Health.
References
- Rhainds M, Levallois P, Dewailly E, Ayotte P. Lead, mercury, and organochlorine compound levels in cord blood in Quebec, Canada. Arch Environ Health 54(1):40–7. 1999.
- Crocetti AF, Mushak P, Schwartz J. Determination of numbers of lead-exposed women of childbearing age and pregnant women: An integrated summary of a report to the U.S. Congress on childhood lead poisoning. Environ Health Perspect 89:121–4. 1990.
- Wigle DT, Arbuckle TE, Turner MC, et al. Epidemiologic evidence of relationships between reproductive and child health outcomes and environmental chemical contaminants. J Toxicol Environ Health B Crit Rev 11:373–517. 2008.
- Centers for Disease Control and Prevention. National Academy of Sciences. Toxicologic effects of methylmercury. Washington, D.C.: National Research Council; 2000. Lead exposure among females of childbearing age—United States, 2004. MMWR 56:387–400. 2007.
- Zhu M, Fitzgerald EF, Gelberg KH, et al. Maternal low-level lead exposure and fetal growth. Environ Health Perspect 118:1471-5. 2010.
- Centers for Disease Control and Prevention. Lead exposure among females of childbearing age: United States, 2004. MMWR 56:397-400. 2007.
- Association of Occupational and Environmental Clinics. Medical management guidelines for lead-exposed adults. Washington, D.C.: Association of Occupational and Environmental Clinics [PDF – 239 KB]. 2007. Accessed September 13, 2010.
- Centers for Disease Control and Prevention. Blood mercury levels in young children and childbearing aged women: United States, 1999–2002. MMWR 53:1018–20. 2004.
- U.S. Environmental Protection Agency. Methylmercury exposure. Accessed September 13, 2010.
- Schober SE, Sinks TH, Jones RL, et al. Blood mercury levels in U.S. children and women of childbearing age, 1999–2000. JAMA 289:1667–74. 2003.
- Geronimus AT, Hillemeier MM. Patterns of blood lead levels in U.S. black and white women of childbearing age. Ethnicity Dis 2:222–3. 1992.
- Crocetti AF, Mushak P, Schwartz J. Determination of numbers of lead-exposed women of childbearing age and pregnant women: An integrated summary of a report to the U.S. Congress on childhood lead poisoning. Environ Health Perspect 89:121–4. 1990.
- McDowell MA, Dillon CF, Osterloh J, et al. Hair mercury levels in U.S. children and women of childbearing age: Reference range data from NHANES 1999–2000. Environ Health Perspect 112:1165–71. 2004.
- Centers for Disease Control and Prevention. Fourth National Report on Human Exposure to Environmental Chemicals. National Center for Environmental Health, Division of Laboratory Sciences, Atlanta, GA. 2009.
Suggested citation
Jones L, Parker JD, Mendola P. Blood lead and mercury levels in pregnant women in the United States, 2003–2008. NCHS data brief no 52. Hyattsville, MD: National Center for Health Statistics. 2010.
Copyright information
All material appearing in this report is in the public domain and may be reproduced or copied without permission; citation as to source, however, is appreciated.
National Center for Health Statistics
Edward J. Sondik, Ph.D., Director
Jennifer H. Madans, Ph.D., Associate Director for Science
Office of Analysis and Epidemiology
Linda T. Bilheimer, Ph.D., Associate Director