Attention-Deficit/Hyperactivity Disorder in Children Ages 5–17 Years: United States, 2020–2022
- Key findings
- What was the prevalence of diagnosed ADHD in 2020–2022 and did it differ by sex and age?
- Did the prevalence of diagnosed ADHD differ by race and Hispanic origin and age?
- Did the prevalence of children with diagnosed ADHD differ by family income and age?
- Did the prevalence of children diagnosed with ADHD differ by health insurance coverage and age?
- Summary
Data from the National Health Interview Survey
- During 2020–2022, the prevalence of ever diagnosed attention-deficit/hyperactivity disorder (ADHD) was 11.3% in children ages 5–17 years, with boys (14.5%) having a higher prevalence than girls (8.0%).
- Children ages 5–11 years were less likely than children ages 12–17 years to have ADHD.
- White non-Hispanic children ages 5–17 years were more likely to have ADHD (13.4%) than Black non-Hispanic (10.8%) and Hispanic (8.9%) children.
- The prevalence of ADHD decreased as the level of family income increased.
- Children with public (14.4%) or private (9.7%) health insurance were more likely to have ADHD than children without insurance (6.3%).
Attention-deficit/hyperactivity disorder (ADHD) is one of the most common mental disorders of childhood (1). It is characterized by a pattern of inattention, impulsivity, or hyperactivity that leads to functional impairment experienced in multiple settings (2). Symptoms of ADHD occur during childhood, and many children continue to have symptoms and impairment through adolescence and into adulthood (3). This report describes the percentage of children and adolescents ages 5–17 years who had ever been diagnosed with ADHD from the 2020–2022 National Health Interview Survey (NHIS).
Keywords: child mental health, behavioral disorders, National Health Interview Survey
What was the prevalence of diagnosed ADHD in 2020–2022 and did it differ by sex and age?
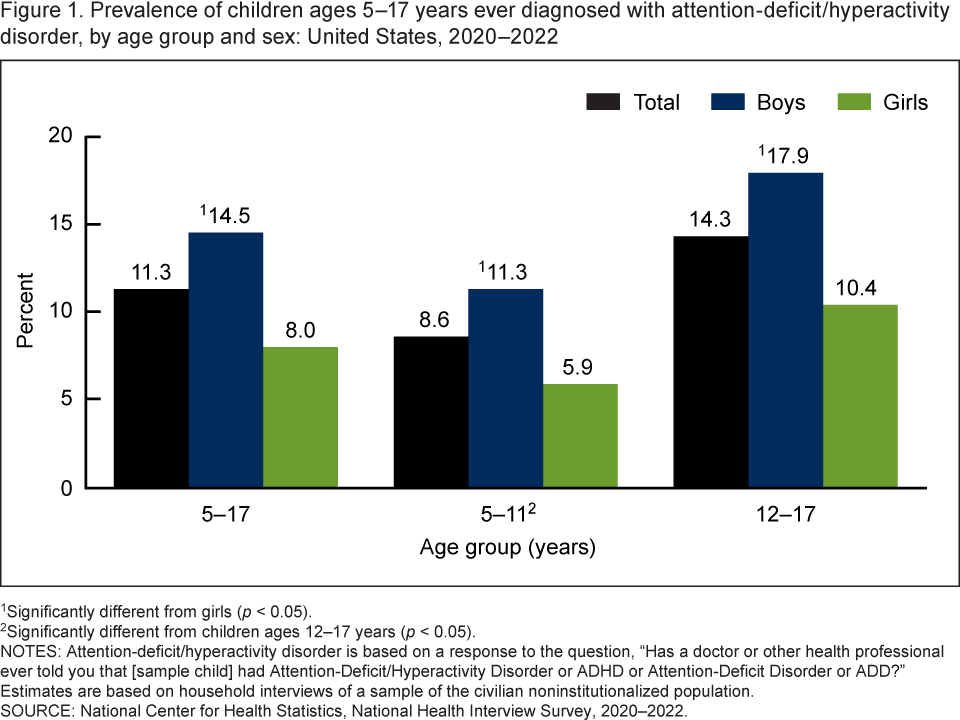
- During 2020–2022, 11.3% of children ages 5–17 years had ever been diagnosed with ADHD (Figure 1, Table 1).
- Boys (14.5%) were more likely than girls (8.0%) to have ADHD, and this pattern was seen for children ages 5–11 years and 12–17 years.
- Among both boys and girls, the prevalence of ADHD was lower in children ages 5–11 years (8.6%) than in those ages 12–17 years (14.3%).
Figure 1. Prevalence of children ages 5–17 years ever diagnosed with attention-deficit/hyperactivity disorder, by age group and sex: United States, 2020–2022
1Significantly different from girls (p < 0.05).
2Significantly different from children ages 12–17 years (p < 0.05).
NOTES: Attention-deficit/hyperactivity disorder is based on a response to the question, “Has a doctor or other health professional ever told you that [sample child] had Attention-Deficit/Hyperactivity Disorder or ADHD or Attention-Deficit Disorder or ADD?” Estimates are based on household interviews of a sample of the civilian noninstitutionalized population.
SOURCE: National Center for Health Statistics, National Health Interview Survey, 2020–2022.
Data table for Figure 1. Prevalence of children ages 5–17 years ever diagnosed with attention-deficit/hyperactivity disorder, by age group and sex: United States, 2020–2022
| Age group (years) and sex | Percent (95% confidence interval) | Standard error |
|---|---|---|
| 5–17 | ||
| Total | 11.3 (10.7–12.0) | 0.3 |
| Boys | 14.5 (13.5–15.4) | 0.5 |
| Girls | 8.0 (7.3–8.8) | 0.4 |
| 5–11 | ||
| Total | 8.6 (7.8–9.4) | 0.4 |
| Boys | 11.3 (10.1–12.5) | 0.6 |
| Girls | 5.9 (5.0–6.9) | 0.5 |
| 12–17 | ||
| Total | 14.3 (13.3–15.2) | 0.5 |
| Boys | 17.9 (16.5–19.5) | 0.8 |
| Girls | 10.4 (9.3–11.6) | 0.6 |
NOTES: Attention deficit hyperactivity disorder is based on a response to the question, “Has a doctor or other health professional ever told you that [sample child] had Attention-Deficit/Hyperactivity Disorder or ADHD or Attention-Deficit Disorder or ADD?” Estimates are based on household interviews of a sample of the civilian noninstitutionalized population.
SOURCE: National Center for Health Statistics, National Health Interview Survey, 2020–2022.
Did the prevalence of diagnosed ADHD differ by race and Hispanic origin and age?
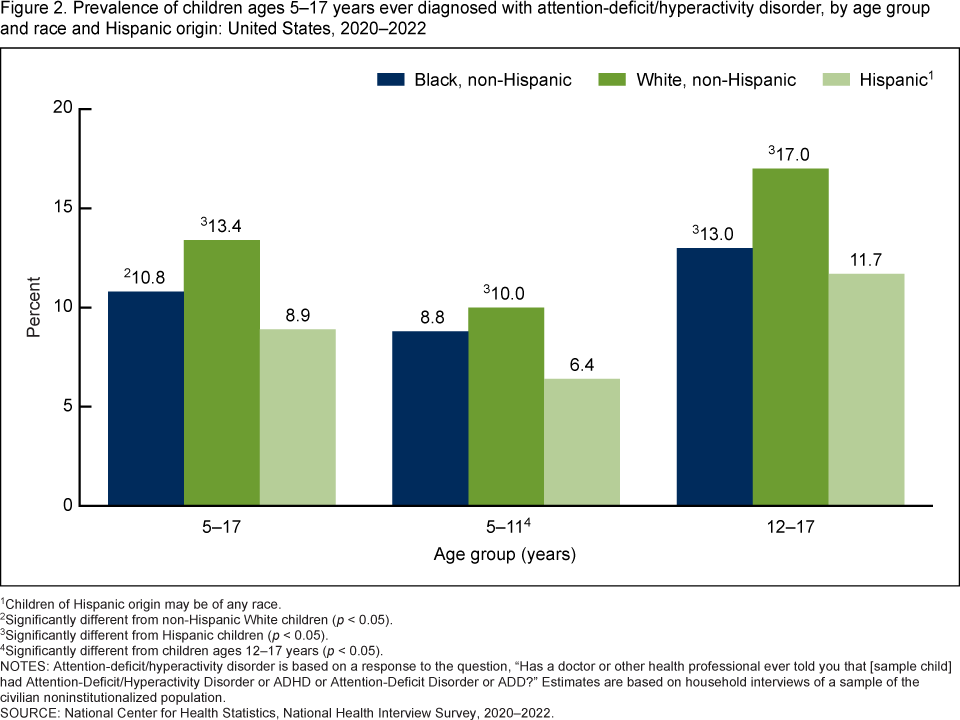
- Among children ages 5–17 years, White non-Hispanic (subsequently, White) children were more likely to have ever been diagnosed with ADHD (13.4%) than Black non-Hispanic (subsequently, Black) (10.8%) and Hispanic (8.9%) children (Figure 2, Table 2).
- Among children ages 5–11 years, White children were more likely than Hispanic children to have ADHD; however, observed differences among Black children and either White or Hispanic children were not significant.
- Among children ages 12–17 years, the prevalence of ADHD was higher among White children (17.0%) than for Black (13.0%) and Hispanic (11.7%) children.
- The prevalence of ADHD was higher in children ages 12–17 years than in children ages 5–11 years for all race and Hispanic-origin groups.
Figure 2. Prevalence of children ages 5–17 years ever diagnosed with attention-deficit/hyperactivity disorder, by age group and race and Hispanic origin: United States, 2020–2022
1Children of Hispanic origin may be of any race.
2Significantly different from non-Hispanic White children (p < 0.05).
3Significantly different from Hispanic children (p < 0.05).
4Significantly different from children ages 12–17 years (p < 0.05).
NOTES: Attention-deficit/hyperactivity disorder is based on a response to the question, “Has a doctor or other health professional ever told you that [sample child] had Attention-Deficit/Hyperactivity Disorder or ADHD or Attention-Deficit Disorder or ADD?” Estimates are based on household interviews of a sample of the civilian noninstitutionalized population.
SOURCE: National Center for Health Statistics, National Health Interview Survey, 2020–2022.
Data table for Figure 2. Prevalence of children ages 5–17 years ever diagnosed with attention-deficit/hyperactivity disorder, by age group and race and Hispanic origin: United States, 2020–2022
| Age group (years) and race and Hispanic origin | Percent (95% confidence interval) | Standard error |
|---|---|---|
| 5–17 | ||
| Black, non-Hispanic | 10.8 (8.9–12.9) | 1.0 |
| White, non-Hispanic | 13.4 (12.5–14.3) | 0.4 |
| Hispanic1 | 8.9 (7.8–10.1) | 0.6 |
| 5–11 | ||
| Black, non-Hispanic | 8.8 (6.5–11.7) | 1.3 |
| White, non-Hispanic | 10.0 (8.9–11.2) | 0.6 |
| Hispanic1 | 6.4 (5.1–7.9) | 0.7 |
| 12–17 | ||
| Black, non-Hispanic | 13.0 (10.3–16.1) | 1.4 |
| White, non-Hispanic | 17.0 (15.7–18.4) | 0.7 |
| Hispanic1 | 11.7 (10.0–13.5) | 0.9 |
1Children of Hispanic origin may be of any race.
NOTES: Attention deficit hyperactivity disorder is based on a response to the question, “Has a doctor or other health professional ever told you that [sample child] had Attention-Deficit/Hyperactivity Disorder or ADHD or Attention-Deficit Disorder or ADD?” Estimates are based on household interviews of a sample of the civilian noninstitutionalized population.
SOURCE: National Center for Health Statistics, National Health Interview Survey, 2020–2022.
Did the prevalence of children with diagnosed ADHD differ by family income and age?
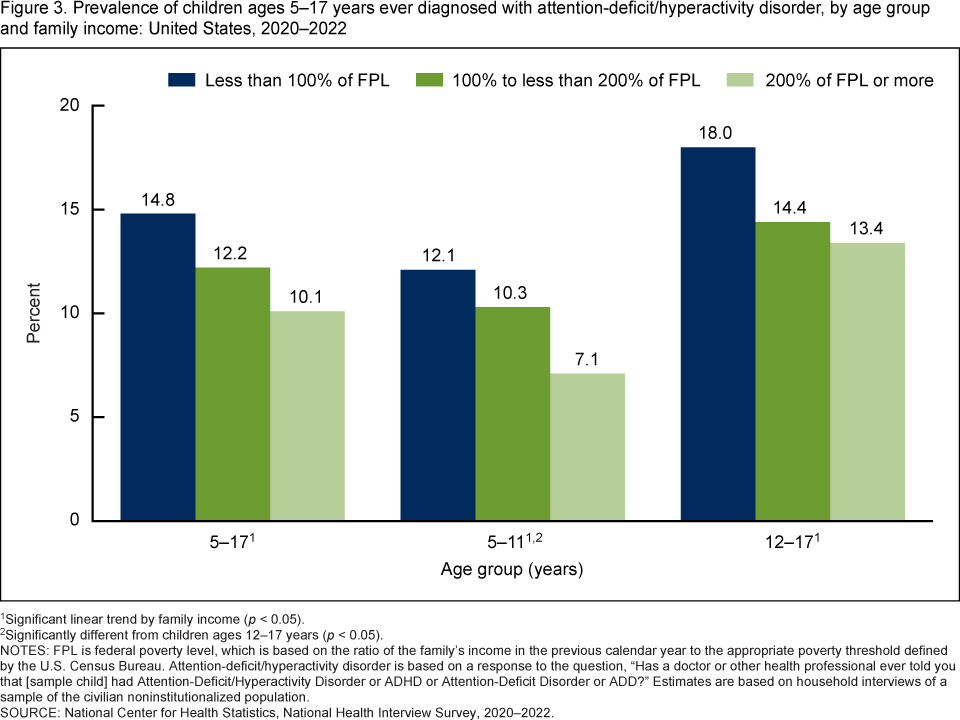
- Among children ages 5–17 years, the prevalence of ADHD decreased as family income as a percentage of the federal poverty level increased, from 14.8% in those with family incomes of less than 100% of the federal poverty level to 10.1% in those with family incomes of 200% of the federal poverty level or more (Figure 3, Table 3).
- This pattern of decreased prevalence of ADHD with increased family income was seen among children in both age groups.
- Children ages 5–11 years were less likely than those ages 12–17 years to have ADHD across all family income levels.
Figure 3. Prevalence of children ages 5–17 years ever diagnosed with attention-deficit/hyperactivity disorder, by age group and family income: United States, 2020–2022
1Significant linear trend by family income (p < 0.05).
2Significantly different from children ages 12–17 years (p < 0.05).
NOTES: FPL is federal poverty level, which is based on the ratio of the family’s income in the previous calendar year to the appropriate poverty threshold defined by the U.S. Census Bureau. Attention-deficit/hyperactivity disorder is based on a response to the question, “Has a doctor or other health professional ever told you that [sample child] had Attention-Deficit/Hyperactivity Disorder or ADHD or Attention-Deficit Disorder or ADD?” Estimates are based on household interviews of a sample of the civilian noninstitutionalized population.
SOURCE: National Center for Health Statistics, National Health Interview Survey, 2020–2022.
Data table for Figure 3. Prevalence of children ages 5–17 years ever diagnosed with attention-deficit/hyperactivity disorder, by age group and family income: United States, 2020–2022
| Age group (years) and family income | Percent (95% confidence interval) | Standard error |
|---|---|---|
| 5–17 | ||
| Less than 100% of FPL | 14.8 (12.8–17.1) | 1.1 |
| 100% to less than 200% of FPL | 12.2 (10.9–13.7) | 0.7 |
| 200% of FPL or more | 10.1 (9.4–10.9) | 0.4 |
| 5–11 | ||
| Less than 100% of FPL | 12.1 (9.6–15.0) | 1.4 |
| 100% to less than 200% of FPL | 10.3 (8.5–12.3) | 1.0 |
| 200% of FPL or more | 7.1 (6.3–8.0) | 0.4 |
| 12–17 | ||
| Less than 100% of FPL | 18.0 (14.7–21.6) | 1.4 |
| 100% to less than 200% of FPL | 14.4 (12.5–16.4) | 1.0 |
| 200% of FPL or more | 13.4 (12.3–14.5) | 0.6 |
NOTES: FPL is federal poverty level, which is based on the ratio of the family’s income in the previous calendar year to the appropriate poverty threshold defined by the U.S. Census Bureau. Attention deficit hyperactivity disorder is based on a response to the question, “Has a doctor or other health professional ever told you that [sample child] had Attention-Deficit/Hyperactivity Disorder or ADHD or Attention-Deficit Disorder or ADD?” Estimates are based on household interviews of a sample of the civilian noninstitutionalized population.
SOURCE: National Center for Health Statistics, National Health Interview Survey, 2020–2022.
Did the prevalence of children diagnosed with ADHD differ by health insurance coverage and age?
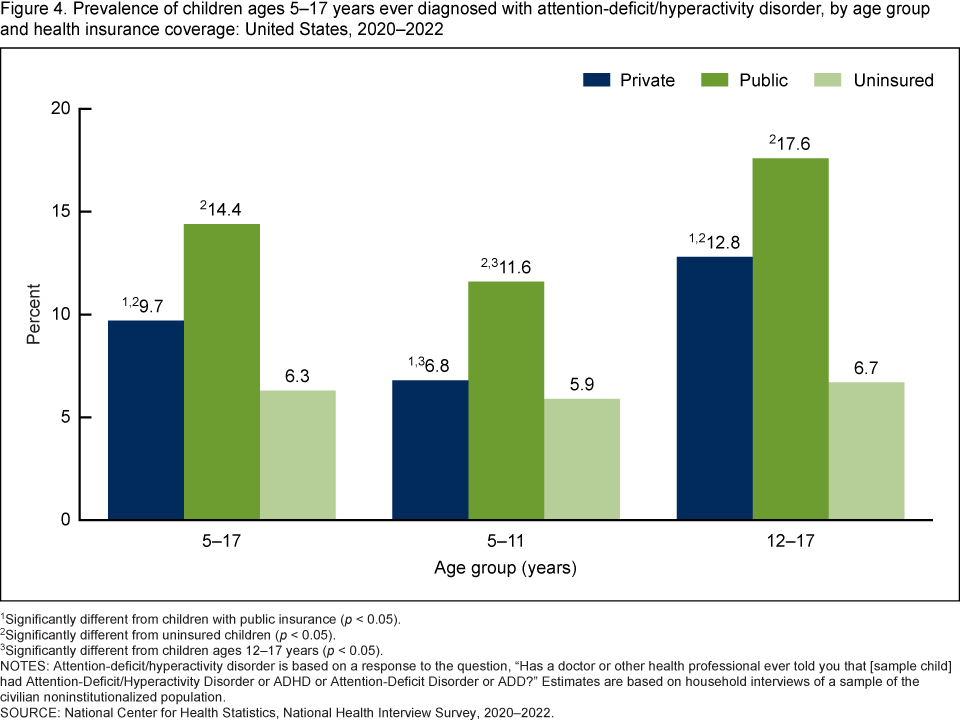
- Among children ages 5–17 years, the highest prevalence of ADHD was in children with public insurance coverage (14.4%) and the lowest was among uninsured children (6.3%) (Figure 4, Table 4).
- In children ages 5–11 years, those with public insurance had the highest prevalence of ADHD (11.6%), but observed differences between those with private insurance (6.8%) and without insurance (5.9%) were not significant.
- Among children ages 12–17 years, prevalence of ADHD was highest in those with public insurance (17.6%), followed by children with private insurance (12.8%) and children without insurance (6.7%).
Figure 4. Prevalence of children ages 5–17 years ever diagnosed with attention-deficit/hyperactivity disorder, by age group and health insurance coverage: United States, 2020–2022
1Significantly different from children with public insurance (p < 0.05).
2Significantly different from uninsured children (p < 0.05).
3Significantly different from children ages 12–17 years (p < 0.05).
NOTES: Attention-deficit/hyperactivity disorder is based on a response to the question, “Has a doctor or other health professional ever told you that [sample child] had Attention-Deficit/Hyperactivity Disorder or ADHD or Attention-Deficit Disorder or ADD?” Estimates are based on household interviews of a sample of the civilian noninstitutionalized population.
SOURCE: National Center for Health Statistics, National Health Interview Survey, 2020–2022.
Data table for Figure 4. Prevalence of children ages 5–17 years ever diagnosed with attention-deficit/hyperactivity disorder, by age group and health insurance coverage: United States, 2020–2022
| Age group (years) and health insurance coverage | Percent (95% confidence interval) | Standard error |
|---|---|---|
| 5–17 | ||
| Private | 9.7 (9.0–10.4) | 0.4 |
| Public | 14.4 (13.2–15.7) | 0.6 |
| Uninsured | 6.3 (4.5–8.6) | 1.0 |
| 5–11 | ||
| Private | 6.8 (5.9–7.6) | 0.4 |
| Public | 11.6 (10.1–13.3) | 0.8 |
| Uninsured | 5.9 (3.3–9.5) | 1.5 |
| 12–17 | ||
| Private | 12.8 (11.7–13.9) | 0.6 |
| Public | 17.6 (15.7–19.5) | 0.9 |
| Uninsured | 6.7 (4.0–10.5) | 1.6 |
NOTES: Attention deficit hyperactivity disorder is based on a response to the question, “Has a doctor or other health professional ever told you that [sample child] had Attention-Deficit/Hyperactivity Disorder or ADHD or Attention-Deficit Disorder or ADD?” Estimates are based on household interviews of a sample of the civilian noninstitutionalized population.
SOURCE: National Center for Health Statistics, National Health Interview Survey, 2020–2022.
Summary
This report describes national estimates of the prevalence of ever diagnosed ADHD in children and adolescents ages 5–17 years by age group, sex, race and Hispanic origin, family income, and health insurance status using data from the 2020–2022 NHIS. Overall, 11.3% of children ages 5–17 years had ever been diagnosed with ADHD. The prevalence was higher in children ages 12–17 years than in children ages 5–11 years, and the same pattern was seen across nearly all subgroups of sociodemographic characteristics presented, including sex, race and Hispanic origin, and family income. Boys were more likely than girls to have ADHD. Differences were found between race and Hispanic-origin groups, with White children generally having the highest prevalence. Children in families with lower family income were more likely to have ADHD than those with higher family income. In general, the prevalence of ADHD was highest in children with public insurance and lowest among those who were uninsured.
Definitions
Diagnosed attention-deficit/hyperactivity disorder: Respondents were asked, “Has a doctor or health professional ever told you that [sample child] had Attention-Deficit/Hyperactivity Disorder or ADHD or Attention-Deficit Disorder or ADD?”
Family income as a percentage of the federal poverty level: Based on the ratio of a family’s income in the previous calendar year to the appropriate poverty threshold (given the family’s size and number of children) defined by the U.S. Census Bureau (4). The 2020, 2021, and 2022 NHIS imputed income files were used to allow for imputed values when family income was not provided (5–7).
Health insurance coverage: Based on a hierarchy of mutually exclusive categories. Children with more than one type of health insurance were assigned to the first appropriate category in the following hierarchy: private, Medicaid or other public, other coverage, or uninsured. “Uninsured” includes children who had no coverage and those who had only Indian Health service coverage or had only a private plan that paid for one type of service such as dental or vision care. Children with “other coverage” are included in the totals but are not shown separately.
Race and Hispanic origin: Categories shown for non-Hispanic children are for those who selected only one racial group; respondents had the option to select more than one racial group. Children categorized as Hispanic may be of any race or combination of races. Estimates for non-Hispanic children of races other than White only or Black only are not shown but are included in total estimates.
Data source and methods
Data from the 2020–2022 NHIS were used for this analysis. NHIS is a nationally representative household survey of the U.S. civilian noninstitutionalized population. It is conducted continuously throughout the year by the National Center for Health Statistics. Interviews are typically conducted in respondents’ homes, but follow-ups to complete interviews may be conducted over the telephone. Because of the COVID-19 pandemic, interviewing procedures were disrupted, and 68.0% of 2020, 61.4% of 2021, and 56.1% of 2022 Sample Child interviews were conducted at least partially by telephone (8–10). For more information about NHIS, visit https://www.cdc.gov/nchs/nhis.htm.
Point estimates and the corresponding confidence intervals were calculated using SAS-callable SUDAAN software (11) to account for the complex sample design of NHIS. All estimates were based on parent or guardian report and meet NCHS data presentation standards for proportions (12). Differences between percentages were evaluated using two-sided significance tests at the 0.05 level.
About the authors
Cynthia Reuben and Nazik Elgaddal are with the National Center for Health Statistics, Division of Analysis and Epidemiology.
References
- Bitsko RH, Claussen AH, Lichstein J, Black LI, Jones SE, Danielson ML, et al. Mental health surveillance among children—United States, 2013–2019. MMWR Suppl 71(2):1–42. 2022. DOI: https://dx.doi.org/10.15585/mmwr.su7102a1.
- American Psychiatric Association. Diagnostic and statistical manual of mental disorders. 5th ed. Arlington, VA: American Psychiatric Association. 2013.
- Sibley MH, Arnold LE, Swanson JM, Hechtman LT, Kennedy TM, Owens E, et al. Variable patterns of remission from ADHD in the multimodal treatment study of ADHD. Am J Psychiatry 179(2):142–51. 2021. Available from: https://doi.org/10.1176/appi.ajp.2021.21010032.
- U.S. Census Bureau. Poverty thresholds.
- National Center for Health Statistics. Multiple imputation of family income in 2020 National Health Interview Survey: Methods. 2021.
- National Center for Health Statistics. Multiple imputation of family income in 2021 National Health Interview Survey: Methods. 2022.
- National Center for Health Statistics. Multiple imputation of family income in 2022 National Health Interview Survey: Methods. 2023.
- National Center for Health Statistics. National Health Interview Survey: 2020 survey description. 2021.
- National Center for Health Statistics. National Health Interview Survey: 2021 survey description. 2022.
- National Center for Health Statistics. National Health Interview Survey: 2022 survey description. 2023.
- RTI International. SUDAAN (Release 11.0.3) [computer software]. 2018.
- Parker JD, Talih M, Malec DJ, Beresovsky V, Carroll M, Gonzalez JF Jr, et al. National Center for Health Statistics data presentation standards for proportions. National Center for Health Statistics. Vital Health Stat 2(175). 2017.
Suggested citation
Reuben C, Elgaddal N. Attention-deficit/hyperactivity disorder in children ages 5–17 years: United States, 2020–2022. NCHS Data Brief, no 499. Hyattsville, MD: National Center for Health Statistics. 2024. DOI: https://doi.org/10.15620/cdc/148043.
Copyright information
All material appearing in this report is in the public domain and may be reproduced or copied without permission; citation as to source, however, is appreciated.
National Center for Health Statistics
Brian C. Moyer, Ph.D., Director
Amy M. Branum, Ph.D., Associate Director for Science
Division of Analysis and Epidemiology
Irma E. Arispe, Ph.D., Director
Kimberly A. Lochner, Sc.D., Associate Director for Science