Chronic School Absenteeism for Health-related Reasons Among Children Ages 5‒17 Years: United States, 2022
NCHS Data Brief No. 498, March 2024
PDF Version (506 KB)
Lindsey I. Black, M.P.H., and Nazik Elgaddal, M.S.
- Key findings
- What was the percentage of children who experienced chronic school absenteeism for health-related reasons in the past 12 months, and did it vary by sex or age group?
- Did the percentage of children who experienced chronic school absenteeism for health-related reasons in the past 12 months differ by race and Hispanic origin and family income?
- Did the percentage of children who experienced chronic school absenteeism for health-related reasons in the past 12 months differ by disability status or health status?
- Summary
Data from the National Health Interview Survey
- In 2022, 5.8% of children ages 5‒17 experienced chronic school absenteeism for health-related reasons in the past 12 months.
- The percentage of children who experienced chronic absenteeism varied by race and Hispanic origin.
- Children with family incomes of less than 200% of the federal poverty level were more likely to have experienced chronic school absenteeism than those with family incomes of 200% of the federal poverty level or more.
- Children with disabilities (14.8%) were about three times more likely to have experienced chronic school absenteeism than children without disabilities (4.4%).
Chronic school absenteeism can lead to poorer academic performance and school engagement for students (1). It is also a risk factor for school dropout (2,3), which is associated with many long-term health impacts (4,5). This report uses data from the 2022 National Health Interview Survey (NHIS) to describe the percentage of children ages 5‒17 who experienced chronic school absenteeism due to illness, injury, or disability by sociodemographic and health factors.
Keywords: missed school days, disability, education, National Health Interview Survey
What was the percentage of children who experienced chronic school absenteeism for health-related reasons in the past 12 months, and did it vary by sex or age group?
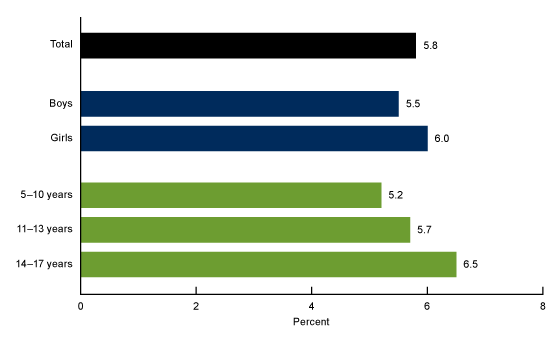
In 2022, 5.8% of children experienced chronic school absenteeism in the past 12 months (Figure 1, Table 1). Differences between boys (5.5%) and girls (6.0%) and by age were not significant.
Figure 1. Percentage of children ages 5‒17 years who experienced chronic school absenteeism for health-related reasons in the past 12 months, by sex and age group: United States, 2022

NOTES: Chronic school absenteeism was categorized based on the survey question, “During the past 12 months, about how many days of school did [Sample Child] miss school because they had an illness, injury, or disability?” Responses of 15 or more days were categorized as chronic school absenteeism based on the U.S. Department of Education definition. Estimates are based on household interviews of a sample of the U.S. civilian noninstitutionalized population.
SOURCE: National Center for Health Statistics, National Health Interview Survey, 2022.
Data table for Figure 1. Percentage of children ages 5‒17 years who experienced chronic school absenteeism for health-related reasons in the past 12 months, by sex and age group: United States, 2022
| Characteristic | Percent (95% confidence interval) | Standard error |
|---|---|---|
| Total | 5.8 (5.0‒6.6) | 0.38 |
| Sex | ||
| Boys | 5.5 (4.5‒6.7) | 0.52 |
| Girls | 6.0 (5.0‒7.2) | 0.56 |
| Age group (years) | ||
| 5‒10 | 5.2 (4.2‒6.3) | 0.53 |
| 11‒13 | 5.7 (4.2‒7.6) | 0.84 |
| 14‒17 | 6.5 (5.3‒8.0) | 0.67 |
NOTES: Chronic school absenteeism was categorized based on the survey question, “During the past 12 months, about how many days of school did [Sample Child] miss school because they had an illness, injury, or disability?” Responses of 15 or more days were categorized as chronic school absenteeism based on the U.S. Department of Education definition. Estimates are based on household interviews of a sample of the U.S. civilian noninstitutionalized population.
SOURCE: National Center for Health Statistics, National Health Interview Survey, 2022.
Did the percentage of children who experienced chronic school absenteeism for health-related reasons in the past 12 months differ by race and Hispanic origin and family income?
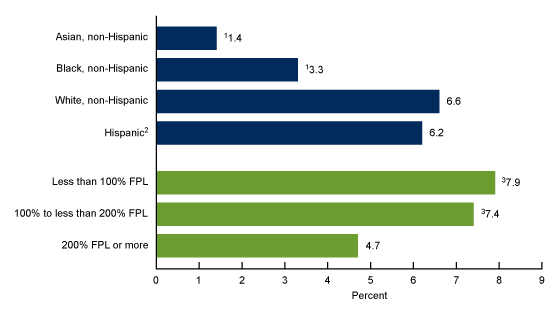
The percentage of White non-Hispanic (subsequently, White) children (6.6%) and Hispanic children (6.2%) who experienced chronic school absenteeism in the past 12 months was higher than Asian non-Hispanic (subsequently, Asian) children (1.4%) and Black non-Hispanic (subsequently, Black) children (3.3%) (Figure 2, Table 2). Children with family incomes of less than 100% of the federal poverty level (FPL) (7.9%) and those with family incomes of 100% to less than 200% FPL (7.4%) were more likely than those with family incomes of 200% FPL or more (4.7%) to have experienced chronic school absenteeism.
Figure 2. Percentage of children ages 5‒17 years who experienced chronic school absenteeism for health-related reasons in the past 12 months, by race and Hispanic origin and family income: United States, 2022

1Significantly different from White non-Hispanic and Hispanic children (p < 0.05).
2Children of Hispanic origin may be of any race.
3Significantly different from 200% FPL or more (p < 0.05).
NOTES: FPL is federal poverty level, which is based on the ratio of a family’s income in the previous calendar year to the appropriate poverty threshold defined by the U.S. Census Bureau. Chronic school absenteeism was categorized based on the survey question, “During the past 12 months, about how many days of school did [Sample Child] miss school because they had an illness, injury, or disability?” Responses of 15 or more days were categorized as chronic school absenteeism based on the U.S. Department of Education definition. Estimates are based on household interviews of a sample of the U.S. civilian noninstitutionalized population.
SOURCE: National Center for Health Statistics, National Health Interview Survey, 2022.
Data table for Figure 2. Percentage of children ages 5‒17 years who experienced chronic school absenteeism for health-related reasons in the past 12 months, by race and Hispanic origin and family income : United States, 2022
| Characteristic | Percent (95% confidence interval) | Standard error |
|---|---|---|
| Race and Hispanic origin | ||
| Asian, non-Hispanic | 1.4 (0.5‒3.1) | 0.58 |
| Black, non-Hispanic | 3.3 (1.8‒5.4) | 0.86 |
| White, non-Hispanic | 6.6 (5.5‒7.8) | 0.57 |
| Hispanic1 | 6.2 (4.8‒7.8) | 0.74 |
| FPL | ||
| Less than 100% FPL | 7.9 (5.6‒10.9) | 1.31 |
| 100% to less than 200% FPL | 7.4 (5.6‒9.6) | 0.98 |
| 200% FPL or more | 4.7 (3.9‒5.5) | 0.40 |
1Children of Hispanic origin may be of any race.
NOTES: FPL is federal poverty level, which is based on the ratio of a family’s income in the previous calendar year to the appropriate poverty threshold defined by the U.S. Census Bureau. Chronic school absenteeism was categorized based on the survey question, “During the past 12 months, about how many days of school did [Sample Child] miss school because they had an illness, injury, or disability?” Responses of 15 or more days were categorized as chronic school absenteeism based on the U.S. Department of Education definition. Estimates are based on household interviews of a sample of the U.S. civilian noninstitutionalized population.
SOURCE: National Center for Health Statistics, National Health Interview Survey, 2022.
Did the percentage of children who experienced chronic school absenteeism for health-related reasons in the past 12 months differ by disability status or health status?
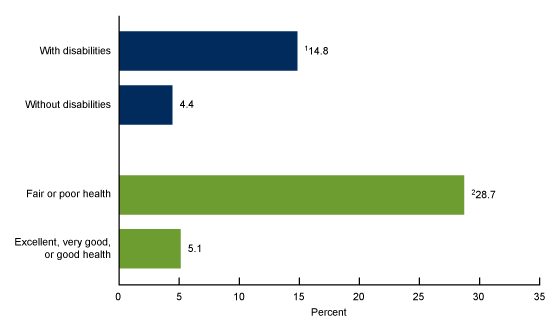
Children with disabilities were more likely to have experienced chronic school absenteeism (14.8%) compared with children without disabilities (4.4%) (Figure 3, Table 3). The percentage of children who experienced chronic school absenteeism was higher among children in fair or poor health (28.7%) compared with children in excellent, very good, or good health (5.1%).
Figure 3. Percentage of children ages 5‒17 years who experienced chronic school absenteeism for health-related reasons in the past 12 months, by disability status and health status: United States, 2022

1Significantly different from children without disabilities (p < 0.05).
2Significantly different from children in excellent, very good, or good health (p < 0.05).
NOTES: Chronic school absenteeism was categorized based on the survey question, “During the past 12 months, about how many days of school did [Sample Child] miss school because they had an illness, injury, or disability?” Responses of 15 or more days were categorized as chronic school absenteeism based on the U.S. Department of Education definition. Estimates are based on household interviews of a sample of the U.S. civilian noninstitutionalized population.
SOURCE: National Center for Health Statistics, National Health Interview Survey, 2022.
Data table for Figure 3. Percentage of children ages 5‒17 years who experienced chronic school absenteeism for health-related reasons in the past 12 months, by disability status and health status: United States, 2022
| Characteristic | Percent (95% confidence interval) | Standard error |
|---|---|---|
| Disability status | ||
| With disabilities | 14.8 (11.8‒18.3) | 1.61 |
| Without disabilities | 4.4 (3.7‒5.1) | 0.35 |
| Health status | ||
| Fair or poor health | 28.7 (20.5‒38.0) | 4.28 |
| Excellent, very good, or good health | 5.1 (4.4‒5.8) | 0.37 |
NOTES: Chronic school absenteeism was categorized based on the survey question, “During the past 12 months, about how many days of school did [Sample Child] miss school because they had an illness, injury, or disability?” Responses of 15 or more days were categorized as chronic school absenteeism based on the U.S. Department of Education definition. Estimates are based on household interviews of a sample of the U.S. civilian noninstitutionalized population.
SOURCE: National Center for Health Statistics, National Health Interview Survey, 2022.
Summary
In 2022, 5.8% of children experienced chronic school absenteeism for health-related reasons in the past 12 months. Differences by sex and age were not significant. However, White (6.6%) and Hispanic (6.2%) children were more likely to have experienced chronic school absenteeism compared with Black (3.3%) and Asian (1.4%) children. Children living in households with family incomes of less than 200% FPL had a higher percentage of chronic school absenteeism compared with children living in households with higher family incomes. Chronic school absenteeism was higher among children with disabilities and those in fair or poor health.
Data from the National Center for Education Statistics School Pulse Panel, a survey of school leaders, indicate that student chronic absenteeism has generally increased since the COVID-19 pandemic (6). NHIS is a large and nationally representative survey that can be used to highlight subgroup differences in chronic school absenteeism according to sociodemographic characteristics, health status, and disability status.
Definitions
Chronic school absenteeism for health-related reasons: Categorized based on the survey question, “During the past 12 months, about how many days of school did [Sample Child] miss school because they had an illness, injury, or disability?” Responses of 15 or more days were categorized as chronic school absenteeism based on the U.S. Department of Education definition (7).
Disability status: Defined by the reported level of difficulty (no difficulty, some difficulty, a lot of difficulty, or cannot do at all/unable to do) in 13 core functioning domains: 1) seeing, 2) hearing, 3) mobility, 4) self-care, 5) communication, 6) learning, 7) remembering, 8) concentrating, 9) accepting change, 10) controlling behavior, 11) making friends, 12) anxiety, and 13) depression. Children who were reported to have “a lot of difficulty” or “cannot do at all” to at least one of the domains (1‒11) or “daily” (domains 12 or 13) are classified in the “with disabilities” category. Children with “no difficulty” or “some difficulty” to all domains 1‒11 and “never” or “a few times a year” or “monthly” or “weekly” to domains 12 and 13 are classified in the “without disabilities” category.
Family income as a percentage of FPL: Based on the ratio of a family’s income in the previous calendar year to the appropriate poverty threshold (given a family’s size and number of children) defined by the U.S. Census Bureau (8). Family income was imputed when missing using the 2022 NHIS imputed income files (9).
Race and Hispanic origin: Categories shown for non-Hispanic children are for those who selected only one racial group; respondents had the option to select more than one racial group. Children categorized as Hispanic may be of any race or combination of races. Estimates for non-Hispanic children of races other than White only, Black only, or Asian only are not shown but are included in total estimates.
Data source and methods
Data from the 2022 NHIS Sample Child interview (n = 7,464) were used for this analysis. NHIS is a nationally representative household survey of the U.S. civilian noninstitutionalized population. It is conducted continuously throughout the year by the National Center for Health Statistics. Interviews are typically conducted in respondents’ homes, but follow-ups to complete interviews may be conducted over the telephone. Data collection procedures were disrupted due to the COVID-19 pandemic, and during 2022, 56.1% of Sample Child interviews were conducted at least partially by telephone (10). For more information about NHIS, visit: https://www.cdc.gov/nchs/nhis.htm.
Point estimates and the corresponding confidence intervals were calculated using SAS-callable SUDAAN software (11) to account for the complex sample design of NHIS. Linear and quadratic trends by age group and family income were evaluated using orthogonal polynomials in logistic regression; when trends were not significant, pairwise comparisons were also tested. All estimates are based on parent or guardian report and meet National Center for Health Statistics data presentation standards for proportions (12). Differences between percentages were evaluated using two-sided significance tests at the 0.05 level.
About the authors
Lindsey I. Black is with the National Center for Health Statistics, Division of Health Interview Statistics. Nazik Elgaddal is with the National Center for Health Statistics, Division of Analysis and Epidemiology.
References
- Gottfried MA. Chronic absenteeism and its effects on students’ academic and socioemotional outcomes. J Educ Stud Placed Risk 19(2):53‒75. 2014.
- Archambault I, Janosz M, Fallu JS, Pagani LS. Student engagement and its relationship with early high school dropout. J Adolesc 32(3):651–70. 2009.
- Champaloux SW, Young DR. Childhood chronic health conditions and educational attainment: A social ecological approach. J Adolesc Health 56(1):98–105. 2015.
- Allison MA, Attisha E, Council on School Health. The link between school attendance and good health. Pediatrics 143(2):e20183648. 2019.
- Wu Y, Daskalopoulou C, Muniz Terrera G, Sanchez Niubo A, Rodríguez-Artalejo F, Ayuso-Mateos L, et al. Education and wealth inequalities in healthy ageing in eight harmonised cohorts in the ATHLOS consortium: A population-based study. Lancet Public Health 5(7):e386‒94. 2020.
- National Center for Education Statistics. School Pulse Panel: Responses to the pandemic and efforts toward recovery (interactive results).
- U.S. Department of Education. Chronic absenteeism in the nation’s schools.
- U.S. Census Bureau. Poverty thresholds. 2022.
- National Center for Health Statistics. Multiple imputation of family income in 2022 National Health Interview Survey: Methods. 2023.
- National Center for Health Statistics. National Health Interview Survey, 2022 survey description. 2023.
- RTI International. SUDAAN (Release 11.0.3) [computer software]. 2018.
- Parker JD, Talih M, Malec DJ, Beresovsky V, Carroll M, Gonzalez JF Jr, et al. National Center for Health Statistics data presentation standards for proportions. National Center for Health Statistics. Vital Health Stat 2(175). 2017.
Suggested citation
Black LI, Elgaddal N. Chronic school absenteeism for health-related reasons among children ages 5‒17 years: United States, 2022. NCHS Data Brief, no 498. Hyattsville, MD: National Center for Health Statistics. 2024. DOI: https://dx.doi.org/10.15620/cdc/147885.
Copyright information
All material appearing in this report is in the public domain and may be reproduced or copied without permission; citation as to source, however, is appreciated.
National Center for Health Statistics
Brian C. Moyer, Ph.D., Director
Amy M. Branum, Ph.D., Associate Director for Science
Division of Health Interview Statistics
Steven J. Blumberg, Ph.D., Director
Anjel Vahratian, Ph.D., M.P.H., Associate Director for Science
Division of Analysis and Epidemiology
Irma E. Arispe, Ph.D., Director
Kimberly A. Lochner, Sc.D., Associate Director for Science