Arthritis in Adults Age 18 and Older: United States, 2022
- Key findings
- What percentage of adults had arthritis, and were differences observed by sex and age?
- Were differences by race and Hispanic origin observed in the percentages of adults with arthritis?
- How did the prevalence of arthritis vary by family income and education level?
- Did the percentage of adults with arthritis vary by urbanization level or region?
- Summary
Data from National Health Interview Survey
- In 2022, the age-adjusted prevalence of diagnosed arthritis in adults age 18 and older was 18.9%, with women (21.5%) more likely to have arthritis than men (16.1%).
- Arthritis increased with increasing age, from 3.6% in adults ages 18–34 to 53.9% in those age 75 and older.
- Black non-Hispanic, White non-Hispanic, and other and multiple-race non-Hispanic adults were more likely to have arthritis than Hispanic and Asian non-Hispanic adults.
- The prevalence of arthritis decreased with increasing family income, from 24.7% among those with family income less than 100% of the federal poverty level to 16.6% among those with family income at 400% of the federal poverty level or more.
- The percentage of adults with arthritis increased with decreasing urbanization level and varied by region.
Arthritis is inflammation affecting the tissues surrounding joints, with common symptoms that include pain, redness, heat, and swelling in joints (1,2). Arthritis is a leading cause of disability, and adults with arthritis can experience difficulties in functioning (3–5). This report uses 2022 National Health Interview Survey (NHIS) data to describe the percentage of adults age 18 and older who had diagnosed arthritis by selected sociodemographic characteristics.
Keywords: osteoarthritis, joint inflammation, activity limitation, disability, National Health Interview Survey
What percentage of adults had arthritis, and were differences observed by sex and age?
- In 2022, the age-adjusted prevalence of diagnosed arthritis in adults was 18.9% (Figure 1).
- Women (21.5%) were more likely than men (16.1%) to have arthritis.
- The percentage of adults with arthritis increased with age, from 3.6% in adults ages 18–34 to 53.9% in adults age 75 and older.
Figure 1. Age-adjusted percentage of adults age 18 and older with arthritis, by sex and age group: United States, 2022

1Significantly different from women (p < 0.05).
2Significant linear trend (p < 0.05).
NOTES: Having arthritis is based on a positive response to the survey question, “Have you ever been told by a doctor or other health professional that you had some form of arthritis, rheumatoid arthritis, gout, lupus, or fibromyalgia?” Estimates are age adjusted by the direct method to the 2000 Census population using age groups 18–34, 35–49, 50–64, 65–74, and 75 and older. Age-specific percentages are not age adjusted. Access data table for Figure 1.
SOURCE: National Center for Health Statistics, National Health Interview Survey, 2022.
Were differences by race and Hispanic origin observed in the percentages of adults with arthritis?
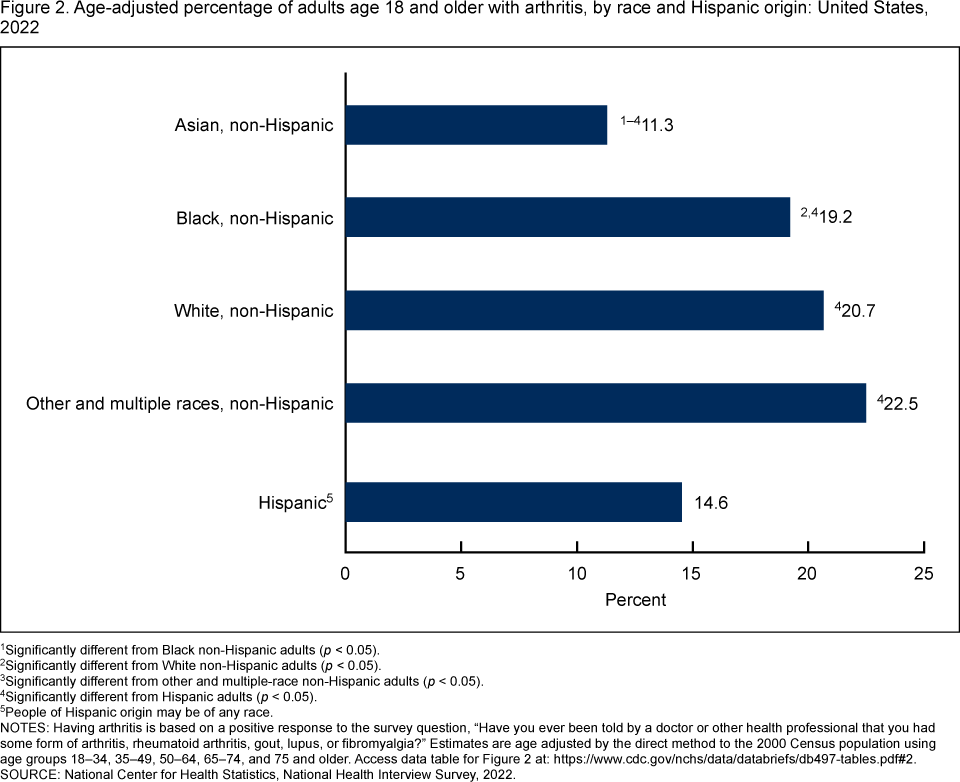
- Black non-Hispanic (subsequently, Black) adults (19.2%), White non-Hispanic (subsequently, White) adults (20.7%), and other and multiple-race non-Hispanic adults (22.5%) were more likely to have arthritis than Hispanic (14.6%) and Asian non-Hispanic (subsequently, Asian) (11.3%) adults (Figure 2).
- Hispanic adults were more likely to have arthritis than Asian adults.
Figure 2. Age-adjusted percentage of adults age 18 and older with arthritis, by race and Hispanic origin: United States, 2022
1Significantly different from Black non-Hispanic adults (p < 0.05).
2Significantly different from White non-Hispanic adults (p < 0.05).
3Significantly different from other and multiple-race non-Hispanic adults (p < 0.05).
4Significantly different from Hispanic adults (p < 0.05).
5People of Hispanic origin may be of any race.
NOTES: Having arthritis is based on a positive response to the survey question, “Have you ever been told by a doctor or other health professional that you had some form of arthritis, rheumatoid arthritis, gout, lupus, or fibromyalgia?” Estimates are age adjusted by the direct method to the 2000 Census population using age groups 18–34, 35–49, 50–64, 65–74, and 75 and older. Access data table for Figure 2.
SOURCE: National Center for Health Statistics, National Health Interview Survey, 2022.
How did the prevalence of arthritis vary by family income and education level?
- The percentage of adults with arthritis decreased with increasing family income, from 24.7% among adults with family income less than 100% of the federal poverty level (FPL), 21.9% among those with income at 100% to less than 200% FPL, 19.2% among those with income at 200% to less than 400% FPL, to 16.6% among those with income at 400% FPL or more (Figure 3).
- Adults who graduated from college were less likely to have arthritis (15.3%) than those with a high school education or less (20.0%) or some college (21.6%).
Figure 3. Age-adjusted percentage of adults age 18 and older with arthritis, by family income and education level: United States, 2022

1Significant linear trend (p < 0.05).
2Significantly different from some college (p < 0.05).
3Significantly different from college graduate (p < 0.05).
NOTES: Having arthritis is based on a positive response to the survey question, “Have you ever been told by a doctor or other health professional that you had some form of arthritis, rheumatoid arthritis, gout, lupus, or fibromyalgia?” FPL is federal poverty level, which is based on a ratio of the family’s income in the previous calendar year to the appropriate poverty threshold defined by the U.S. Census Bureau. Estimates are age adjusted by the direct method to the 2000 Census population using age groups 18–34, 35–49, 50–64, 65–74, and 75 and older. Access data table for Figure 3.
SOURCE: National Center for Health Statistics, National Health Interview Survey, 2022.
Did the percentage of adults with arthritis vary by urbanization level or region?
- The percentage of adults with arthritis increased as urbanization level decreased, from 16.1% of adults living in large central metropolitan areas, 18.2% living in large fringe metropolitan areas, 20.3% living in medium and small metropolitan areas, to 23.5% living in nonmetropolitan areas (Figure 4).
- Adults living in the Midwest (20.0%) and South (19.3%) generally were more likely to have arthritis than those living in the Northeast (18.2%) or West (18.0%), but the difference between South and Northeast was not significant.
Figure 4. Age-adjusted percentage of adults age 18 and older with arthritis, by urbanization level and region: United States, 2022

1Significant linear trend (p < 0.05).
2Significantly different from Midwest (p < 0.05).
3Significantly different from West (p < 0.05).
NOTES: Having arthritis is based on a positive response to the survey question, “Have you ever been told by a doctor or other health professional that you had some form of arthritis, rheumatoid arthritis, gout, lupus, or fibromyalgia?” Estimates are age adjusted by the direct method to the 2000 Census population using age groups 18–34, 35–49, 50–64, 65–74, and 75 and older. Access data table for Figure 4.
SOURCE: National Center for Health Statistics, National Health Interview Survey, 2022.
Summary
This report describes national estimates of diagnosed arthritis in adults age 18 and older by selected sociodemographic characteristics using data from NHIS. In 2022, the age-adjusted percentage of adults with arthritis was 18.9%. The prevalence of arthritis in adults increased with age, and women were more likely than men to have arthritis. The prevalence of arthritis decreased with increasing family income. Asian adults were less likely than adults of all other racial and ethnic groups to have arthritis. Adults living in nonmetropolitan areas were most likely to have arthritis, and the prevalence decreased with increasing urbanization level.
Arthritis affects health and functioning and is a leading cause of disability (3,4). Healthy People 2030 includes objectives to reduce pain, limitations, and disability from arthritis (6).
Definitions
Arthritis: Based on a yes response to the survey question, “Have you ever been told by a doctor or other health professional that you had some form of arthritis, rheumatoid arthritis, gout, lupus, or fibromyalgia?”
Family income as a percentage of FPL: Based on FPL, which was calculated from the family’s income in the previous calendar year and family size using the U.S. Census Bureau’s poverty thresholds (7). The 2022 NHIS imputed income files were used to create the poverty levels. Family income was imputed when missing (8).
Race and Hispanic origin: Adults categorized as Hispanic may be of any race or combination of races. Adults categorized as Asian non-Hispanic, Black non-Hispanic, or White non-Hispanic indicated one race only. The category “Other and multiple races, non-Hispanic” includes those who did not identify as White, Black, Asian, or Hispanic, or who identified as more than one race.
Region: Based on the geographic classification of the U.S. population, states are grouped into four regions that are used by the U.S. Census Bureau:
- Midwest: Illinois, Indiana, Iowa, Kansas, Michigan, Minnesota, Missouri, Nebraska, North Dakota, Ohio, South Dakota, and Wisconsin
- Northeast: Connecticut, Maine, Massachusetts, New Hampshire, New Jersey, New York, Pennsylvania, Rhode Island, and Vermont
- South: Alabama, Arkansas, Delaware, District of Columbia, Florida, Georgia, Kentucky, Louisiana, Maryland, Mississippi, North Carolina, Oklahoma, South Carolina, Tennessee, Texas, Virginia, and West Virginia
- West: Alaska, Arizona, California, Colorado, Hawaii, Idaho, Montana, Nevada, New Mexico, Oregon, Utah, Washington, and Wyoming
Urbanization level: Categorized by collapsing the 2013 National Center for Health Statistics Urban–Rural Classification Scheme for counties (9) into four categories: large central metropolitan, large fringe metropolitan, medium and small metropolitan, and nonmetropolitan (counties in micropolitan statistical areas and nonmetropolitan counties).
Data source and methods
Data from the 2022 NHIS were used for this analysis. NHIS is a nationally representative household survey of the U.S. civilian noninstitutionalized population. It is conducted continuously throughout the year by the National Center for Health Statistics. Interviews are conducted in respondents’ homes, but follow-ups to complete interviews may be conducted over the telephone. In 2022, 55.7% of the Sample Adult interviews were conducted at least partially by telephone (10). For more information about NHIS, visit https://www.cdc.gov/nchs/nhis.htm. Point estimates and corresponding variances for this analysis were calculated using SAS-callable SUDAAN software version 11.0 (11) to account for the complex sample design of NHIS. All estimates are based on self-report and meet National Center for Health Statistics data presentation standards for proportions (12). Differences between percentages were evaluated using two-sided significance tests at the 0.05 level. Linear and quadratic trends by age group and family income were evaluated using orthogonal polynomials in logistic regression. Estimates were age adjusted to the 2000 U.S. Census population using the direct method for age groups 18–34, 35–49, 50–64, 65–74, and 75 and older (13).
About the authors
Nazik Elgaddal, Ellen A. Kramarow, Julie D. Weeks, and Cynthia Reuben are with the National Center for Health Statistics, Division of Analysis and Epidemiology.
References
- National Center for Chronic Disease Prevention and Health Promotion. Arthritis types.
- National Institute of Arthritis and Musculoskeletal and Skin Diseases. Arthritis.
- Theis KA, Steinweg A, Helmick CG, Courtney-Long E, Bolen JA, Lee R. Which one? What kind? How many? Types, causes, and prevalence of disability among U.S. adults. Disability Health J 12(3):411–21. 2019.
- Theis KA, Murphy LB, Guglielmo D, Boring MA, Okoro CA, Duca LM, Helmick CG. Prevalence of arthritis and arthritis-attributable activity limitation—United States, 2016–2018. MMWR Morb Mortal Wkly Rep 70(40):1401–7. 2021.
- Fallon EA, Boring MA, Foster AL, Stowe EW, Lites TD, Odom EL, Seth P. Prevalence of diagnosed arthritis—United States, 2019–2021. MMWR Morb Mortal Wkly Rep 72(41):1101–7. 2023.
- U.S. Department of Health and Human Services, Office of Disease Prevention and Health Promotion. Healthy People 2030 objectives and data: Arthritis. 2022.
- U.S. Census Bureau. Poverty thresholds. 2023.
- National Center for Health Statistics. Multiple imputation of family income in 2021 National Health Interview Survey: Methods. 2022.
- Ingram DD, Franco SJ. 2013 NCHS urban−rural classification scheme for counties. National Center for Health Statistics. Vital Health Stat 2(166). 2014.
- National Center for Health Statistics. National Health Interview Survey: 2022 survey description. 2023.
- RTI International. SUDAAN (Release 11.0.3) [computer software]. 2018.
- Parker JD, Talih M, Malec DJ, Beresovsky V, Carroll M, Gonzalez JF Jr, et al. National Center for Health Statistics data presentation standards for proportions. National Center for Health Statistics. Vital Health Stat 2(175). 2017.
- Klein RJ, Schoenborn CA. Age adjustment using the 2000 projected U.S. population. Healthy People 2010 Statistical Notes, no 20. Hyattsville, MD: National Center for Health Statistics. 2001.
Suggested citation
Elgaddal N, Kramarow EA, Weeks JD, Reuben C. Arthritis in adults age 18 and older: United States, 2022. NCHS Data Brief, no 497. Hyattsville, MD: National Center for Health Statistics. 2024. DOI: https://dx.doi.org/10.15620/cdc:145594.
Copyright information
All material appearing in this report is in the public domain and may be reproduced or copied without permission; citation as to source, however, is appreciated.
National Center for Health Statistics
Brian C. Moyer, Ph.D., Director
Amy M. Branum, Ph.D., Associate Director for Science
Division of Analysis and Epidemiology
Irma E. Arispe, Ph.D., Director
Kimberly A. Lochner, Sc.D., Associate Director for Science