Hysterectomy Among Women Age 18 and Older: United States, 2021
NCHS Data Brief No. 494, February 2024
PDF Version (416 KB)
Yelena Gorina, M.P.H., M.S., Nazik Elgaddal, M.S., and Julie D. Weeks, Ph.D.
- Key findings
- The percentage of women who have had a hysterectomy increased with age.
- The percentage of women who have had a hysterectomy was lowest among Asian non-Hispanic women and women without disabilities.
- The percentage of women who have had a hysterectomy varied by education level and family income.
- The percentage of women who have had a hysterectomy increased as level of urbanization decreased and varied by region.
- Summary
Data from the National Health Interview Survey
- In 2021, the age-adjusted percentage of women age 18 and older who had received a hysterectomy was 14.6%, with the percentage increasing with age, from 2.8% among those ages 18–44 to 41.8% among those age 75 and older.
- Asian non-Hispanic women were least likely to have had a hysterectomy (6.1%), followed by Hispanic (12.5%), White non-Hispanic (15.6%), and Black non-Hispanic (16.3%) women.
- Women with disabilities (20.9%) were more likely to have had a hysterectomy compared with women without disabilities (14.1%).
- The percentage of women who have had a hysterectomy varied by education level and family income.
- The percentage of women who have had a hysterectomy increased with decreasing urbanization level and varied by region of residence.
Hysterectomy is one of the most common procedures for women in the United States (1,2). Hysterectomy removes the uterus and is used to treat conditions such as uterine fibroids, endometriosis, and gynecological cancer (3). It can be performed on an inpatient or outpatient basis (4,5). This report uses 2021 National Health Interview Survey (NHIS) data to describe the percentage of women age 18 and older who have had a hysterectomy by selected sociodemographic characteristics.
Keywords: women’s health, reproductive health, race and Hispanic origin, disability, National Health Interview Survey
The percentage of women who have had a hysterectomy increased with age.
- In 2021, the age-adjusted percentage of women age 18 and older who had received a hysterectomy was 14.6% (Figure 1).
- The percentage of women who have had a hysterectomy increased with age, from 2.8% for women ages 18–44 to 22.1% for women ages 45–64, 35.0% for women ages 65–74, and 41.8% for women age 75 and older.
Figure 1. Percentage of women who have had a hysterectomy, by age group: United States, 2021

1Significant quadratic trend by age (p < 0.05).
NOTES: Based on a positive response to the survey question, “A hysterectomy is when the uterus or womb is removed, this is different from having your tubes tied. Have you had a hysterectomy?” Total estimate is age adjusted by the direct method to the 2000 projected U.S. population using age groups 18–44, 45–64, 65–74, and 75 and older. The crude total percentage of women who have had a hysterectomy is 17.2%. Estimates are based on household interviews of a sample of the U.S. civilian noninstitutionalized population. Access data table for Figure 1.
SOURCE: National Center for Health Statistics, National Health Interview Survey, 2021.
The percentage of women who have had a hysterectomy was lowest among Asian non-Hispanic women and women without disabilities.
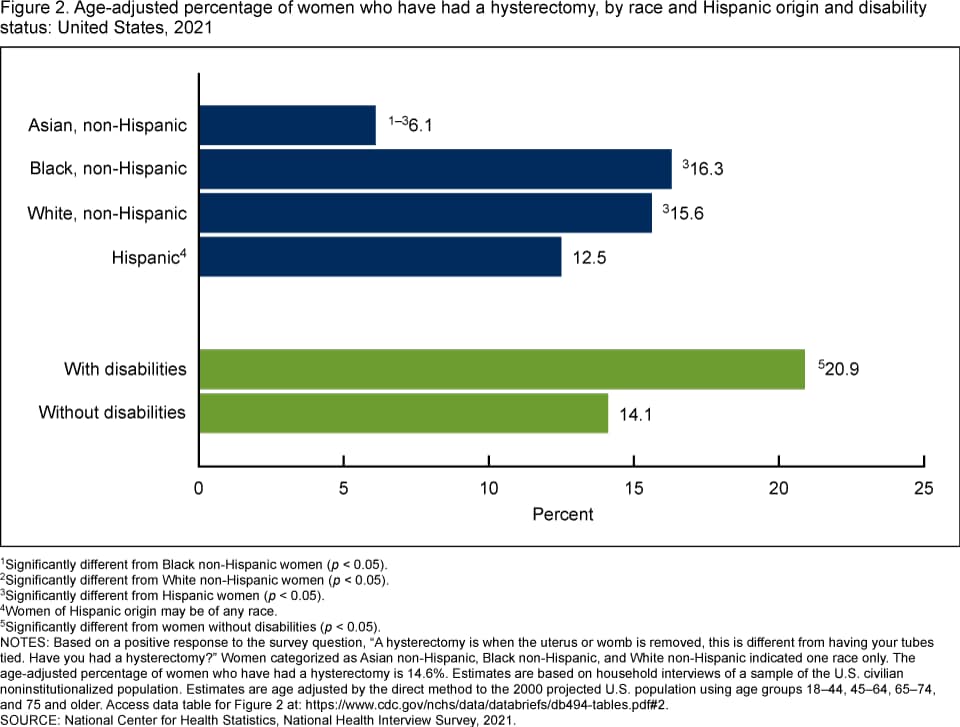
- Asian non-Hispanic (subsequently, Asian) women were less likely to have had a hysterectomy (6.1%) than Black non-Hispanic (subsequently, Black) (16.3%), White non-Hispanic (subsequently, White) (15.6%), and Hispanic (12.5%) women (Figure 2).
- Hispanic women were less likely to have had a hysterectomy compared with Black or White women.
- Women with disabilities were more likely to have had a hysterectomy (20.9%) compared with women without disabilities (14.1%).
Figure 2. Age-adjusted percentage of women who have had a hysterectomy, by race and Hispanic origin and disability status: United States, 2021
1Significantly different from Black non-Hispanic women (p < 0.05)
2Significantly different from White non-Hispanic women (p < 0.05)
3Significantly different from Hispanic women (p < 0.05).
4Women of Hispanic origin may be of any race.
5Significantly different from women without disabilities (p < 0.05).
NOTES: Based on a positive response to the survey question, “A hysterectomy is when the uterus or womb is removed, this is different from having your tubes tied. Have you had a hysterectomy?” Women categorized as Asian non-Hispanic, Black non-Hispanic, and White non-Hispanic indicated one race only. The age-adjusted percentage of women who have had a hysterectomy is 14.6%. Estimates are based on household interviews of a sample of the U.S. civilian noninstitutionalized population. Estimates are age adjusted by the direct method to the 2000 projected U.S. population using age groups 18–44, 45–64, 65–74, and 75 and older. Access data table for Figure 2.
SOURCE: National Center for Health Statistics, National Health Interview Survey, 2021.
The percentage of women who have had a hysterectomy varied by education level and family income.
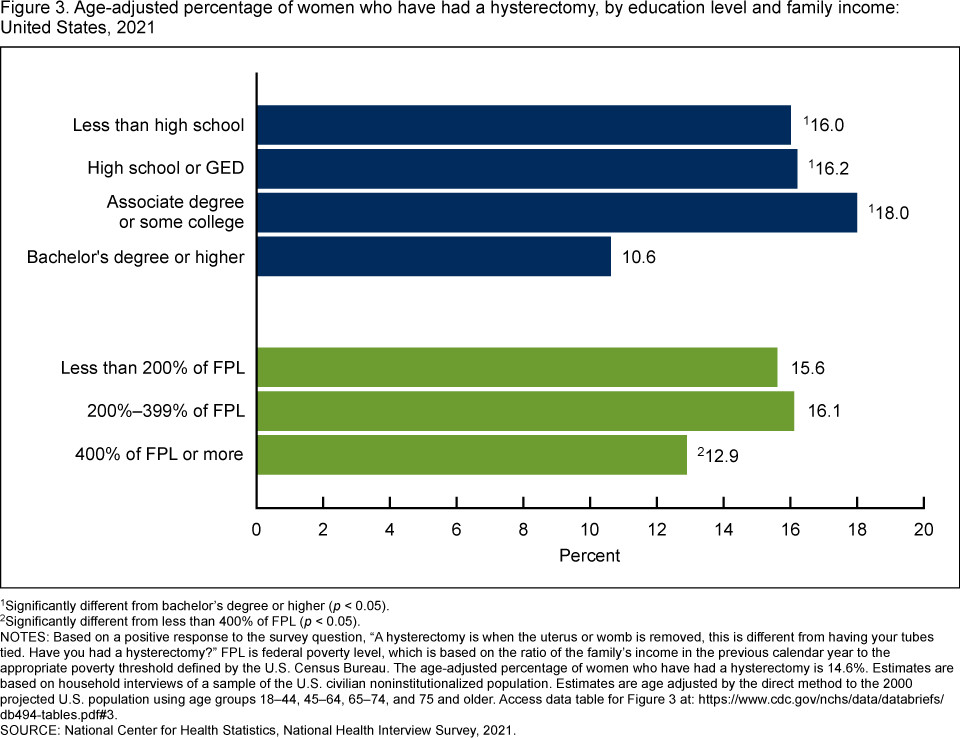
- The percentage of women who have had a hysterectomy was lowest among women with a bachelor’s degree or higher (10.6%) compared with women with less than a high school education (16.0%), those with a high school diploma or GED (16.2%), and those with an associate degree or some college (18.0%) (Figure 3).
- Women with a family income of 400% or more of the federal poverty level (12.9%) were less likely to have had a hysterectomy compared with those with a family income of 200% to 399% of the federal poverty level (16.1%) and those with a family income of less than 200% of the federal poverty level (15.6%).
Figure 3. Age-adjusted percentage of women who have had a hysterectomy, by education level and family income: United States, 2021
1Significantly different from bachelor’s degree or higher (p < 0.05).
2Significantly different from less than 400% of FPL (p < 0.05).
NOTES: Based on a positive response to the survey question, “A hysterectomy is when the uterus or womb is removed, this is different from having your tubes tied. Have you had a hysterectomy?” FPL is federal poverty level, which is based on the ratio of the family’s income in the previous calendar year to the appropriate poverty threshold defined by the U.S. Census Bureau. The age-adjusted percentage of women who have had a hysterectomy is 14.6%. Estimates are based on household interviews of a sample of the U.S. civilian noninstitutionalized population. Estimates are age adjusted by the direct method to the 2000 projected U.S. population using age groups 18–44, 45–64, 65–74, and 75 and older. Access data table for Figure 3.
SOURCE: National Center for Health Statistics, National Health Interview Survey, 2021.
The percentage of women who have had a hysterectomy increased as level of urbanization decreased and varied by region.
- The percentage of women who have had a hysterectomy increased with decreasing urbanization level, from 11.8% for those living in large central metropolitan areas to 12.8% for those in large fringe metropolitan areas, 16.8% for those in medium and small metropolitan areas, and 19.0% for those in nonmetropolitan areas (Figure 4).
- Women living in the Midwest and South regions (15.5% and 16.9%, respectively) were more likely to have had a hysterectomy compared with those living in the West (13.3%) and Northeast (10.2%) regions.
Figure 4. Age-adjusted percentage of women who have had a hysterectomy, by urbanization level and census region: United States, 2021

1Significant linear trend by urbanization level (p < 0.05).
2Significantly different from women in Midwest region (p < 0.05).
3Significantly different from women in South region (p < 0.05).
4Significantly different from women in West region (p < 0.05).
NOTES: Based on a positive response to the survey question, “A hysterectomy is when the uterus or womb is removed, this is different from having your tubes tied. Have you had a hysterectomy?” The age-adjusted percentage of women who have had a hysterectomy is 14.6%. Estimates are based on household interviews of a sample of the U.S. civilian noninstitutionalized population. Estimates are age adjusted by the direct method to the 2000 projected U.S. population using age groups 18–44, 45–64, 65–74, and 75 and older. Access data table for Figure 4.
SOURCE: National Center for Health Statistics, National Health Interview Survey, 2021.
Summary
In 2021, the age-adjusted percentage of women age 18 and older who have had a hysterectomy was 14.6%, while the overall crude estimate was 17.2%. The percentage was higher among Black, White, and Hispanic women compared with Asian women. The percentage of women with disabilities who have had a hysterectomy was higher than those without disabilities. Women with a bachelor’s degree or higher were less likely to have had a hysterectomy compared with those who reported lower education levels, and women with a family income of 400% or more of the federal poverty level were less likely to have had a hysterectomy compared with women with lower family income levels. The percentage of women who have had a hysterectomy increased as rurality increased and was highest in nonmetropolitan areas and among those living in the Midwest and South regions. Hysterectomy is one of the most common procedures performed on women in the United States and plays a major role in gynecological surgery and treatment of uterine and cervical cancers (3,5–7). Using nationally representative data, this report provides the overall prevalence of hysterectomy and measures disparities among adult women by selected sociodemographic characteristics.
Definitions
Disability status: Categorized by the level of difficulty reported in the Washington Group Short Set on Functioning (8). The six domains of functioning include: seeing (even if wearing glasses), hearing (even if wearing hearing aids), mobility (walking or climbing stairs), communication (understanding or being understood by others), cognition (remembering or concentrating), and self-care (such as washing all over or dressing). Adults who respond “a lot of difficulty” or “cannot do at all/unable to do” to at least one domain are considered to have disabilities.
Family income as a percentage of federal poverty level: Derived from the ratio of the family’s income in the previous calendar year to the appropriate poverty threshold defined by the U.S. Census Bureau (9). Family income was imputed when missing (10).
Hysterectomy: The prevalence of hysterectomy is based on responses to questions where the respondent reported having had a hysterectomy as a reason for never having or not having had a test for cervical screening in the last 5 years as well as a response of “yes” to the question “A hysterectomy is when the uterus or womb is removed, this is different from having your tubes tied. Have you had a hysterectomy?”
Race and Hispanic origin: Women categorized as Hispanic may be of any race or combination of races. Categories shown for non-Hispanic women are for those who selected only one racial group; respondents had the option to select more than one racial group.
Urbanization level: Urbanization level was determined using the 2013 NCHS Urban–Rural Classification Scheme for Counties (11). Urbanization was categorized into four levels: large central metropolitan; large fringe metropolitan; medium and small metropolitan, which represent urban counties; and nonmetropolitan, including micropolitan and noncore counties, which represents rural counties.
Region: Based on the geographic classification of the U.S. population, states are grouped into four regions that are defined by the U.S. Census Bureau:
- Midwest: Illinois, Indiana, Iowa, Kansas, Michigan, Minnesota, Missouri, Nebraska, North Dakota, Ohio, South Dakota, and Wisconsin.
- Northeast: Connecticut, Maine, Massachusetts, New Hampshire, New Jersey, New York, Pennsylvania, Rhode Island, and Vermont.
- South: Alabama, Arkansas, Delaware, District of Columbia, Florida, Georgia, Kentucky, Louisiana, Maryland, Mississippi, North Carolina, Oklahoma, South Carolina, Tennessee, Texas, Virginia, and West Virginia.
- West: Alaska, Arizona, California, Colorado, Hawaii, Idaho, Montana, Nevada, New Mexico, Oregon, Utah, Washington, and Wyoming.
Data source and methods
Data from the 2021 NHIS were used for this analysis. NHIS is a nationally representative household survey of the U.S. civilian noninstitutionalized population. It is conducted continuously throughout the year by the National Center for Health Statistics. Interviews are conducted in respondents’ homes, but follow-ups to complete interviews may be conducted over the telephone. Because of the COVID-19 pandemic, interviewing procedures were disrupted and 62.8% of Sample Adult interviews were conducted at least partially by telephone during 2021. NHIS includes information on hysterectomy as part of its rotating content (12). For more information about NHIS, visit: https://www.cdc.gov/nchs/nhis.htm.
Point estimates and corresponding variances were calculated using SUDAAN version 11.0 software (13) to account for the complex sample design of NHIS. Estimates are age adjusted by the direct method to the 2000 projected U.S. population using age groups 18–44, 45–64, 65–74, and 75 and older. Tests for linear and quadratic trends were evaluated using orthogonal polynomials in logistic regression. Differences between percentages were evaluated using two-sided significance tests at the 0.05 level. All estimates in this report meet National Center for Health Statistics standards of reliability as specified in “National Center for Health Statistics Data Presentation Standards for Proportions” (14).
About the authors
Yelena Gorina, Nazik Elgaddal, and Julie D. Weeks are with the National Center for Health Statistics, Division of Analysis and Epidemiology.
References
- Simms KT, Yuill S, Killen J, Smith MA, Kulasingam S, de Kok IM, et al. Historical and projected hysterectomy rates in the USA: Implications for future observed cervical cancer rates and evaluating prevention interventions. Gynecol Oncol 158(3):710–8. 2020.
- Harvey SV, Pfeiffer RM, Landy R, Wentzensen N, Clarke MA. Trends and predictors of hysterectomy prevalence among women in the United States. Am J Obstet Gynecol 227:611.e1–12. 2022.
- American College of Obstetricians and Gynecologists. Hysterectomy.
- Moawad G, Liu E, Song C, Fu AZ. Movement to outpatient hysterectomy for benign indications in the United States, 2008–2014. PLoS One 12(11):e0188812. 2017.
- Cappuccio S, Li Y, Song C, Liu E, Glaser G, Casarin J, et al. The shift from inpatient to outpatient hysterectomy for endometrial cancer in the United States: Trends, enabling factors, cost, and safety. Int J Gynecol Cancer 31(5):686–93. 2021.
- Krentel H, De Wilde RL, Pados G. The role of hysterectomy in modern gynaecological surgery. Biomed Res Int 2022:9847163. 2022.
- Adam EE, White MC, Saraiya M. Higher prevalence of hysterectomy among rural women than urban women: Implications for measures of disparities in uterine and cervical cancers. J Rural Health 38(2):416–9. 2022.
- Washington Group on Disability Statistics. The Washington Group short set on functioning (WG-SS). 2022.
- U.S. Census Bureau. Poverty thresholds. 2024.
- National Center for Health Statistics. Multiple imputation of family income in 2021 National Health Interview Survey: Methods. 2022.
- Ingram DD, Franco SJ. 2013 NCHS urban–rural classification scheme for counties. National Center for Health Statistics. Vital Health Stat 2(166). 2014.
- National Center for Health Statistics. National Health Interview Survey: 2021 survey description. 2022.
- RTI International. SUDAAN (Release 11.0.3) [computer software]. 2018.
- Parker JD, Talih M, Malec DJ, Beresovsky V, Carroll M, Gonzalez JF Jr, et al. National Center for Health Statistics data presentation standards for proportions. National Center for Health Statistics. Vital Health Stat 2(175). 2017.
Suggested citation
Gorina Y, Elgaddal N, Weeks JD. Hysterectomy among women age 18 and older: United States, 2021. NCHS Data Brief, no 494. Hyattsville, MD: National Center for Health Statistics. 2024. DOI: https://dx.doi.org/10.15620/cdc:145592.
Copyright information
All material appearing in this report is in the public domain and may be reproduced or copied without permission; citation as to source, however, is appreciated.
National Center for Health Statistics
Brian C. Moyer, Ph.D., Director
Amy M. Branum, Ph.D., Associate Director for Science
Division of Analysis and Epidemiology
Irma E. Arispe, Ph.D., Director
Kimberly A. Lochner, Sc.D., Associate Director for Science