Telemedicine Use Among Physicians by Physician Specialty: United States, 2021
- Key findings
- Telemedicine use varied by physician specialty.
- Physician ability to provide a similar quality of care during telemedicine visits compared with in-person visits varied by specialty.
- Physician satisfaction with telemedicine technology for patient visits varied by specialty.
- The percentage of physicians reporting the appropriateness of telemedicine technology varied by physician specialty.
- Summary
Data from the National Electronic Health Records Survey
- More medical specialists (27.4%) used telemedicine for 50% of their patient visits or more than primary care physicians and surgical specialists.
- Most primary care physicians (76.7%) and medical specialists (73.1%) were able to provide a similar quality of care during telemedicine visits as in-person visits “to some extent or a great extent” compared with about one-half of surgical specialists (50.6%).
- Primary care and medical specialists were more likely to be satisfied with telemedicine technology compared with surgical specialists.
- Surgical specialists were most likely to indicate that telemedicine technology was not appropriate for their specialty or patients (49.7%), followed by medical specialists (26.7%) and primary care physicians (15.5%).
The 2019 novel coronavirus (COVID-19) pandemic led to an increase in telemedicine use among physicians, from 15.4% in 2019 to 86.5% in 2021 (1–4). Interest has increased in how telemedicine has affected a physician’s ability to deliver quality care similar to an in-person office visit, and in technological barriers to telemedicine use (5). This report describes telemedicine use and challenges among physicians sampled in the 2021 National Electronic Health Records Survey. This report builds upon previous work (4) and describes the use of telemedicine, ability to provide quality care during telemedicine visits, satisfaction with telemedicine, and appropriateness of telemedicine use by physician specialty type.
Keywords: office-based physicians, telemedicine satisfaction, telemedicine barriers, National Electronic Health Records Survey
Telemedicine use varied by physician specialty.
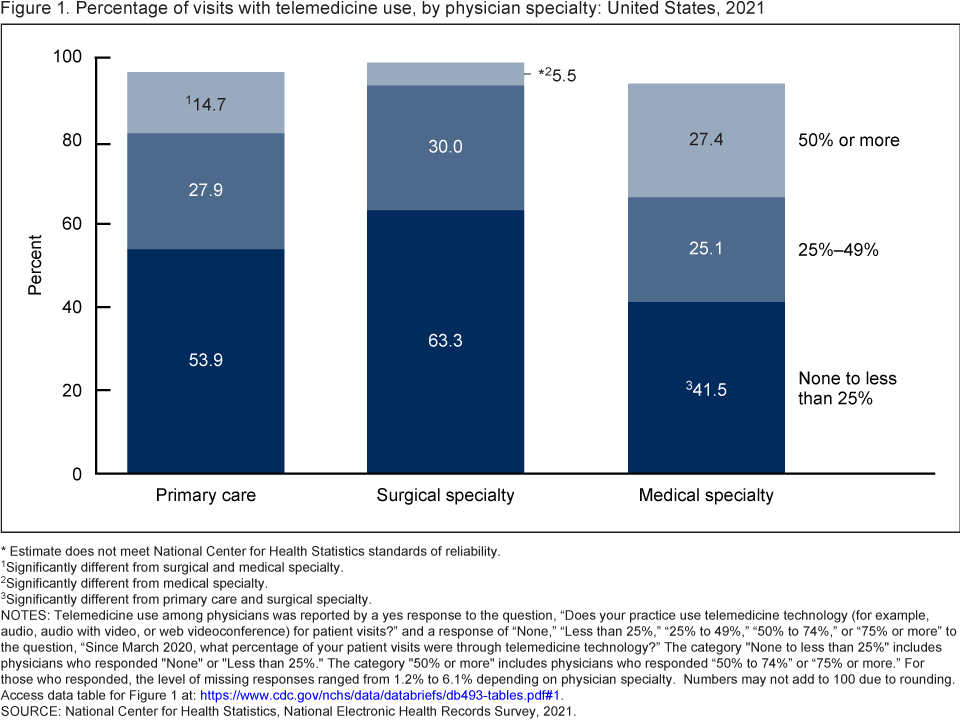
- Among primary care physicians, use of telemedicine technology decreased with an increasing percentage of visits: 53.9% used telemedicine for less than 25% of visits, 27.9% used telemedicine at 25%–49% of visits, and 14.7% used telemedicine at 50% of visits or more (Figure 1).
- This pattern of use was similar among surgical specialists, declining from 63.3% for less than 25% of visits to 5.5% for 50% of visits or more (this estimate did not meet standards of statistical reliability).
- Among medical specialists, the percentage using telemedicine was greater for less than 25% of visits (41.5%) compared with 25%–49% of visits (25.1%) and 50% of visits or more (27.4%).
- The percentage of telemedicine use at less than 25% of visits was lowest among medical specialists compared with primary care physicians and surgical specialists. The percentage was similar by specialty type for 25%–49% of visits, and was highest for medical specialists for use at 50% of visits or more.
Figure 1. Percentage of visits with telemedicine use, by physician specialty: United States, 2021
* Estimate does not meet National Center for Health Statistics standards of reliability.
1Significantly different from surgical and medical specialty.
2Significantly different from medical specialty.
3Significantly different from primary care and surgical specialty.
NOTES: Telemedicine use among physicians was reported by a yes response to the question, “Does your practice use telemedicine technology (for example, audio, audio with video, or web videoconference) for patient visits?” and a response of “None,” “Less than 25%,” “25% to 49%,” “50% to 74%,” or “75% or more” to the question, “Since March 2020, what percentage of your patient visits were through telemedicine technology?” The category “None to less than 25%” includes physicians who responded “None” or “Less than 25%.” The category “50% or more” includes physicians who responded “50% to 74%” or “75% or more.” For those who responded, the level of missing responses ranged from 1.2% to 6.1% depending on physician specialty. Numbers may not add to 100 due to rounding. Access data table for Figure 1.
SOURCE: National Center for Health Statistics, National Electronic Health Records Survey, 2021.
Physician ability to provide a similar quality of care during telemedicine visits compared with in-person visits varied by specialty.
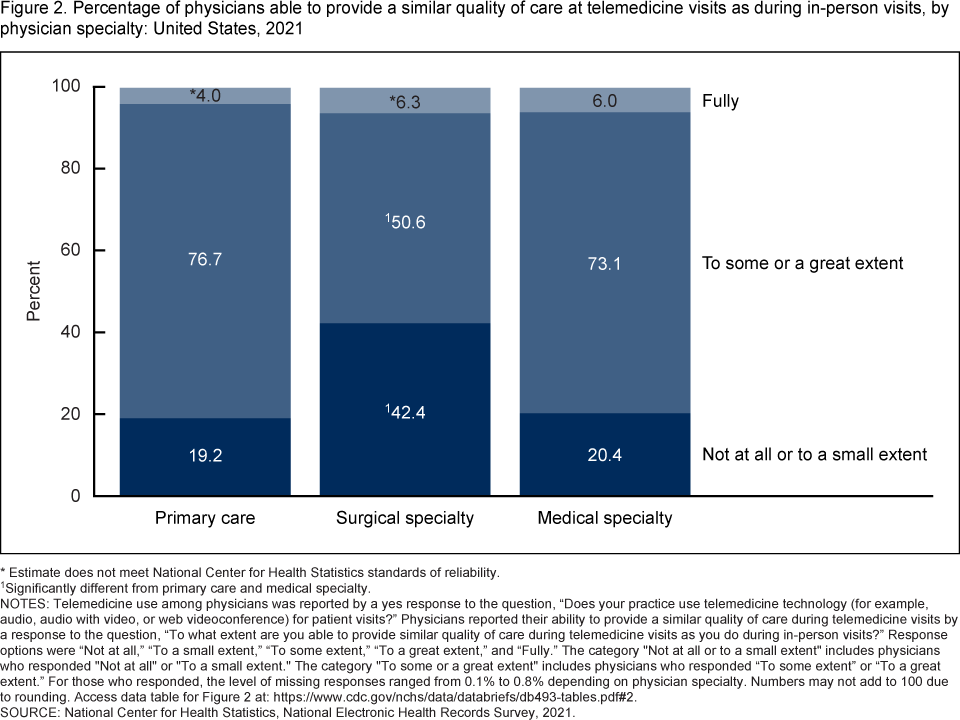
- Among primary care physicians, 19.2% responded “not at all or to a small extent” and 76.7% responded “to some or a great extent” when asked if they were able to provide a similar quality of care during telemedicine visits compared with in-person visits (Figure 2).
- For surgical specialists, 42.4% responded “not at all or to a small extent” when asked if they were able to provide a similar quality of care during telemedicine visits compared with in-person visits. About one-half reported being able to provide a similar quality of care “to some or a great extent” (50.6%).
- Among medical specialists, 20.4% responded “not at all or to a small extent” and 73.1% responded “to some or a great extent” when asked if they were able to provide a similar quality of care during telemedicine visits compared with in-person visits.
- The percentage of physicians who responded “not at all or to a small extent” when asked if they were able to provide a similar quality of care during telemedicine visits compared with in-person visits was highest among surgical specialists.
Figure 2. Percentage of physicians able to provide a similar quality of care at telemedicine visits as during in-person visits, by physician specialty: United States, 2021
* Estimate does not meet National Center for Health Statistics standards of reliability.
1Significantly different from primary care and medical specialty.
NOTES: Telemedicine use among physicians was reported by a yes response to the question, “Does your practice use telemedicine technology (for example, audio, audio with video, or web videoconference) for patient visits?” Physicians reported their ability to provide a similar quality of care during telemedicine visits by a response to the question, “To what extent are you able to provide similar quality of care during telemedicine visits as you do during in-person visits?” Response options were “Not at all,” “To a small extent,” “To some extent,” “To a great extent,” and “Fully.” The category “Not at all or to a small extent” includes physicians who responded “Not at all” or “To a small extent.” The category “To some or a great extent” includes physicians who responded “To some extent” or “To a great extent.” For those who responded, the level of missing responses ranged from 0.1% to 0.8% depending on physician specialty. Numbers may not add to 100 due to rounding. Access data table for Figure 2.
SOURCE: National Center for Health Statistics, National Electronic Health Records Survey, 2021.
Physician satisfaction with telemedicine technology for patient visits varied by specialty.
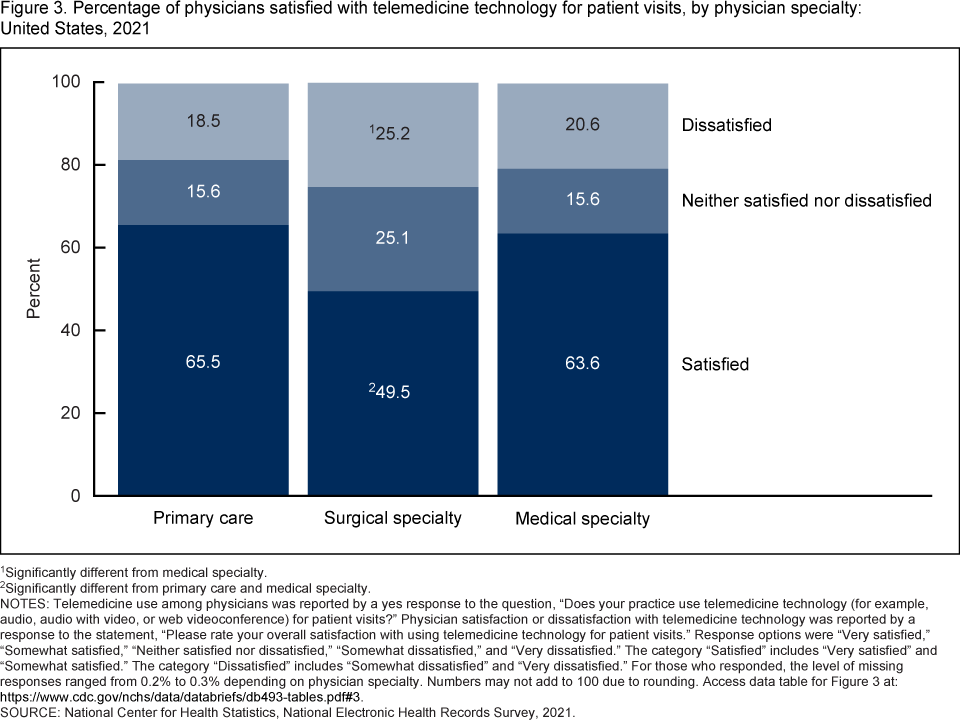
- Among primary care physicians, 65.5% were satisfied with telemedicine technology, 18.5% were dissatisfied, and 15.6% were neither satisfied nor dissatisfied (Figure 3).
- Almost one-half of surgical specialists were satisfied with telemedicine technology for patient visits (49.5%), with the remaining one-half divided between those who were neither satisfied nor dissatisfied (25.1%) or dissatisfied (25.2%).
- For medical specialists, 63.6% were satisfied with telemedicine technology, 15.6% were neither satisfied nor dissatisfied, and 20.6% were dissatisfied.
- Surgical specialists reported a lower percentage of satisfaction and a higher percentage of neutral feelings with telemedicine technology compared with primary care physicians and medical specialists.
Figure 3. Percentage of physicians satisfied with telemedicine technology for patient visits, by physician specialty: United States, 2021
1Significantly different from medical specialty.
2Significantly different from primary care and medical specialty.
NOTES: Telemedicine use among physicians was reported by a yes response to the question, “Does your practice use telemedicine technology (for example, audio, audio with video, or web videoconference) for patient visits?” Physician satisfaction or dissatisfaction with telemedicine technology was reported by a response to the statement, “Please rate your overall satisfaction with using telemedicine technology for patient visits.” Response options were “Very satisfied,” “Somewhat satisfied,” “Neither satisfied nor dissatisfied,” “Somewhat dissatisfied,” and “Very dissatisfied.” The category “Satisfied” includes “Very satisfied” and “Somewhat satisfied.” The category “Dissatisfied” includes “Somewhat dissatisfied” and “Very dissatisfied.” For those who responded, the level of missing responses ranged from 0.2% to 0.3% depending on physician specialty. Numbers may not add to 100 due to rounding. Access data table for Figure 3.
SOURCE: National Center for Health Statistics, National Electronic Health Records Survey, 2021.
The percentage of physicians reporting the appropriateness of telemedicine technology varied by physician specialty.
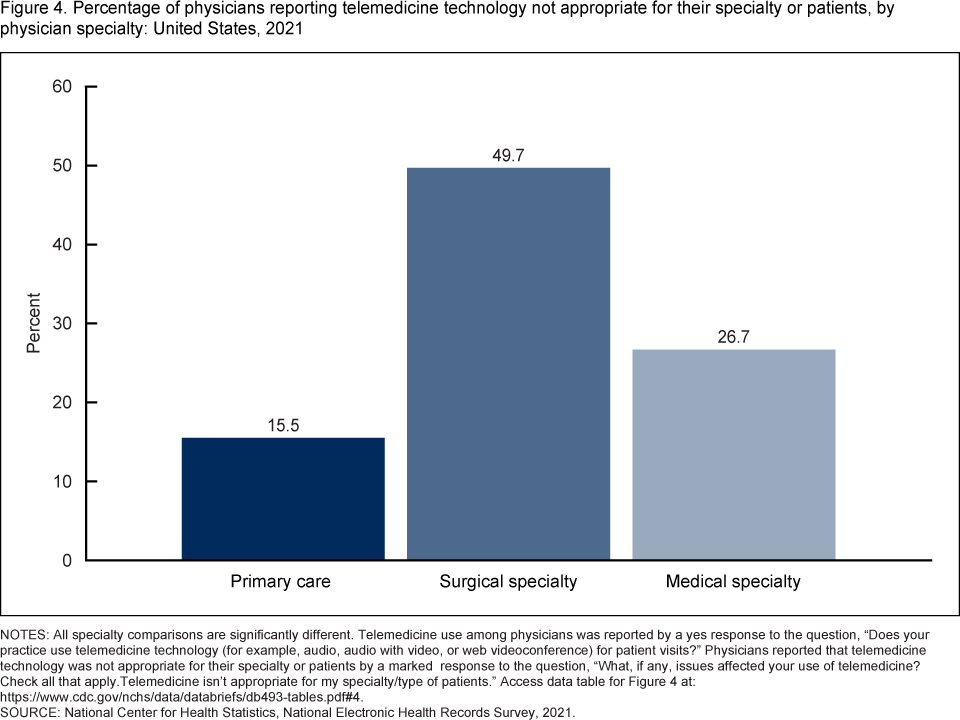
- About one-half of surgical specialists indicated that telemedicine was not appropriate for their specialty or type of patients (49.7%) (Figure 4). This was higher than both primary care physicians (15.5%) and medical specialists (26.7%).
- A higher percentage of physicians in medical specialties reported that telemedicine technology was not appropriate for their patients compared with primary care physicians.
Figure 4. Percentage of physicians reporting telemedicine technology not appropriate for their specialty or patients, by physician specialty: United States, 2021
NOTES: All specialty comparisons are significantly different. Telemedicine use among physicians was reported by a yes response to the question, “Does your practice use telemedicine technology (for example, audio, audio with video, or web videoconference) for patient visits?” Physicians reported that telemedicine technology was not appropriate for their specialty or patients by a marked response to the question, “What, if any, issues affected your use of telemedicine? Check all that apply. Telemedicine isn’t appropriate for my specialty/type of patients.” Access data table for Figure 4.
SOURCE: National Center for Health Statistics, National Electronic Health Records Survey, 2021.
Summary
The COVID-19 pandemic necessitated the use of telemedicine for office-based physicians to provide patient care. From 2019 to 2021, telemedicine use increased from 15.4% to 86.5% (1,2). This report examines various measures of telemedicine quality and issues among primary care physicians and surgical and medical specialists. Medical specialists stand out in their use of telemedicine technology, as more than one-quarter reported that 50% of their patient visits or more used telemedicine technology (27.4%). The data also show that a higher percentage of surgical specialists were unable to provide a similar quality of care through telemedicine compared with in-person visits or were able to provide a similar quality of care “to a small extent” compared with primary care physicians and medical specialists. Primary care physicians and medical specialists were more satisfied with telemedicine technology than surgical specialists. More surgical specialists than primary care physicians reported neutral feelings about their satisfaction with telemedicine technology. Almost one-half of surgical specialists reported that telemedicine technology was not appropriate for their specialty or type of patients.
Definitions
Telemedicine technology: Determined by a yes response to the survey question, “Does your practice use telemedicine technology (for example, audio, audio with video, or web videoconference) for patient visits?”
Primary care physicians: Defined as physicians in the following specialties: general and family practice, internal medicine, obstetrics and gynecology, or pediatrics.
Surgical specialists: Defined as physicians in general surgery, obstetrics and gynecology surgery, ophthalmology, orthopedic surgery, otolaryngology, urology, or other surgical specialties.
Medical specialists: Defined as physicians in cardiovascular diseases, dermatology, neurology, psychiatry, or other medical specialties.
Telemedicine use: The percentage of patient visits at which the physician used telemedicine technology. Determined by a yes response to the survey question, “Does your practice use telemedicine technology (for example, audio, audio with video, or web videoconference) for patient visits?” and a response to the question, “Since March 2020, what percentage of your patient visits were through telemedicine technology?” Response options were “None,” “Less than 25%,” “25% to 49%,” “50% to 74%,” and “75% or more.” Physicians who responded “None” or “Less than 25%” were categorized as “Less than 25%.” Physicians who responded “50% to 74%” or “75% or more” were categorized as “50% or more.”
Physician ability to provide a similar quality of care during telemedicine visits as in-person visits: Determined by a yes response to the survey question, “Does your practice use telemedicine technology (for example, audio, audio with video, or web videoconference) for patient visits?” and a response to the question, “To what extent are you able to provide similar quality of care during telemedicine visits as you do during in-person visits?” Physicians could respond “Not at all,” “To a small extent,” “To some extent,” “To a great extent,” or “Fully.” Physicians who responded “Not at all” or “To a small extent” were categorized as “Not at all or to a small extent.” Physicians who responded “To some extent” or “To a great extent” were categorized as “To some or a great extent.”
Physician satisfaction with telemedicine: Determined by a yes response to the survey question, “Does your practice use telemedicine technology (for example, audio, audio with video, or web videoconference) for patient visits?” and a response to the statement, “Please rate your overall satisfaction with using telemedicine technology for patient visits.” Response options were “Very satisfied,” “Somewhat satisfied,” “Neither satisfied nor dissatisfied,” “Somewhat dissatisfied,” and “Very dissatisfied.” Physicians who responded “Very satisfied” or “Somewhat satisfied” were categorized as “Satisfied.” Physicians who responded “Somewhat dissatisfied” or “Very dissatisfied” were categorized as “Dissatisfied.”
Telemedicine technology issues: Determined by a yes response to the survey question, “Does your practice use telemedicine technology (for example, audio, audio with video, or web videoconference) for patient visits?” and a marked response to the question, “What, if any, issues affected your use of telemedicine? Check all that apply. Telemedicine isn’t appropriate for my specialty/type of patients.”
Data source and methods
Data for this report are from the National Electronic Health Records Survey, an annual survey of nonfederal, office-based physicians practicing in the United States, excluding those in the specialties of anesthesiology, radiology, and pathology (6). The 2021 National Electronic Health Records Survey sampled 10,302 physicians, of which, 1,875 participated completely by responding to all key items on the survey (6). The 2021 survey includes additional questions about telemedicine technology that reveal how office-based physicians used telemedicine technology. Nine physicians used audio-only telemedicine technology; the remainder used audio with video, web videoconference, or both.
Data analyses were performed using the statistical packages SAS version 9.4 (SAS Institute, Cary, N.C.) and SAS-callable SUDAAN version 11.0 (RTI International, Research Triangle Park, N.C.). All percentage estimates presented meet National Center for Health Statistics guidelines for presentation of proportions unless otherwise noted (7). Terms such as “higher” or “lower” indicate that the differences were statistically significant.
About the authors
Kelly L. Myrick and Carol J. DeFrances are with the National Center for Health Statistics, Division of Health Care Statistics. Mohsin Mahar is with RELI Group, Inc.
References
- National Center for Health Statistics. 2019 NEHRS micro-data file. 2021.
- National Center for Health Statistics. 2021 NEHRS micro-date file. 2022.
- Centers for Disease Control and Prevention. QuickStats: Percentage of office-based physicians using telemedicine technology, by specialty–United States, 2019 and 2021. MMWR Morb Mortal Wkly Rep 71(49):1565. 2022. DOI: https://dx.doi.org/10.15585/mmwr.mm7149a6.
- Pylypchuk Y, Barker SW. Use of telemedicine among office-based physicians, 2021. ONC Data Brief, no. 65. Office of the National Coordinator for Health Information Technology. 2023.
- Kruse C, Heinemann K. Facilitators and barriers to the adoption of telemedicine during the first year of COVID-19: Systematic review. J Med Internet Res 24(1):e31752. 2022.
- National Center for Health Statistics. 2021 National Electronic Health Records Survey (NEHRS) public use data file documentation. 2022.
- Parker JD, Talih M, Malec DJ, Beresovsky V, Carroll M, Gonzalez JF Jr, et al. National Center for Health Statistics data presentation standards for proportions. National Center for Health Statistics. Vital Health Stat 2(175). 2017.
Suggested citation
Myrick KL, Mahar M, DeFrances CJ. Telemedicine use among physicians by physician specialty: United States, 2021. NCHS Data Brief, no 493. Hyattsville, MD: National Center for Health Statistics. 2024. DOI: https://dx.doi.org/10.15620/cdc:141934.
Copyright information
All material appearing in this report is in the public domain and may be reproduced or copied without permission; citation as to source, however, is appreciated.
National Center for Health Statistics
Brian C. Moyer, Ph.D., Director
Amy M. Branum, Ph.D., Associate Director for Science
Division of Health Care Statistics
Carol J. DeFrances, Ph.D., Director
Alexander Strashny, Ph.D., Associate Director for Science