Lack of Reliable Transportation for Daily Living Among Adults: United States, 2022
- Key findings
- The percentage of adults who lacked reliable transportation for daily living in the past 12 months was higher among women compared with men and decreased with age.
- American Indian and Alaska Native non-Hispanic adults were more likely to lack reliable transportation for daily living compared with Asian non-Hispanic, White non-Hispanic, Hispanic, and Other or multiple-race non-Hispanic adults.
- The percentage of adults who lacked reliable transportation for daily living decreased as family income and highest level of education increased.
- The West North Central region of the United States had a higher percentage of adults who lacked reliable transportation for daily living compared with the national average.
- Summary
Data from the National Health Interview Survey
- In 2022, 5.7% of adults lacked reliable transportation for daily living in the past 12 months. Women (6.1%) were more likely than men (5.3%) to lack reliable transportation.
- The percentage of adults who lacked reliable transportation was lowest among Asian non-Hispanic adults (3.6%) compared with other race and Hispanic-origin groups.
- Lack of reliable transportation decreased with increasing education level and family income.
- Adults living in the West North Central region of the United States (7.5%) were more likely to lack reliable transportation than the national average (5.7%), while adults in New England (4.1%) were less likely.
Access to transportation may be required for many daily tasks, including going to work, health care visits, and obtaining groceries. Previous research suggests that a lack of transportation, especially among adults who are older, uninsured, and have lower incomes, leads to reduced access to health care, which may then lead to adverse health outcomes (1,2). Using data from the 2022 National Health Interview Survey, this report describes the percentage of adults who lacked reliable transportation for daily living in the past 12 months by selected sociodemographic and geographic characteristics.
Keywords: transportation, health care barriers, health care access, social determinants of health, National Health Interview Survey (NHIS)
The percentage of adults who lacked reliable transportation for daily living in the past 12 months was higher among women compared with men and decreased with age.
In 2022, about 5.7% of adults lacked reliable transportation for daily living in the past 12 months (Figure 1). The percentage of adults who lacked reliable transportation was lower among men (5.3%) compared with women (6.1%). As age increased, the percentage of adults who lacked reliable transportation decreased, from 7.0% among adults ages 18–34 to 4.5% among adults ages 65 and older.
Figure 1. Percentage of adults who lacked reliable transportation for daily living in the past 12 months, by sex and age group: United States, 2022
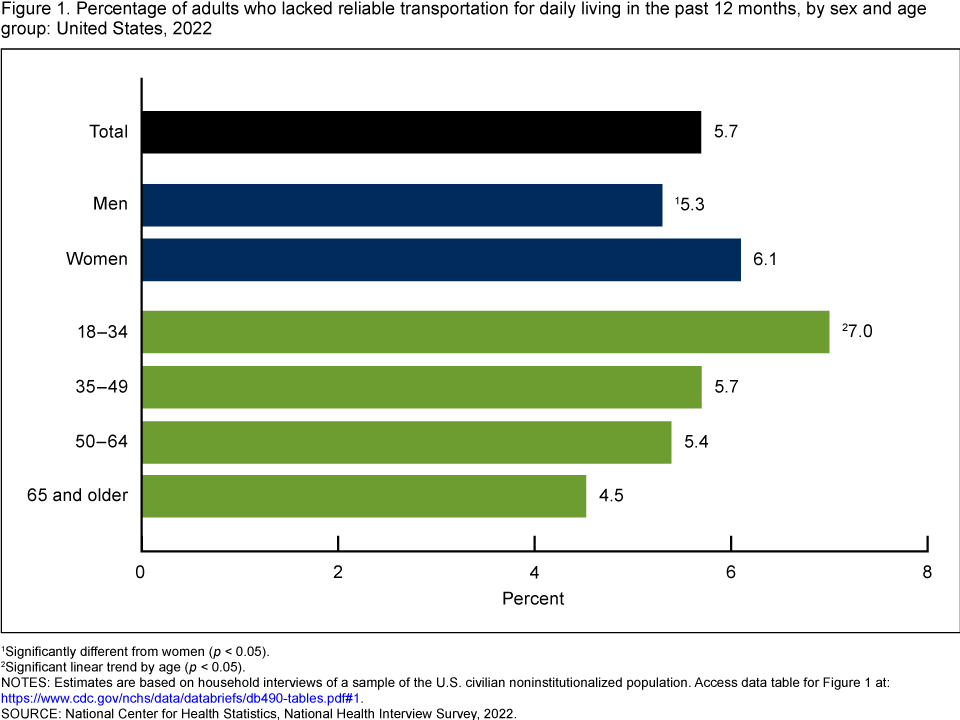
1Significantly different from women (p < 0.05).
2Significant linear trend by age (p < 0.05).
NOTES: Estimates are based on household interviews of a sample of the U.S. civilian noninstitutionalized population. Access data table for Figure 1.
SOURCE: National Center for Health Statistics, National Health Interview Survey, 2022.
American Indian and Alaska Native non-Hispanic adults were more likely to lack reliable transportation for daily living compared with Asian non-Hispanic, White non-Hispanic, Hispanic, and Other or multiple-race non-Hispanic adults.
In 2022, American Indian and Alaska Native non-Hispanic (subsequently, American Indian and Alaska Native) adults were more likely to lack reliable transportation for daily living in the past 12 months (17.1%) compared with Asian non-Hispanic (subsequently, Asian) (3.6%), White non-Hispanic (subsequently, White) (4.8%), Hispanic (6.9%), and Other or multiple-race non-Hispanic (7.6%) adults (Figure 2). Asian adults were least likely to lack reliable transportation. Black non-Hispanic (subsequently, Black) (9.2%) adults were more likely than White and Hispanic adults to lack reliable transportation, and White adults were less likely to lack reliable transportation than Hispanic adults. While American Indian and Alaska Native adults were more likely to lack reliable transportation than Black adults, this difference was not significant.
Figure 2. Percentage of adults who lacked reliable transportation for daily living in the past 12 months, by race and Hispanic origin: United States, 2022

1Significantly different from Asian non-Hispanic adults (p < 0.05).
2Significantly different from Hispanic adults (p < 0.05).
3Significantly different from White non-Hispanic adults (p < 0.05).
4Significantly different from Other or multiple-race non-Hispanic adults (p < 0.05).
5Significantly different from Black non-Hispanic adults (p < 0.05).
NOTE: Adults of Hispanic origin may be of any race. Adults categorized as American Indian and Alaska Native non-Hispanic, Asian non-Hispanic, Black non-Hispanic, and White non-Hispanic indicated one race only. Analyses were limited to the race and Hispanic origin groups for which data were reliable and sufficiently powered for group comparisons based on National Center for Health Statistics presentation standards. Estimates are based on household interviews of a sample of the U.S. civilian noninstitutionalized population. Access data table for Figure 2.
SOURCE: National Center for Health Statistics, National Health Interview Survey, 2022.
The percentage of adults who lacked reliable transportation for daily living decreased as family income and highest level of education increased.
The percentage of adults who lacked reliable transportation for daily living in the past 12 months decreased with decreasing federal poverty level, ranging from 15.8% among adults with family incomes less than 100% of the federal poverty level to 2.9% among adults with family incomes of 400% of the federal povery level or greater (Figure 3). The percentage of adults who lacked reliable transportation decreased with increasing educational level, from 9.7% among adults with less than a high school diploma or GED to 3.8% among adults with a college degree or higher.
Figure 3. Percentage of adults who lacked reliable transportation for daily living in the past 12 months, by family income and education, United States, 2022

1Significant quadratic trend by family income (p < 0.05).
2Significant linear trend by education (p < 0.05).
NOTES: FPL is federal poverty level. Estimates are based on household interviews of a sample of the U.S. civilian noninstitutionalized population. Access data table for Figure 3.
SOURCE: National Center for Health Statistics, National Health Interview Survey, 2022.
The West North Central region of the United States had a higher percentage of adults who lacked reliable transportation for daily living compared with the national average.
The percentage of adults who lacked reliable transportation for daily living in the past 12 months was higher in the West North Central region (7.5%) and lower in the New England region (4.1%) compared with the national average (5.7%) (Figure 4). The observed differences between the other regions and the national average were not significant.
Figure 4. Percentage of adults who lacked reliable transportation for daily living in the past 12 months, by geographic region: United States, 2022
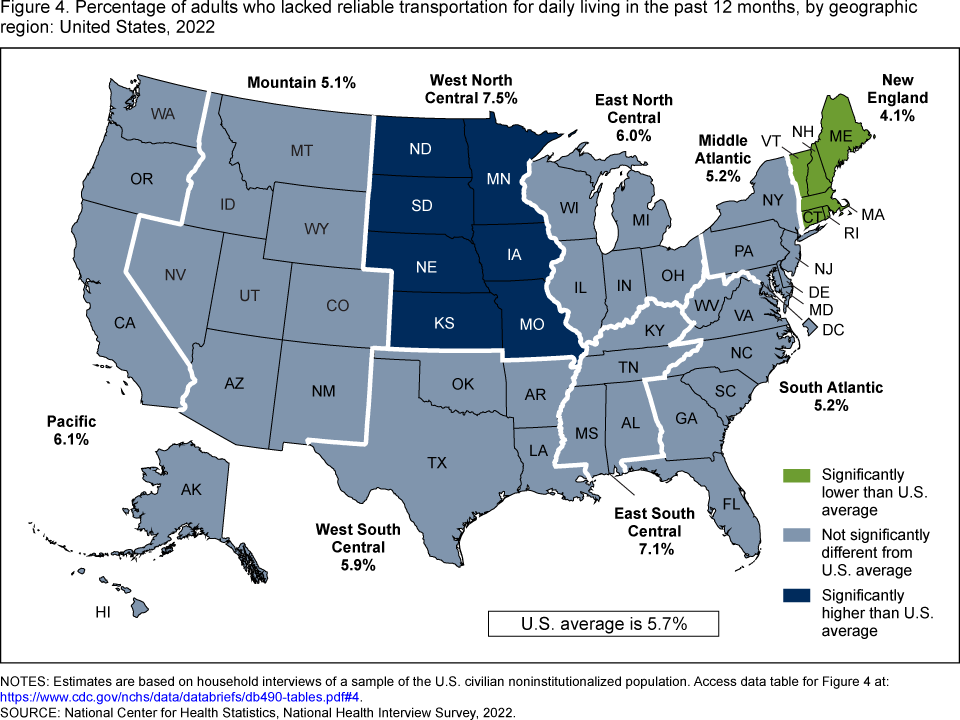
NOTES: Estimates are based on household interviews of a sample of the U.S. civilian noninstitutionalized population. Access data table for Figure 4.
SOURCE: National Center for Health Statistics, National Health Interview Survey, 2022.
Summary
This report presents the percentage of adults who lacked reliable transportation for daily living in the past 12 months in the United States, using data from the 2022 National Health Interview Survey. Overall, 5.7% of adults lacked reliable transportation, and differences by sex, age, race and Hispanic origin, family income, education level, and geographic region were observed. Women and American Indian and Alaska Native adults were more likely to lack reliable transportation than their counterparts. Adults living in the West North Central region of the United States were more likely to lack reliable transportation compared with the national average, and adults living in the New England region of the United States were less likely to lack reliable transportation compared with the national average. Lack of reliable transportation also decreased with increasing age, education, and family income.
Previous analyses using the 1997–2017 National Health Interview Survey showed delaying medical care because of a lack of reliable transportation was more likely among adults living below the poverty threshold compared with those living above it (3). The inclusion of the transportation barrier question, starting with the 2022 NHIS, allows for further monitoring of this indicator as it relates to health outcomes and healthcare use.
Definitions
Family income as a percentage of federal poverty level: Based on the federal poverty level, which was calculated from the family’s income in the previous calendar year and family size using the U.S. Census Bureau’s poverty thresholds (4). Family income was imputed when missing (5).
Lack of reliable transportation for daily living: Based on an affirmative response to the question, “In the past 12 months, has a lack of reliable transportation kept you from medical appointments, meetings, work, or from getting things you needed for daily living?”
Race and Hispanic origin: Adults categorized as Hispanic may be of any race or combination of races. Adults categorized as non-Hispanic indicated one race only. Other or multiple races include those who did not identify as American Indian and Alaska Native, Asian, Black, Hispanic, or White, and those who identified as more than one race. Analyses were limited to the race and Hispanic origin groups for which data were reliable and sufficiently powered to make group comparisons.
Regions: Categories were slightly modified from the nine U.S. Census Bureau-designated divisions by moving Delaware, the District of Columbia, and Maryland into the Middle Atlantic region (6). Divisions include:
- New England: Connecticut, Maine, Massachusetts, New Hampshire, Rhode Island, Vermont
- Middle Atlantic: Delaware, District of Columbia, Maryland, New Jersey, New York, Pennsylvania
- East North Central: Illinois, Indiana, Michigan, Ohio, Wisconsin
- West North Central: Iowa, Kansas, Minnesota, Missouri, Nebraska, North Dakota, South Dakota
- South Atlantic: Florida, Georgia, North Carolina, South Carolina, Virginia, West Virginia
- East South Central: Alabama, Kentucky, Mississippi, Tennessee
- West South Central: Arkansas, Louisiana, Oklahoma, Texas
- Mountain: Arizona, Colorado, Idaho, Montana, Nevada, New Mexico, Utah, Wyoming
- Pacific: Alaska, California, Hawaii, Oregon, Washington
Data source and methods
Data from the 2022 National Health Interview Survey were used for this report. The National Health Interview Survey is a nationally representative household survey of the U.S. civilian noninstitutionalized population. It is conducted continuously throughout the year by the National Center for Health Statistics. Interviews are typically conducted in respondents’ homes, but follow-ups to complete interviews may be conducted over the telephone. Because of the COVID-19 pandemic, interviewing procedures were disrupted, and 55.7% of the 2022 Sample Adult interviews were conducted at least partially by telephone (7). For more information about the survey, visit https://www.cdc.gov/nchs/nhis.htm.
Point estimates and corresponding confidence intervals were calculated using SAS-callable SUDAAN software (8) to account for the complex sample design of the survey. Differences between percentages were evaluated using two-sided significance tests at the 0.05 level. Linear and quadratic trends by age group, family income, and education were evaluated using orthogonal polynomials. All estimates in this report meet National Center for Health Statistics data presentation standards for proportions (9).
About the authors
Amanda E. Ng, Dzifa Adjaye-Gbewonyo, and James Dahlhamer are with the National Center for Health Statistics, Division of Health Interview Statistics.
References
- Zimmerman MS. Information poverty and reproductive healthcare: Assessing the reasons for inequity between income groups. Soc Work Public Health 32(3):210–21. 2017.
- Heaps W, Abramsohn E, Skillen E. Public transportation in the US: A driver of health and equity. Health Affairs Health Policy Brief. 2021.
- Wolfe MK, McDonald NC, Holmes GM. Transportation barriers to health care in the United States: Findings from the National Health Interview Survey, 1997–2017. Am J of Public Health 110(6):815–22. 2020.
- U.S. Census Bureau. Poverty thresholds. 2023.
- National Center for Health Statistics. Multiple imputation of family income in 2022 National Health Interview Survey: Methods. 2023.
- Holahan J, Buettgens M, Carroll C, Dorn S. The cost and coverage implications of the ACA Medicaid expansion: National and state-by-state analysis. The Kaiser Commission on Medicaid and the Uninsured. 2012.
- National Center for Health Statistics. National Health Interview Survey: 2022 survey description. 2023.
- RTI International. SUDAAN (Release 11.0.3) [computer software]. 2018.
- Parker JD, Talih M, Malec DJ, Beresovsky V, Carroll M, Gonzalez JF Jr., et al. National Center for Health Statistics data presentation standards for proportions. National Center for Health Statistics. Vital Health Stat 2(175). 2017.
Suggested citation
Ng AE, Adjaye-Gbewonyo D, Dahlhamer J. Lack of reliable transportation for daily living among adults: United States, 2022. NCHS Data Brief, no 490. Hyattsville, MD: National Center for Health Statistics. 2024. DOI: https://dx.doi.org/10.15620/cdc:135611
Copyright information
All material appearing in this report is in the public domain and may be reproduced or copied without permission; citation as to source, however, is appreciated.
National Center for Health Statistics
Brian C. Moyer, Ph.D., Director
Amy M. Branum, Ph.D., Associate Director for Science
Division of Health Interview Statistics
Stephen J. Blumberg, Ph.D., Director
Anjel Vahratian, Ph.D., M.P.H., Associate Director for Science