Myalgic Encephalomyelitis/Chronic Fatigue Syndrome in Adults: United States, 2021–2022
- Key findings
- Women were more likely than men to have ME/CFS.
- The percentage of adults with ME/CFS varied by age.
- The percentage of adults with ME/CFS varied by race and Hispanic origin.
- The percentage of adults with ME/CFS decreased with increasing family income.
- The percentage of adults with ME/CFS increased as place of residence became more rural.
Data from the National Health Interview Survey
- In 2021–2022, 1.3% of adults had myalgic encephalomyelitis/chronic fatigue syndrome (ME/CFS).
- The percentage of adults who had ME/CFS increased with age through ages 60–69 and then declined among those age 70 and older.
- White non-Hispanic (1.5%) adults were more likely to have ME/CFS compared with Asian non-Hispanic (0.7%) and Hispanic (0.8%) adults.
- Adults with a family income less than 100% of the federal poverty level (2.0%) were more likely to have ME/CFS, followed by those at 100–199% (1.7%), and those at or above 200% (1.1%).
- The percentage of adults who had ME/CFS increased with increasing rurality of their place of residence.
Myalgic encephalomyelitis/chronic fatigue syndrome (ME/CFS) is a complex, multisystem illness characterized by activity-limiting fatigue, worsening of symptoms after activity, and other symptoms (1). It affects all age, sex, and racial and ethnic groups and costs the U.S. economy about $18–$51 billion annually (2–5). This report describes the percentage of adults who had ME/CFS at the time of interview by selected demographic and geographic characteristics based on data from the 2021–2022 National Health Interview Survey (NHIS).
Keywords: post-exertional malaise, infection-associated illness, demography, National Health Interview Survey
Women were more likely than men to have ME/CFS.
During 2021–2022, 1.3% of adults had ME/CFS (Figure 1). Women (1.7%) were more likely than men (0.9%) to have ME/CFS.
Figure 1. Percentage of adults who had Myalgic Encephalomyelitis/Chronic Fatigue Syndrome, by sex: United States, 2021–2022
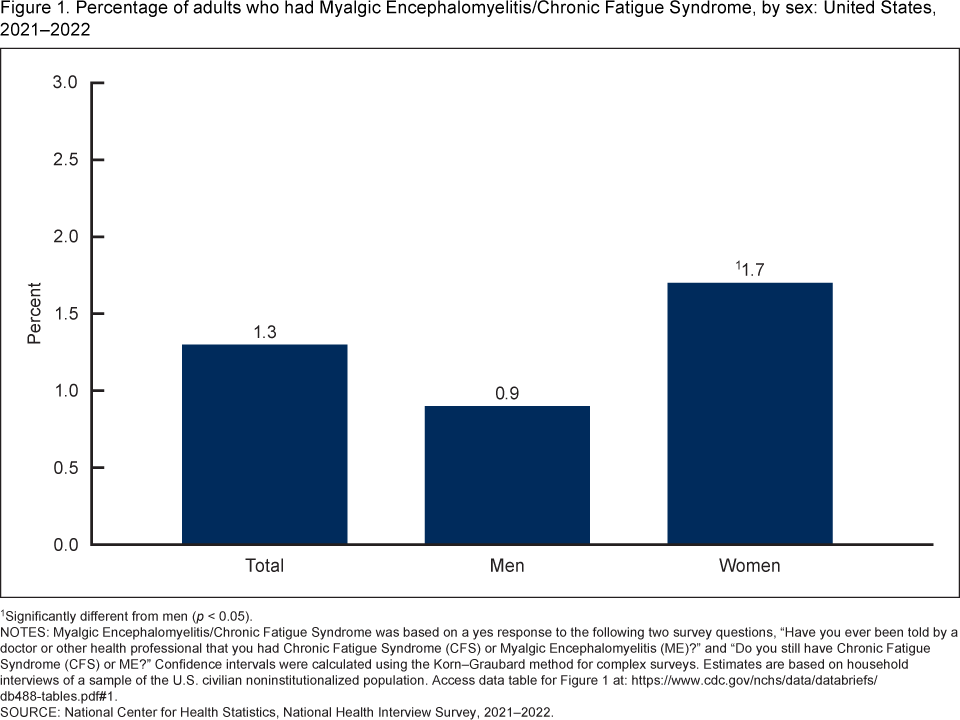
1Significantly different from men (p < 0.05).
NOTES: Myalgic Encephalomyelitis/Chronic Fatigue Syndrome was based on a yes response to the following two survey questions, “Have you ever been told by a doctor or other health professional that you had Chronic Fatigue Syndrome (CFS) or Myalgic Encephalomyelitis (ME)?” and “Do you still have Chronic Fatigue Syndrome (CFS) or ME?” Confidence intervals were calculated using the Korn–Graubard method for complex surveys. Estimates are based on household interviews of a sample of the U.S. civilian noninstitutionalized population. Access data table for Figure 1.
SOURCE: National Center for Health Statistics, National Health Interview Survey, 2021–2022.
The percentage of adults with ME/CFS varied by age.
The percentage of adults who had ME/CFS increased with age, from 0.7% among those ages 18–39 to 2.0% and 2.1% among those ages 50–59 and 60–69, respectively, and then declined to 1.4% among those age 70 and older (Figure 2).
Figure 2. Percentage of adults who had Myalgic Encephalomyelitis/Chronic Fatigue Syndrome, by age: United States, 2021–2022
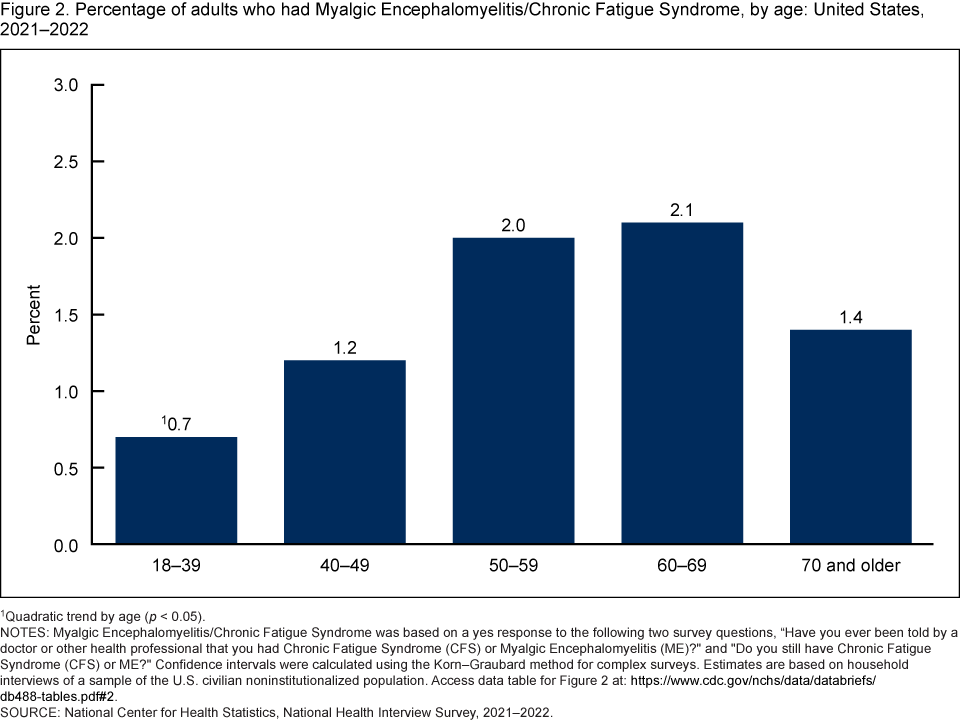
1Quadratic trend by age (p < 0.05).
NOTES: Myalgic Encephalomyelitis/Chronic Fatigue Syndrome was based on a yes response to the following two survey questions, “Have you ever been told by a doctor or other health professional that you had Chronic Fatigue Syndrome (CFS) or Myalgic Encephalomyelitis (ME)?” and “Do you still have Chronic Fatigue Syndrome (CFS) or ME?” Confidence intervals were calculated using the Korn–Graubard method for complex surveys. Estimates are based on household interviews of a sample of the U.S. civilian noninstitutionalized population. Access data table for Figure 2.
SOURCE: National Center for Health Statistics, National Health Interview Survey, 2021–2022.
The percentage of adults with ME/CFS varied by race and Hispanic origin.
White non-Hispanic adults (subsequently, White) (1.5%) were more likely than Hispanic adults (0.8%) and Asian non-Hispanic adults (subsequently, Asian) (0.7%) to have ME/CFS (Figure 3). Black non-Hispanic adults (subsequently, Black) (1.2%) were more likely than Asian adults to have ME/CFS, but the difference between Black and Hispanic adults was not significant.
Figure 3. Percentage of adults who had Myalgic Encephalomyelitis/Chronic Fatigue Syndrome, by race and Hispanic origin: United States, 2021–2022
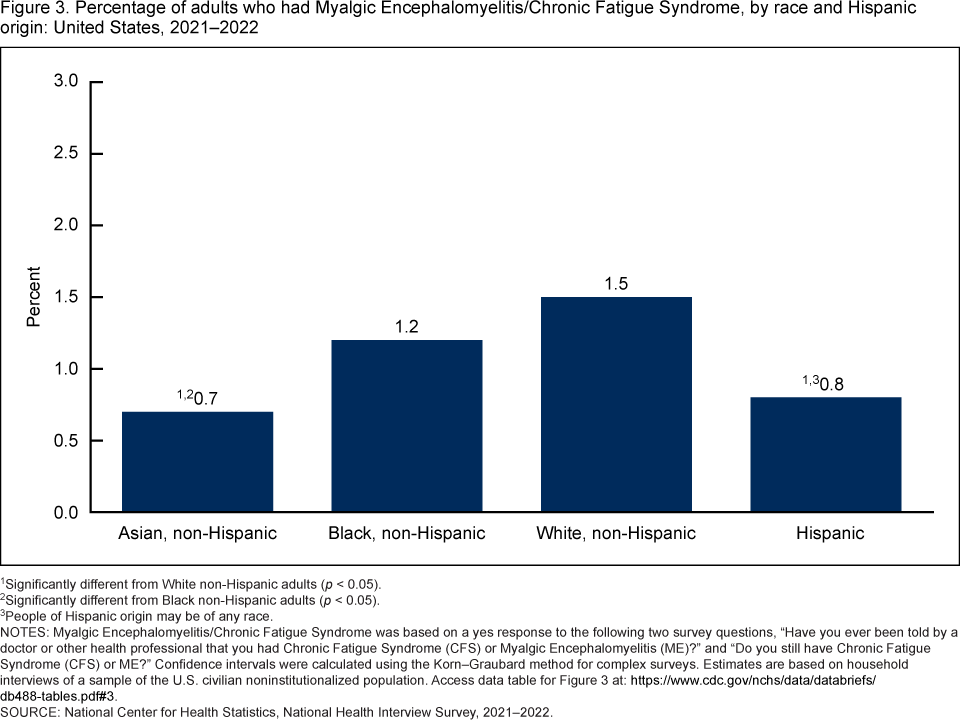
1Significantly different from White non-Hispanic adults (p < 0.05).
2Significantly different from Black non-Hispanic adults (p < 0.05).
3People of Hispanic origin may be of any race (p < 0.05).
NOTES: Myalgic Encephalomyelitis/Chronic Fatigue Syndrome was based on a yes response to the following two survey questions, “Have you ever been told by a doctor or other health professional that you had Chronic Fatigue Syndrome (CFS) or Myalgic Encephalomyelitis (ME)?” and “Do you still have Chronic Fatigue Syndrome (CFS) or ME?” Confidence intervals were calculated using the Korn–Graubard method for complex surveys. Estimates are based on household interviews of a sample of the U.S. civilian noninstitutionalized population. Access data table for Figure 3.
SOURCE: National Center for Health Statistics, National Health Interview Survey, 2021–2022.
The percentage of adults with ME/CFS decreased with increasing family income.
Adults with a family income less than 100% of the federal poverty level (2.0%) had the highest percentage of ME/CFS, followed by those at 100–199% (1.7%) and those at or above 200% (1.1%) (Figure 4).
Figure 4. Percentage of adults who had Myalgic Encephalomyelitis/Chronic Fatigue Syndrome, by family income: United States, 2021–2022

1Linear trend by family income as a percentage of the federal poverty level (p < 0.05).
NOTES: Myalgic Encephalomyelitis/Chronic Fatigue Syndrome was based on a yes response to the following two survey questions, “Have you ever been told by a doctor or other health professional that you had Chronic Fatigue Syndrome (CFS) or Myalgic Encephalomyelitis (ME)?” and “Do you still have Chronic Fatigue Syndrome (CFS) or ME?” Confidence intervals were calculated using the Korn–Graubard method for complex surveys. FPL is federal poverty level. Estimates are based on household interviews of a sample of the U.S. civilian noninstitutionalized population. Access data table for Figure 4.
SOURCE: National Center for Health Statistics, National Health Interview Survey, 2021–2022.
The percentage of adults with ME/CFS increased as place of residence became more rural.
The percentage of ME/CFS increased with increasing rurality, from 1.0% and 1.1% in large central and large fringe metro areas, respectively, to 1.5% in medium and small metropolitan areas and 1.9% in nonmetropolitan areas (Figure 5).
Figure 5. Percentage of adults who had Myalgic Encephalomyelitis/Chronic Fatigue Syndrome, by urbanization level: United States, 2021–2022
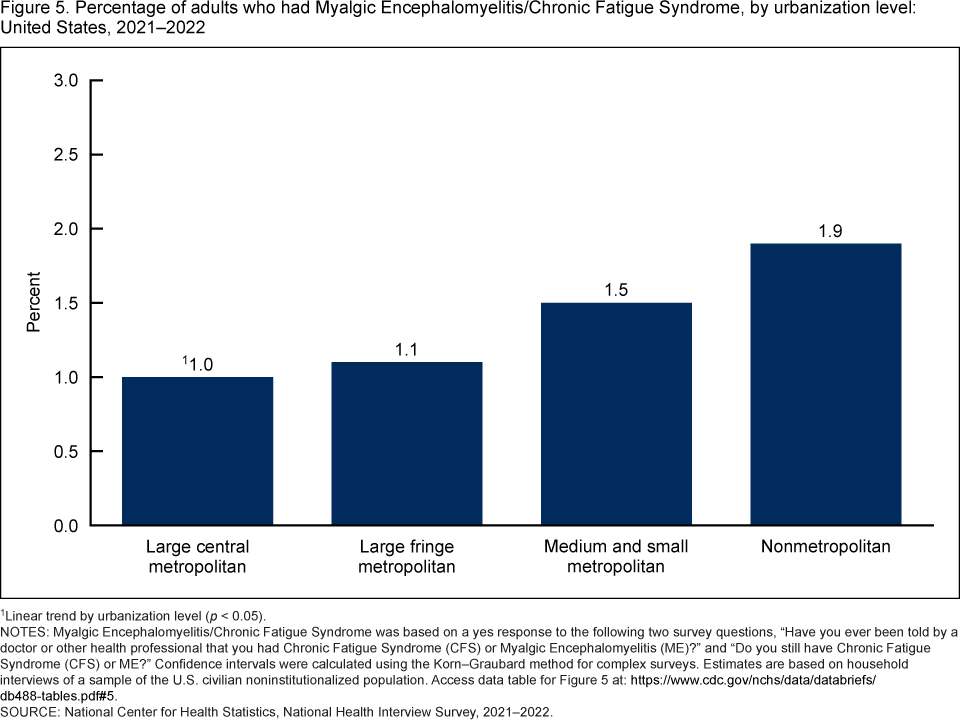
1Linear trend by urbanization level (p < 0.05).
NOTES: Myalgic Encephalomyelitis/Chronic Fatigue Syndrome was based on a yes response to the following two survey questions, “Have you ever been told by a doctor or other health professional that you had Chronic Fatigue Syndrome (CFS) or Myalgic Encephalomyelitis (ME)?” and “Do you still have Chronic Fatigue Syndrome (CFS) or ME?” Confidence intervals were calculated using the Korn–Graubard method for complex surveys. Estimates are based on household interviews of a sample of the U.S. civilian noninstitutionalized population. Access data table for Figure 5.
SOURCE: National Center for Health Statistics, National Health Interview Survey, 2021–2022.
Summary
During 2021–2022, 1.3% of adults had ME/CFS, and women were more likely than men to have the condition. The percentage of adults with ME/CFS increased with age through ages 60–69 and then declined in those age 70 and older. White adults were more likely than Hispanic and Asian adults to have ME/CFS, and Black adults were significantly more likely to have ME/CFS than Asian adults. Estimates of ME/CFS decreased with increasing family income and increased as place of residence became more rural.
As the prevalence estimates in this report are based on a doctor’s diagnosis, adults who are undiagnosed are not included in this analysis. True prevalence estimates may be higher, as previous studies suggest that many people with ME/CFS are undiagnosed (1).
Definitions
Family income as a percentage of the federal poverty level: Based on the federal poverty level, which was derived from the family’s income in the previous calendar year and family size using the U.S. Census Bureau’s poverty thresholds (6). Family income was imputed when missing (7).
Myalgic Encephalomyelitis/Chronic Fatigue Syndrome: ME/CFS status was based on a yes response to both of the following survey questions: “Have you ever been told by a doctor or other health professional that you had Chronic Fatigue Syndrome (CFS) or Myalgic Encephalomyelitis (ME)?” and “Do you still have Chronic Fatigue Syndrome (CFS) or ME?”
Race and Hispanic origin: Adults categorized as Hispanic may be of any race or combination of races. Non-Hispanic adults categorized as Asian, Black, or White indicated one race only. Estimates for non-Hispanic adults of races other than Asian, Black, and White, due to the inability to make statistically reliable estimates, are not shown but are included in the total estimates.
Urbanization level: Counties were classified according to their metropolitan status using the National Center for Health Statistics Urban-Rural Classification Scheme (8). Urban counties include large central counties (inner cities), the fringes of large counties (suburbs), and medium and small counties. Rural counties (nonmetro) include micropolitan statistical areas and noncore areas, including open countryside, rural towns (populations of less than 2,500), and areas with populations of 2,500–49,999 that are not part of larger labor market areas (urban areas).
Data sources and methods
NHIS data from 57,133 adults (29,482 in 2021 and 27,651 in 2022) were used for this analysis. NHIS is a nationally representative household survey of the civilian noninstitutionalized U.S. population. It is conducted continuously throughout the year by the National Center for Health Statistics. Interviews are typically conducted in respondents’ homes, but follow-ups to complete interviews may be conducted over the telephone. Due to data collection disruptions caused by the COVID-19 pandemic in 2021 and 2022, 62.8% and 55.7% of the adult interviews were conducted at least partially by telephone, respectively (9,10). For more information about NHIS, visit https://www.cdc.gov/nchs/nhis.htm.
Point estimates and the corresponding confidence intervals for this analysis were calculated using SAS-callable SUDAAN software (11) to account for the complex sample design of NHIS. All estimates are based on self-report and meet National Center for Health Statistics data presentation standards for proportions (12). Linear and quadratic trends and differences between percentages were evaluated using two-sided significance tests at the 0.05 level.
About the authors
Anjel Vahratian is with the National Center for Health Statistics, Division of Health Interview Statistics. Jin-Mann S. Lin, Jeanne Bertolli, and Elizabeth R. Unger are with the National Center for Emerging and Zoonotic Infectious Diseases, Division of High Consequence Pathogens and Pathology.
References
- Institute of Medicine. Beyond myalgic encephalomyelitis/chronic fatigue syndrome: Redefining an illness. Washington, DC: The National Academies Press. 2015.
- Jason LA, Richman JA, Rademaker AW, Jordan KM, Plioplys AV, Taylor RR, et al. A community-based study of chronic fatigue syndrome. Archives of Internal Medicine 159(18):2129–37. 1999.
- Reyes M, Nisenbaum R, Hoaglin DC, Unger ER, Emmons C, Randall B, et al. Prevalence and incidence of chronic fatigue syndrome in Wichita, Kansas. Arch Intern Med 163:1530–6. 2003.
- Lin JS, Resch SC, Brimmer DJ, Johnson A, Kennedy S, Burstein N, Simon CJ. The economic impact of chronic fatigue syndrome in Georgia: Direct and indirect costs. Cost Eff Resour Alloc 9(1). 2011.
- Bae J, Lin JS. Healthcare utilization in myalgic encephalomyelitis/chronic fatigue syndrome (ME/CFS): Analysis of US ambulatory healthcare data, 2000–2009. Front Pediatr 7:185. 2019. Available from: https://doi.org/10.3389%2Ffped.2019.00185.
- U.S. Census Bureau. Poverty thresholds. 2021.
- National Center for Health Statistics. Multiple imputation of family income in 2022 National Health Interview Survey: Methods. 2023.
- Ingram DD, Franco SJ. 2013 NCHS urban-rural classification scheme for counties. National Center for Health Statistics. Vital Health Stat 2(166). 2014.
- National Center for Health Statistics. National Health Interview Survey, 2021 survey description. 2022.
- National Center for Health Statistics. National Health Interview Survey, 2022 survey description. 2023.
- RTI International. SUDAAN (Release 11.0.3) [computer software]. 2018.
- Parker JD, Talih M, Malec DJ, Beresovsky V, Carroll M, Gonzalez JF Jr, et al. National Center for Health Statistics data presentation standards for proportions. National Center for Health Statistics. Vital Health Stat 2(175). 2017.
Suggested citation
Vahratian A, Lin JS, Bertolli J, Unger ER. Myalgic encephalomyelitis/chronic fatigue syndrome in adults: United States, 2021–2022. NCHS Data Brief, no 488. Hyattsville, MD: National Center for Health Statistics. 2023. DOI: https://dx.doi.org/10.15620/cdc:134504.
Copyright information
All material appearing in this report is in the public domain and may be reproduced or copied without permission; citation as to source, however, is appreciated.
National Center for Health Statistics
Brian C. Moyer, Ph.D., Director
Amy M. Branum, Ph.D., Associate Director for Science
Division of Health Interview Statistics
Stephen J. Blumberg, Ph.D., Director
Anjel Vahratian, Ph.D., M.D.P., Associate Director for Science