Emergency Department Visit Rates by Adults With Diabetes: United States, 2020–2021
- Key findings
- What was the ED visit rate by adults with diabetes in 2020–2021 and did it differ by sex and age?
- Did the ED visit rate by adults with diabetes differ by race and ethnicity and age?
- Did the ED visit rate by adults with diabetes differ by number of other chronic conditions and age?
- Did ED visit rates by adults with diabetes change over the past decade?
- Summary
Data from the National Hospital Ambulatory Medical Care Survey
-
In 2020–2021, the emergency department visit rate by adults with diabetes was 72.2 visits per 1,000 adults, and the rate increased with age.
-
Emergency department visit rates by adults with diabetes were highest among Black non-Hispanic people (136.6 visits per 1,000 adults per year) and higher among White non-Hispanic people (69.9) compared with Hispanic people (52.3).
-
In 2020–2021, the emergency department visit rate by adults with diabetes and two to four other chronic conditions was 541.4 per 1,000 adults per year and increased with age.
-
Emergency department visit rates by adults with diabetes increased from 48.6 visits per 1,000 adults in 2012 to 74.9 visits per 1,000 adults in 2021.
In 2021, diabetes was the eighth leading cause of death in the United States (1). Over 37 million Americans have diabetes (2). While it most often develops in people older than age 45 (3), its frequency is increasing in young adults (4). Among people with diabetes, increasing age is a risk factor for hospitalization (5). Emergency department (ED) visits by people with diabetes have been used to monitor access to care and healthcare use (6). This report describes ED visits made by adults with diabetes, and presents selected characteristics by age.
Keywords: emergency care, National Hospital Ambulatory Medical Care Survey
What was the ED visit rate by adults with diabetes in 2020–2021 and did it differ by sex and age?
- In 2020–2021, the annual ED visit rate by adults with diabetes was 72.2 visits per 1,000 adults (Figure 1).
- ED visit rates by adults with diabetes did not differ significantly by sex, with 75.1 visits per 1,000 women and 69.1 visits per 1,000 men.
- Among adults ages 18–44 with diabetes, ED visit rates were higher among women (32.2) than men (19.5). Among adults ages 45–64 with diabetes, ED rates were similar for women (86.2) and men (84.4). Among adults age 65 and older with diabetes, the observed difference in ED rates between men (159.9) and women (142.8) was not significant.
- ED visit rates by adults with diabetes increased with age for both women and men.
Figure 1. Emergency department visit rate among adults with diabetes, by sex and age group: United States, 2020–2021
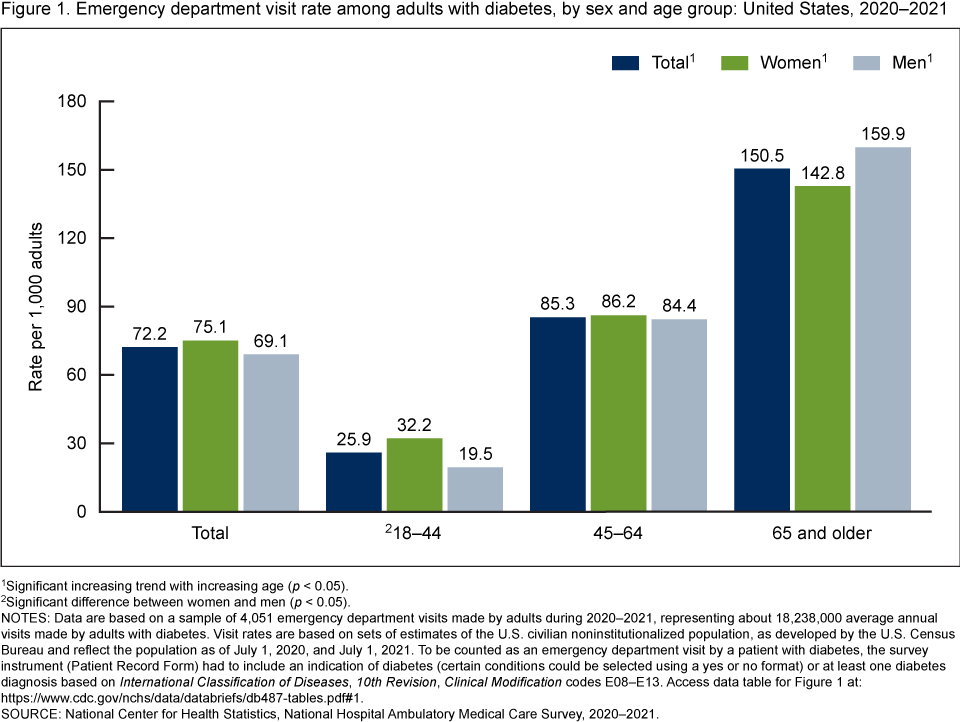
1Significant increasing trend with increasing age (p < 0.05).
2Significant difference between women and men (p < 0.05).
NOTES: Data are based on a sample of 4,051 emergency department visits made by adults during 2020–2021, representing about 18,238,000 average annual visits made by adults with diabetes. Visit rates are based on sets of estimates of the U.S. civilian noninstitutionalized population, as developed by the U.S. Census Bureau and reflect the population as of July 1, 2020, and July 1, 2021. To be counted as an emergency department visit by a patient with diabetes, the survey instrument (Patient Record Form) had to include an indication of diabetes (certain conditions could be selected using a yes or no format) or at least one diabetes diagnosis based on International Classification of Diseases, 10th Revision, Clinical Modification codes E08–E13. Access data table for Figure 1.
SOURCE: National Center for Health Statistics, National Hospital Ambulatory Medical Care Survey, 2020–2021.
Did the ED visit rate by adults with diabetes differ by race and ethnicity and age?
- In 2020–2021, ED visit rates by adults with diabetes were highest among Black non-Hispanic people (subsequently, Black) (136.6 visits per 1,000 adults), followed by White non-Hispanic (subsequently, White) (69.9) and Hispanic (52.3) people (Figure 2).
- For each age group, ED rates by adults with diabetes were highest among Black people. Differences between Hispanic and White people were not significant.
- ED visit rates by adults with diabetes increased with age among Black, White, and Hispanic people.
Figure 2. Emergency department visit rate among adults with diabetes, by race and ethnicity and age group: United States, 2020–2021

1Significant difference from White non-Hispanic and Hispanic people (p < 0.05).
2Significant difference from White non-Hispanic people (p < 0.05).
3Significant increasing trend with increasing age in all categories (p < 0.05).
NOTES: Data are based on a sample of 4,051 emergency department visits made by adults during 2020–2021, representing about 18,238,000 average annual visits made by adults with diabetes. To be counted as an emergency department visit by a patient with diabetes, the survey instrument (Patient Record Form) had to include an indication of diabetes (certain conditions could be selected using a yes or no format) or at least one diabetes diagnosis based on International Classification of Diseases, 10th Revision, Clinical Modification codes E08–E13. Visit rates are based on sets of estimates of the U.S. civilian noninstitutionalized population, as developed by the U.S. Census Bureau and reflect the population as of July 1, 2020, and July 1, 2021. Non-Hispanic people of other races (including American Indian and Alaska Native, Asian, and Native Hawaiian or Other Pacific Islander people, and people of two or more races) represent only 4.5% of all ED visits by adults with diabetes and are included in the denominator but are not shown. In 2020–2021, race was missing for 13.6% (weighted) and ethnicity was missing for 10.7% (weighted) of visits by adults with diabetes. Access data table for Figure 2.
SOURCE: National Center for Health Statistics, National Hospital Ambulatory Medical Care Survey, 2020–2021.
Did the ED visit rate by adults with diabetes differ by number of other chronic conditions and age?
- Most ED visits by adults with diabetes were made by patients with two to four other reported chronic conditions (541.4 visits per 1,000 visits) (Figure 3). Rates by patients with no other chronic conditions were lowest (90.2).
- Among adults with diabetes ages 18–44, ED visit rates were highest among those with two to four other chronic conditions (402.0) and lowest among those with five or more other conditions (93.8).
- Among adults with diabetes ages 45–64, ED visit rates were highest among those with two to four other chronic conditions (526.4) and lowest among those with no other conditions (87.7).
- Among adults with diabetes age 65 and older, ED visit rates were highest among those with two to four other conditions (605.2), followed by those with five or more conditions (217.7), one other chronic condition (140.6), and no other conditions (36.5).
- The ED visit rate by adults with diabetes and two to four or five or more other chronic conditions increased by age, but the rates for those with no other chronic conditions or one other condition decreased with age.
Figure 3. Emergency department visit rate among adults with diabetes, by number of additional chronic conditions and age group: United States, 2020–2021

1Significant decreasing trend with increasing age (p < 0.05).
2Significant increasing trend with increasing age (p < 0.05).
3Significant difference from all other categories (p < 0.05).
NOTES: Data are based on a sample of 4,051 emergency department visits made by adults during 2020–2021, representing about 18,238,000 average annual visits made by adults with diabetes. Visit rates are based on the average annual visits made by adults with diabetes in 2020 and 2021. Total visits include all visits by adults age 18 and older. To be counted as an emergency department visit by a patient with diabetes, the survey instrument (Patient Record Form) had to include an indication of diabetes (certain conditions could be selected using a yes or no format) or at least one diabetes diagnosis based on International Classification of Diseases, 10th Revision, Clinical Modification codes E08–E13. Visit rates for adults with chronic conditions are calculated by dividing the number of emergency department visits made by adults with diabetes and a specified number of other chronic conditions by the total number of emergency department visits made by adults with diabetes in 2020 and 2021. Access data table for Figure 3.
SOURCE: National Center for Health Statistics, National Hospital Ambulatory Medical Care Survey, 2020–2021.
Did ED visit rates by adults with diabetes change over the past decade?
- ED visit rates by adults with diabetes increased from 48.6 visits per 1,000 adults in 2012 to 74.9 in 2021 (Figure 4).
- ED visit rates by adults with diabetes age 65 and older were higher than all other age groups during 2012–2021, and increased from 113.4 in 2012 to 156.8 in 2021.
- ED visit rates by adults with diabetes ages 45–64 increased from 53.1 in 2012 to 89.2 in 2021.
- ED visit rates by adults with diabetes ages 18–44 increased from 20.9 in 2012 to 26.4 in 2016, but their rates remained stable for 2016–2021.
Figure 4. Emergency department visit rate among adults with diabetes, by age group: United States, 2012–2021

1Significant increasing trend from 2012 through 2021 (p < 0.05).
2Significant increasing trend from 2012 through 2016 (p < 0.05), no significant trend from 2016 through 2021.
NOTES: Rates are based on sets of estimates of the U.S. civilian noninstitutionalized population, as developed by the U.S. Census Bureau and reflect the population as of July 1 of each year during 2012–2021. Total visits include all visits by adults age 18 and older. To be counted as an emergency department visit by a patient with diabetes, the survey instrument (Patient Record Form) had to include an indication of diabetes (certain conditions could be selected using a yes or no format) or at least one diagnosis of diabetes based on International Classification of Diseases, 9th Revision, Clinical Modification codes 249 or 250 for data collected before 2016 or an International Classification of Diseases, 10th Revision, Clinical Modification code between E08 and E13 for data collected in or after 2016. Access data table for Figure 4.
SOURCE: National Center for Health Statistics, National Hospital Ambulatory Medical Care Survey, 2012–2021.
Summary
In 2020–2021, the annual ED visit rate by adults with diabetes was 72.2 visits per 1,000 adults. ED visit rates by adults with diabetes increased with age for both women and men. ED visit rates were highest among Black people, and higher among White people compared with Hispanic people. Among each race and ethnicity group, ED visit rates increased with age. Rates by adults with two or more other chronic conditions were higher than rates for adults with one or no other chronic conditions. From 2012 through 2021, ED visit rates among all adults with diabetes increased, as well as among adults age 45 and older. Among adults ages 18–44, ED visit rates increased during 2012–2016 and then remained stable during 2016–2021. This report includes the most recent estimates of ED visits by adults with diabetes from the National Hospital Ambulatory Medical Care Survey (NHAMCS) and shows an increasing trend in rates by adults with diabetes in the ED setting.
Definitions
ED visits by adults with diabetes: In both 2020 and 2021, a checkbox item was included in NHAMCS that asked, “Does the patient have (mark all that apply).” The list included three checkboxes for diabetes: diabetes mellitus, type 1; diabetes mellitus, type 2; and diabetes mellitus, type unspecified. A separate item, provider’s diagnosis, collected information on up to five diagnoses related to the current visit, using verbatim text entries from the patient’s medical record, which were later coded by National Center for Health Statistics medical coders using the International Classification of Diseases, Ninth Revision, Clinical Modification (for survey years 2012–2015) and the International Classification of Diseases, 10th Revision, Clinical Modification (for 2016–2021) (7,8). To be sure that the chronic condition checkbox data were complete, a consistency check was performed during data editing to review responses to the provider’s diagnosis item. If any of the chronic conditions from the checkbox item were also listed in the diagnosis item, the relevant checkbox item was also checked. This report includes ED visits made by adults (age 18 and older) that had either a reported diagnosis of diabetes (International Classification of Diseases, Ninth Revision, Clinical Modification codes 249–250 or International Classification of Diseases, 10th Revision, Clinical Modification codes E08–E13) or a checkbox category of diabetes. Adults that either had diabetes diagnosed at the ED visit or had pre-existing diabetes that was documented in the medical record were included in the analysis.
ED visits by adults with diabetes and additional chronic conditions reported: The number of chronic conditions, excluding diabetes, was grouped into none (referring to adults with only diabetes), one, two to four, and five or more of the conditions collected in NHAMCS. Beside the checkboxes for diabetes described above, checkboxes for alcohol misuse, abuse, or dependence; Alzheimer disease or dementia; asthma; cancer; cerebrovascular disease or history of stroke or transient ischemic attack; chronic kidney disease; chronic obstructive pulmonary disease; congestive heart failure; coronary artery disease, ischemic heart disease or history of myocardial infarction; depression; end-stage renal disease; history of pulmonary embolism or deep vein thrombosis; HIV; hyperlipidemia; hypertension; obesity; obstructive sleep apnea; osteoporosis; and substance use disorders were included in NHAMCS in 2020 and 2021. The consistency check described above was performed during data editing for each checkbox.
ED visit rate: Calculated by dividing the number of ED visits by adults with diabetes, by the July 1, 2012–2021, sets of estimates of the U.S. civilian noninstitutionalized population (obtained from the U.S. Census Bureau’s Population Division) for each demographic group. Visit rates for adults with chronic conditions are calculated by dividing the number of ED visits made by adults with diabetes and a specified number of other chronic conditions by the total number of ED visits made by adults with diabetes in 2020 and 2021. Visit rates are presented as annual average rates per year.
Race and ethnicity: Race and Hispanic ethnicity were collected separately and converted into a single combined variable that includes Hispanic, Black non-Hispanic, White non-Hispanic, and other races non-Hispanic. Other races includes American Indian and Alaska Native, Asian, and Native Hawaiian or Other Pacific Islander people, and people of two or more races, representing 4.5% of all ED visits by adults with diabetes. Data for other races are included in the denominator but not shown. For 2020–2021, 13.6% of weighted race data and 10.7% of weighted ethnicity data were missing for ED visits by adults with diabetes; race and ethnicity were imputed for these missing records (7,8).
Data source and methods
This report analyzed data from NHAMCS, a nationally representative annual survey of nonfederal, general, and short-stay hospitals. NHAMCS uses a multistage probability design with samples of geographic primary sampling units, hospitals within primary sampling units, and patient visits within EDs. Analyses for this report were conducted using data from restricted-use data files. Public-use versions of these files are available from: https://www.cdc.gov/nchs/ahcd/datasets_documentation_related.htm. Count estimates and measures of variance could differ between the restricted-use and public-use files. Information for accessing the restricted-use data file is available from: https://www.cdc.gov/rdc/index.htm. Additional information on the methodology of NHAMCS is available online (7,8). This report presents results combining data for 2020 and 2021 for more detailed subgroup analyses. In addition to the 2020–2021 data, Figure 4 includes individual data years from the 2012–2021 NHAMCS.
Data analyses were performed using the statistical packages SAS version 9.4 (SAS Institute, Cary, N.C.) and SAS-callable SUDAAN version 11.0 (RTI International, Research Triangle Park, N.C.). To test for linear and quadratic trends over time, the null hypothesis of nonlinear or quadratic trend was examined using the POLY option in SUDAAN. If a quadratic trend was significant, Joinpoint software (9) was used to determine the change point in the trend line. Piecewise linear regression was used to test the significance of slopes according to National Center for Health Statistics trend analysis guidelines (10). Differences among groups were evaluated using two-sided significance tests at the p < 0.05 level.
About the authors
Loredana Santo, Susan M. Schappert, and Jill J. Ashman are with the National Center for Health Statistics, Division of Health Care Statistics.
References
- Xu JQ, Murphy SL, Kochanek KD, Arias E. Mortality in the United States, 2021. NCHS Data Brief, no 456. Hyattsville, MD: National Center for Health Statistics. 2022. DOI: https://dx.doi.org/10.15620/cdc:122516.
- Centers for Disease Control and Prevention. Type 2 diabetes.
- Hall MJ, Rui P, Schwartzman A. Emergency department visits by patients aged 45 and over with diabetes: United States, 2015. NCHS Data Brief, no 301. Hyattsville, MD: National Center for Health Statistics. 2018.
- Andes LJ, Cheng YJ, Rolka DB, Gregg EW, Imperatore G. Prevalence of prediabetes among adolescents and young adults in the United States, 2005–2016. JAMA Pediatr 174(2):e194498. 2020.
- American Diabetes Association. 12. Older adults: Standards of medical care in diabetes—2020. Diabetes Care 43(Suppl 1):S152–62. 2020.
- Uppal TS, Chehal PK, Fernandes G, Haw JS, Shah M, Turbow S, et al. Trends and variations in emergency department use associated with diabetes in the U.S. by sociodemographic factors, 2008–2017. JAMA Netw Open 5(5):e2213867. 2022.
- National Center for Health Statistics. 2020 NHAMCS micro-data file documentation. 2022.
- National Center for Health Statistics. 2021 NHAMCS micro-data file documentation. 2023.
- National Cancer Institute. Joinpoint Regression Program (Version 4.6.0) [computer software]. 2019.
- Ingram DD, Malec DJ, Makuc DM, Kruszon-Moran D, Gindi RM, Albert M, et al. National Center for Health Statistics guidelines for analysis of trends. Vital Health Stat 2(179). 2018.
Suggested citation
Santo L, Schappert SM, Ashman JJ. Emergency department visit rates by adults with diabetes: United States, 2020–2021. NCHS Data Brief, no 487. Hyattsville, MD: National Center for Health Statistics. 2023. DOI: https://dx.doi.org/10.15620/cdc:134505.
Copyright information
All material appearing in this report is in the public domain and may be reproduced or copied without permission; citation as to source, however, is appreciated.
National Center for Health Statistics
Brian C. Moyer, Ph.D., Director
Amy M. Branum, Ph.D., Associate Director for Science
Division of Health Care Statistics
Carol J. DeFrances, Ph.D., Director
Alexander Strashny, Ph.D., Associate Director for Science