Characteristics of Mothers Admitted to Intensive Care Units During Hospitalization for Delivery of a Live-born Infant: United States, 2020–2022
Data from the National Vital Statistics System
- The admission rate of mothers to an intensive care unit (ICU) during hospitalization for delivery was 1.8 per 1,000 live births in 2020–2022.
- The ICU admission rate was lower for White non-Hispanic mothers than for mothers of other race and Hispanic-origin groups.
- ICU admission rates were lowest for mothers younger than age 25 (1.4) and increased with age to 6.5 for mothers age 45 and older.
- The ICU admission rate for mothers delivering their sixth live birth or more was 3.5, nearly double the rate for mothers with three or fewer live births.
- ICU admission rates were higher for mothers delivering twins and triplet or higher-order births than for mothers delivering singletons.
Although admission of a mother to an intensive care unit (ICU) during hospitalization for delivery is a relatively rare event, rates of mortality and severe morbidity are high for both mother and child when ICU care is necessary (1–4). Studies on maternal ICU admissions have generally focused on medical diagnoses related to admission, and most have been conducted using international data or data for a hospital or group of hospitals (4–10). Information on demographic characteristics of mothers admitted to ICUs is lacking at the national level. This report describes ICU admissions overall and by race and Hispanic origin, maternal age, live birth order, and plurality for mothers delivering live-born infants in the United States in 2020–2022.
Keywords: pregnancy, maternal age, race and Hispanic origin, National Vital Statistics System
ICU admission rates varied by race and ethnicity.
- The overall admission rate of mothers to an ICU during hospitalization for delivery was 1.8 per 1,000 live births in 2020–2022 (Figure 1).
- ICU admission rates were higher for American Indian and Alaska Native non-Hispanic (2.7), Black non-Hispanic (2.6), Native Hawaiian or Other Pacific Islander non-Hispanic (2.5), Asian non-Hispanic (2.1), and Hispanic (1.7) mothers than for White non-Hispanic (subsequently, White) (1.5) mothers.
- ICU admission rates were lower for Hispanic mothers than for mothers of all race and Hispanic-origin groups except White mothers.
Figure 1. Intensive care unit admission rate of mothers during hospitalization for delivery of a live-born infant, by race and Hispanic origin: United States, 2020–2022
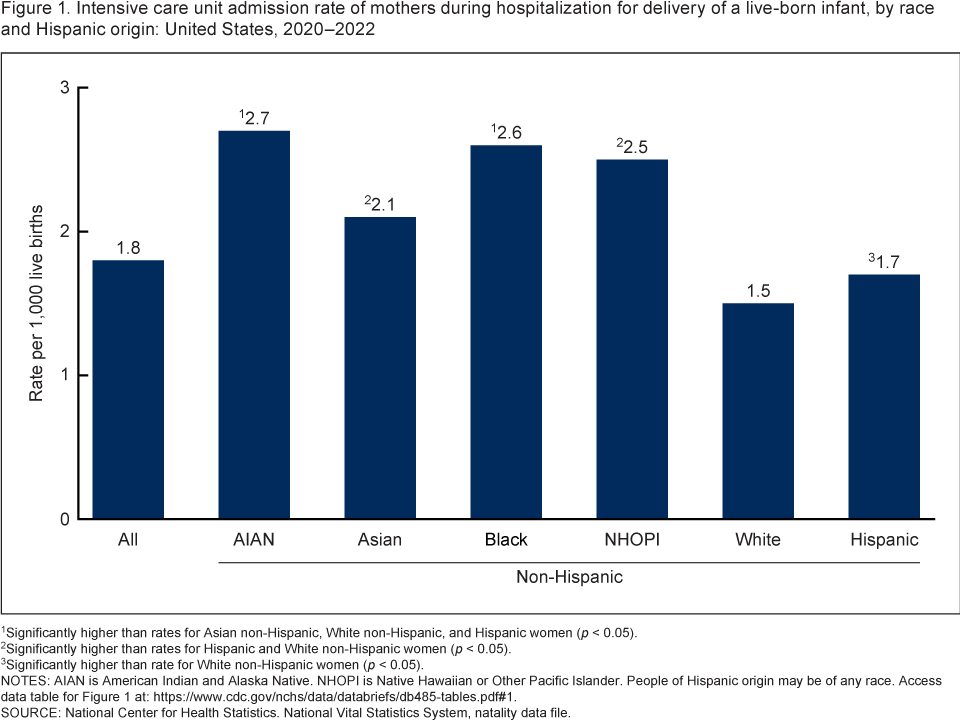
1Significantly higher than rates for Asian non-Hispanic, White non-Hispanic, and Hispanic women (p < 0.05).
2Significantly higher than rates for Hispanic and White non-Hispanic women (p < 0.05).
3Significantly higher than rate for White non-Hispanic women (p < 0.05).
NOTES: AIAN is American Indian and Alaska Native. NHOPI is Native Hawaiian or Other Pacific Islander. People of Hispanic origin may be of any race. Access data table for Figure 1.
SOURCE: National Center for Health Statistics. National Vital Statistics System, natality data file.
ICU admission rates increased with maternal age.
- ICU admission rates increased with maternal age, ranging from a low of 1.4 per 1,000 live births for mothers younger than age 25 to a high of 6.5 for mothers age 45 and older (Figure 2).
- Although each age group was significantly different, ICU admission rates were more comparable by age group for mothers younger than age 35 than for older mothers. Rates were 1.4, 1.5, and 1.8 for mothers younger than age 25, 25–29, and 30–34, respectively, and 2.5, 3.8, and 6.5 for mothers ages 35–39, 40–44, and 45 and older.
- Compared with the rate for the age group immediately preceding it, the rate was 7% higher for mothers ages 25–29, 20% higher for those 30–34, 39% higher for those 35–39, 52% higher for those 40–44, and 71% higher for those 45 and older.
Figure 2. Intensive care unit admission rate of mothers during hospitalization for delivery of a live-born infant, by maternal age:
United States, 2020–2022
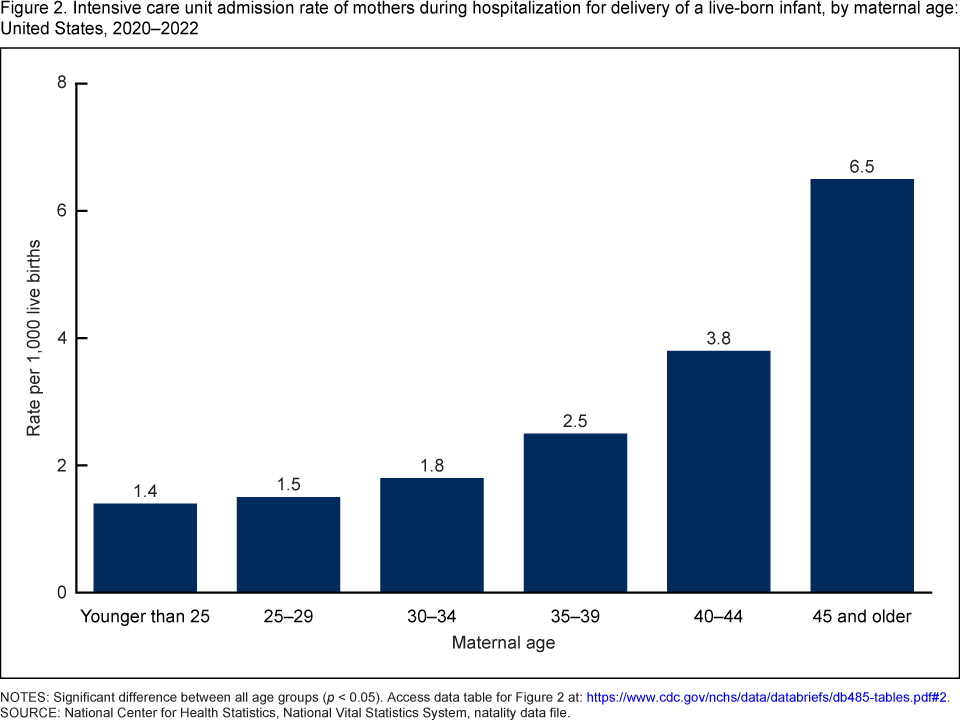
NOTES: Significant difference between all age groups (p < 0.05). Access data table for Figure 2.
SOURCE: National Center for Health Statistics, National Vital Statistics System, natality data file.
ICU admission rates rose with increasing live birth order.
- The ICU admission rate was 1.7 per 1,000 live births for mothers delivering their first live birth, then decreased to 1.6 for mothers delivering their second live birth, and then increased with increasing live birth order, reaching a high of 3.5 for mothers delivering their sixth live birth or more (Figure 3).
- The ICU admission rate was about twice as high for mothers delivering their sixth live birth or more than for mothers delivering their first, second, or third live birth (1.7, 1.6, and 1.8, respectively).
Figure 3. Intensive care unit admission rate of mothers during hospitalization for delivery of a live-born infant, by live birth order: United States, 2020–2022
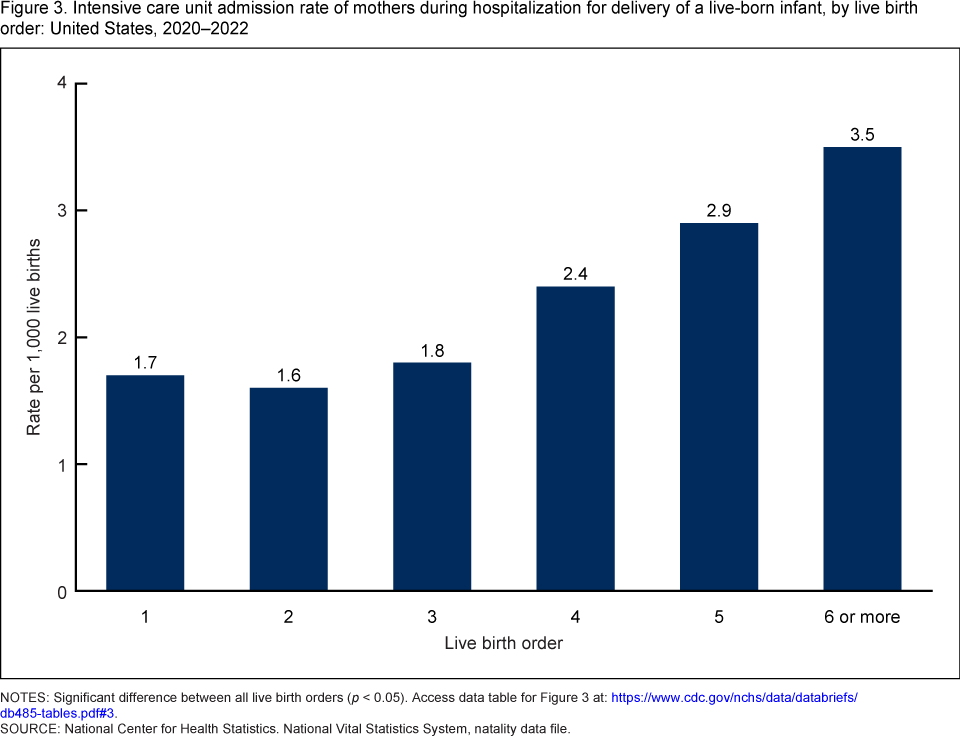
NOTES: Significant difference between all live birth orders (p < 0.05). Access data table for Figure 3.
SOURCE: National Center for Health Statistics. National Vital Statistics System, natality data file
ICU admission rates were higher for mothers with multiple gestation pregnancies.
- The ICU admission rate was 1.7 per 1,000 live births for mothers delivering singletons, 5.3 for mothers delivering twins, and 11.5 for mothers delivering triplet or higher-order multiple births (Figure 4).
Figure 4. Intensive care unit admission rate of mothers during hospitalization for delivery of a live-born infant, by plurality: United States, 2020–2022
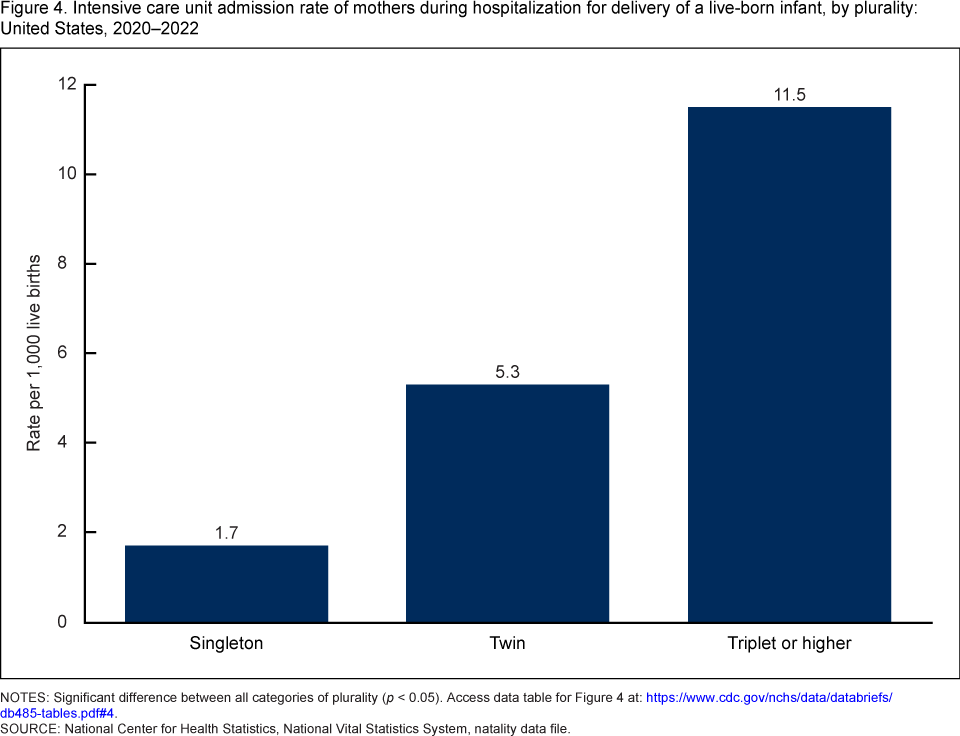
NOTES: Significant difference between all categories of plurality (p < 0.05). Access data table for Figure 4.
SOURCE: National Center for Health Statistics, National Vital Statistics System, natality data file.
Summary
The admission rate to an ICU for mothers delivering live-born infants in 2020–2022 was 1.8 per 1,000 live births, an average of 6,634 admissions per year. Although the number of ICU admissions is relatively small, the need for ICU care is associated with high rates of mortality and severe morbidity for both the mother and the infant (1–4).
This analysis shows that ICU admission rates around the time of delivery vary by demographic characteristics and plurality. The admission rate was lower for White mothers than for mothers of other race and Hispanic-origin groups, and higher for mothers who were older, had four or more previous live births, or had multiple gestation pregnancies. These factors are often associated with prepregnancy and pregnancy-related medical conditions that also increase the risk of morbidity and mortality (11).
The risk of severe morbidity and mortality is high among mothers when admission to an ICU is necessary and increases for mothers with multiple risk factors (11,12). Awareness of the demographic characteristics and medical factors that place mothers at higher risk of ICU admission may help inform efforts to ensure that pregnant women have access to the appropriate level of specialized perinatal care.
Definition
Admission to an intensive care unit: Any admission, planned or unplanned, of the mother to a facility or unit designated as providing intensive care during the hospitalization in which a live-born infant was delivered.
Data source and methods
Data shown in this report are based on final counts of births registered in all states and the District of Columbia in 2020–2022 and are taken from the natality data files of the National Vital Statistics System. Information on admission to an ICU is provided by the hospital of delivery. Race and Hispanic origin are reported separately on the birth certificate and follow the standards issued by the Office of Management and Budget in 1997 (13).
Unless otherwise noted, all changes described in this report are statistically significant at the 0.05 level based on a two-tailed z test. Computations exclude records for which information is unknown.
About the authors
Isabelle Horon is with the National Center for Health Statistics, Division of Vital Statistics.
References
- Siegel RL, Miller KD, Wagle NS, Jemal A. Cancer statistics, 2023. Ca Cancer J 73:17–48. 2023. Vasquez DN, Estenssoro E, Canales HS, Reina R, Saenz MG, Das Neves AV, et al. Clinical characteristics and outcomes of obstetric patients requiring ICU admission. Chest 131:718. 2007.
- Caratin-Ceba R, Gajic O, Iyer VN, Vlahakis NE. Fetal outcomes of critically ill pregnant women admitted to the intensive care unit for nonobstetric causes. Crit Care Med 36:2746. 2008.
- Aoyama K, Seaward PG, Lapinsky SE. Fetal outcome in the critically ill pregnant woman. Crit Care 18:307. 2014.
- Madan I, Puri I, Jain NJ, Grotegut C, Nelson D, Dandolu V. Characteristics of obstetric care unit admissions in New Jersey. J Matern Fetal Neonatal Med 22:785. 2009.
- Zwart JJ, Dupuis JRO, Richters A, Ory F, van Roosmalen J. Obstetric intensive care unit admission: A 2-year nationwide population-based cohort study. Intensive Care Med 36:256. 2010.
- Pollock W, Rose L, Dennis CL. Pregnant and postpartum admissions to the intensive care unit: A systematic review. Intensive Care Med 36:1465. 2010.
- Porreco RP, Barkey R. Peripartum intensive care. J Matern Fetal Neonatal Med 23:1136. 2010.
- Muench MV, Baschat AA, Malinow AM, Mighty HE. Analysis of disease in the obstetric intensive care unit at a university referral center: A 24-month review of prospective data. J Reprod Med 53:914. 2008.
- Wanderer JP, Leffert LR, Mhyre JM, Kuklina EV, Callaghan WM, Bateman BT. Epidemiology of obstetric-related ICU admissions in Maryland: 1999–2008. Crit Care Med 41:1844. 2013.
- Orsini J, Butala A, Diaz L, Muzylo E, Mainardi C, Kastell P. Clinical profile of obstetric patients admitted to the medical-surgical intensive care unit (MSICU) of an inner-city hospital in New York. J Clin Med Res 4:314. 2012.
- Potti S, Jain NJ, Mastrogiannis DS, Dandolu V. Obstetric outcomes in pregnant women with diabetes versus hypertensive disorders versus both. J Matern Fetal Neonatal Med 25(4):385–8. 2012. DOI: https://doi.org/10.3109/14767058.2011.580403.
- Leonard SA, Main EK, Scott KA, Profit J, Carmichael SL. Racial and ethnic disparities in severe maternal morbidity prevalence and trends. Ann Epidemiol 33:30–6. 2019. DOI: https://doi.org/10.1016/j.annepidem.2019.02.007.
- Office of Management and Budget. Revisions to the standards for the classification of federal data on race and ethnicity. Fed Regist 62(210):58782–90. 1997. Available from: https://www.govinfo.gov/content/pkg/FR-1997-10-30/pdf/97-28653.pdf.
Suggested citation
Horon I. Characteristics of mothers admitted to intensive care units during hospitalization for delivery of a live-born infant: United States, 2020–2022. NCHS Data Brief, no 485. Hyattsville, MD: National Center for Health Statistics. 2023. DOI: https://dx.doi.org/10.15620/cdc:134500.
Copyright information
All material appearing in this report is in the public domain and may be reproduced or copied without permission; citation as to source, however, is appreciated.
National Center for Health Statistics
Brian C. Moyer, Ph.D., Director
Amy M. Branum, Ph.D., Associate Director for Science
Division of Vital Statistics
Paul D. Sutton, Ph.D., Director
Andrés A. Berruti, Ph.D., M.A., Associate Director for Science