Declines in Cancer Death Rates Among Youth: United States, 2001–2021
NCHS Data Brief No. 484, November 2023
PDF Version (462 KB)
Sally C. Curtin, M.A., and Robert N. Anderson, Ph.D.
- Key findings
- Between 2001 and 2021, cancer death rates declined for both female and male youth ages 0–19 years.
- Cancer death rates declined between 2001 and 2011 for all age groups of youth.
- In 2021, the cancer death rate for White youth was lower than for Black and Hispanic youth.
- In 2021, brain cancer was the most common type of cancer causing death in youth.
Data from the National Vital Statistics System
- From 2001 to 2021, the cancer death rate for youth ages 0–19 years in the United States declined 24%, from 2.75 to 2.10 per 100,000.
- Declines between 2001 and 2011 in cancer death rates occurred for all age groups (0–4, 5–9, 10–14, and 15–19 years), but only rates among those ages 0–4 and 5–9 declined through 2021.
- Declines between 2001 and 2011 in cancer death rates occurred for Black non-Hispanic, White non-Hispanic (subsequently, White), and Hispanic youth, but only rates for White youth continued to decline through 2021.
- Brain cancer was the most common cancer causing death in youth in 2021, with a rate (0.59) that was 23% higher than the rate for leukemia (0.48) and more than twice that of bone and articular cartilage cancer (0.25).
Since the mid-1970s, cancer death rates for youth in the United States have declined significantly despite a slow increase in incidence for some of the major types (1–3). A previous report with trends from 1999 through 2014 showed declines for all 5-year age groups of youth (0–4, 5–9, 10–14, 15–19) (4). This Data Brief updates that report by presenting trends in cancer death rates through 2021. Rates from 2001 to 2021 are presented in total and for females and males. Rates for 2001, 2011, and 2021 are presented by 5-year age groups and for White, Black, and Hispanic youth. Trends are shown for the three most common types of cancer in youth.
Keywords: malignant neoplasms, death certificates, underlying cause of death, National Vital Statistics System
Between 2001 and 2021, cancer death rates declined for both female and male youth ages 0–19 years.
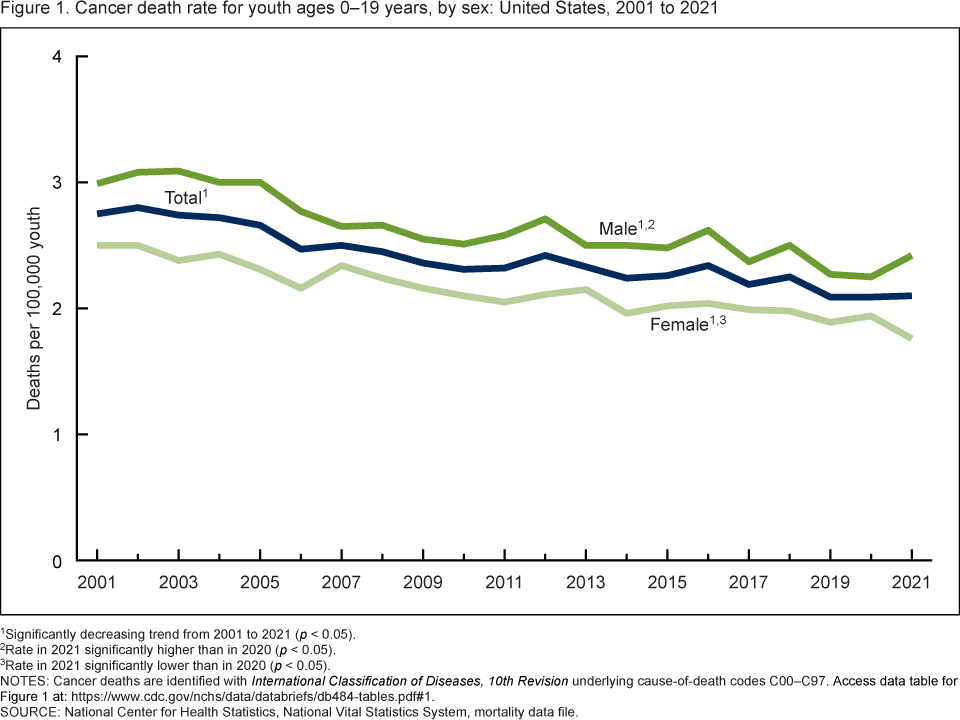
- The cancer death rate for youth ages 0–19 years was 24% lower in 2021 (2.10 per 100,000) than in 2001 (2.75) (Figure 1).
- Cancer death rates declined for both female and male youth between 2001 and 2021, by 30% for females (from 2.50 to 1.76) and 19% for males (from 2.99 to 2.42).
- From 2020 to 2021, the cancer death rate for male youth increased 8% (from 2.25 to 2.42), while the rate for females declined 9% (from 1.94 to 1.76).
- During 2001, 2011, and 2021, cancer death rates for male youth ranged from 20–38% higher than females, with the largest percentage difference in 2021.
Figure 1. Cancer death rate for youth ages 0–19 years, by sex: United States, 2001 to 2021
1Significantly decreasing trend from 2001 to 2021 (p < 0.05).
2Rate in 2021 significantly higher than in 2020 (p < 0.05).
3Rate in 2021 significantly lower than in 2020 (p < 0.05).
NOTES: Cancer deaths are identified with International Classification of Diseases, 10th Revision underlying cause-of-death codes C00–C97. Access data table for Figure 1.
SOURCE: National Center for Health Statistics, National Vital Statistics System, mortality data file.
Cancer death rates declined between 2001 and 2011 for all age groups of youth.
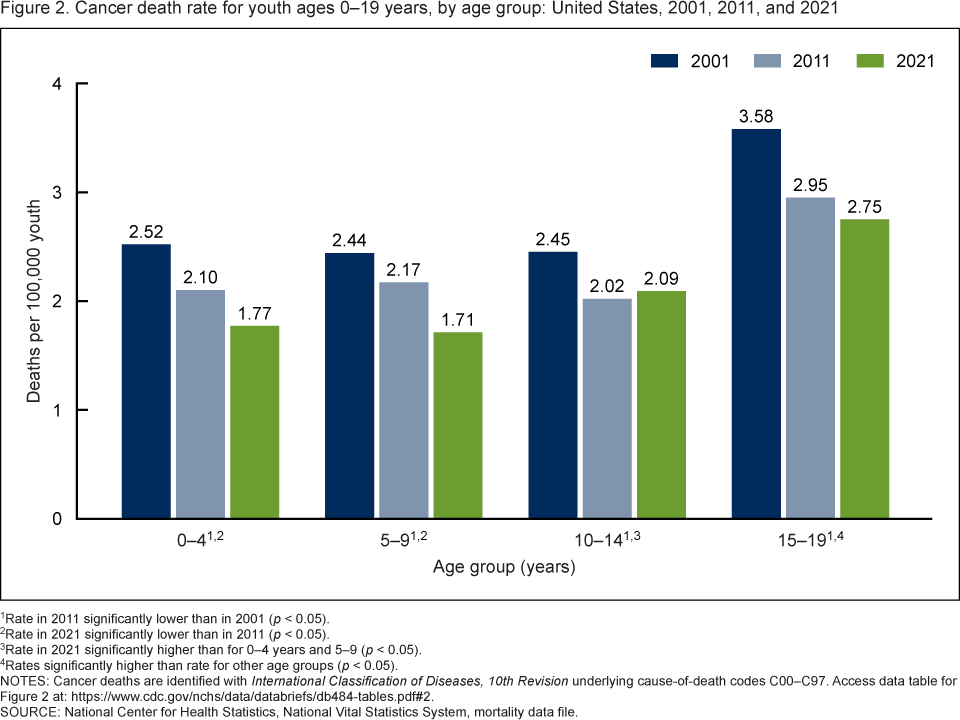
- Youth in all age groups (0–4, 5–9, 10–14, and 15–19) experienced declines in cancer death rates between 2001 and 2011, but only those ages 0–4 and 5–9 had significant declines between 2011 and 2021 (Figure 2).
- In 2001, 2011, and 2021, adolescents ages 15–19 had the highest cancer death rates of all age groups of youth, although the rate for this group was 23% lower in 2021 (2.75 per 100,000) than in 2001 (3.58).
- In 2001 and 2011, cancer death rates for youth ages 0–4, 5–9, and 10–14 were not significantly different; by 2021, the rate for adolescents ages 10–14 (2.09) was higher than for children ages 0–4 (1.77) and 5–9 (1.71).
Figure 2. Cancer death rate for youth ages 0–19 years, by age group: United States, 2001, 2011, and 2021
1Rate in 2011 significantly lower than in 2001 (p < 0.05).
2Rate in 2021 significantly lower than in 2011 (p < 0.05).
3Rate in 2021 significantly higher than for 0–4 years and 5–9 (p < 0.05).
4Rates significantly higher than rate for other age groups (p < 0.05).
NOTES: Cancer deaths are identified with International Classification of Diseases, 10th Revision underlying cause-of-death codes C00–C97. Access data table for Figure 2.
SOURCE: National Center for Health Statistics, National Vital Statistics System, mortality data file.
In 2021, the cancer death rate for White youth was lower than for Black and Hispanic youth.
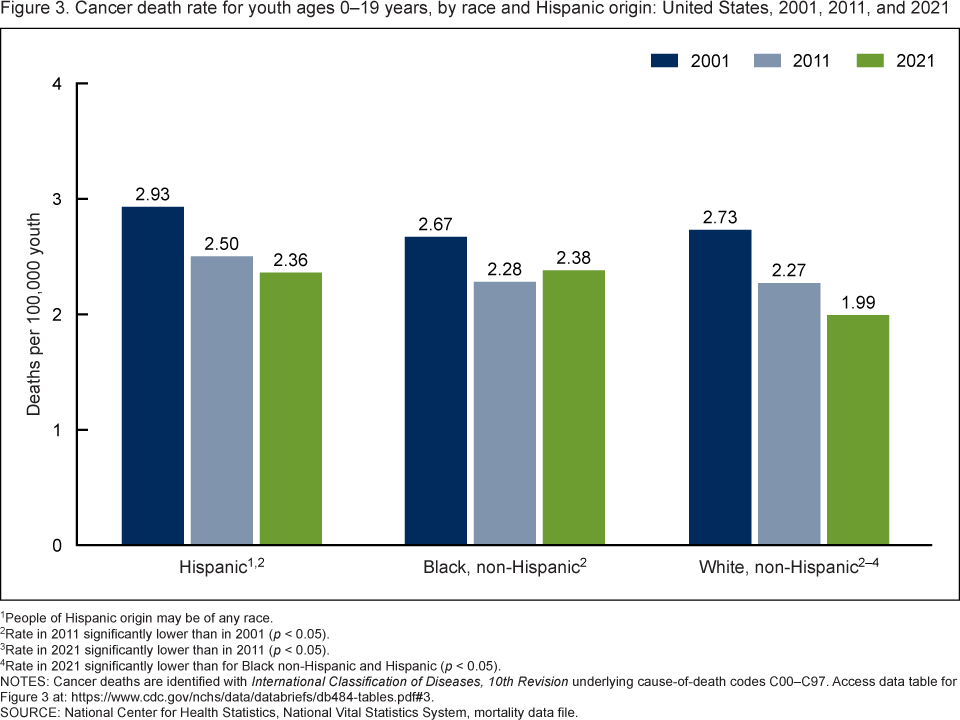
- Percentage declines between 2001 and 2011 in cancer death rates were similar among Black non-Hispanic (subsequently, Black), White non-Hispanic (subsequently, White), and Hispanic youth, ranging from 15 to 17% (Figure 3).
- The cancer death rate for White youth declined 12% from 2011 through 2021 (from 2.27 to 1.99 per 100,000), while rates for Black and Hispanic youth did not change significantly.
- In 2001 and 2011, differences in cancer death rates among Black, White, and Hispanic youth were not statistically significant. In 2021, the rate for White youth was 15%–16% lower than for Black and Hispanic youth.
Figure 3. Cancer death rate for youth ages 0–19 years, by race and Hispanic origin: United States, 2001, 2011, and 2021
1People of Hispanic origin may be of any race.
2Rate in 2011 significantly lower than in 2001 (p < 0.05).
3Rate in 2021 significantly lower than in 2011 (p < 0.05).
4Rate in 2021 significantly lower than for Black non-Hispanic and Hispanic (p < 0.05).
NOTES: Cancer deaths are identified with International Classification of Diseases, 10th Revision underlying cause-of-death codes C00–C97. Access data table for Figure 3.
SOURCE: National Center for Health Statistics, National Vital Statistics System, mortality data file.
In 2021, brain cancer was the most common type of cancer causing death in youth.
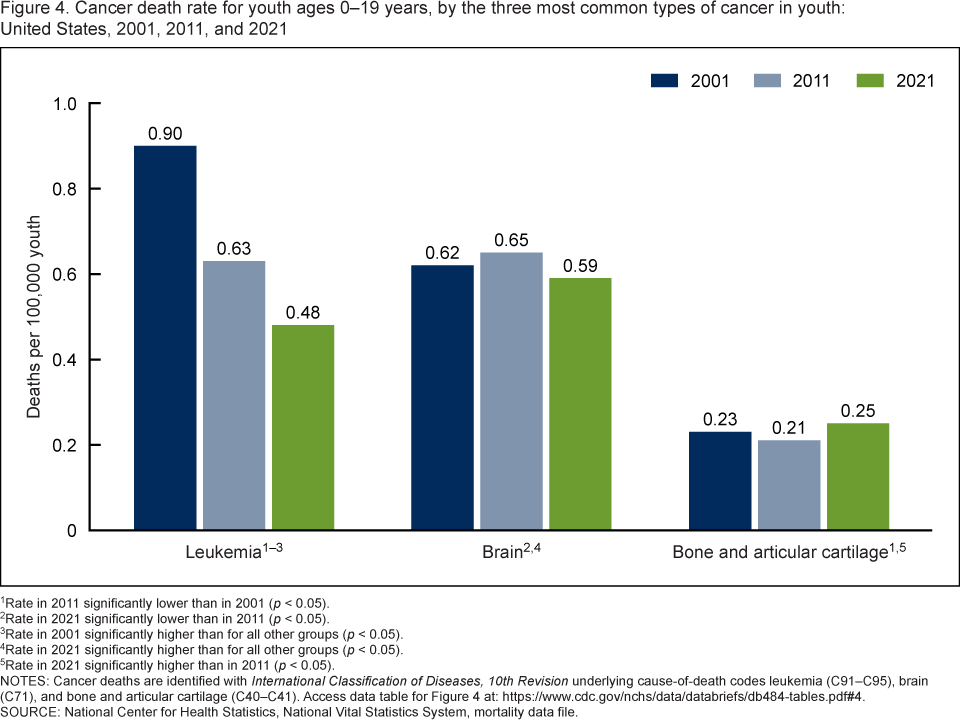
- Death rates among youth due to leukemia, the most common type of cancer causing death in youth in 2001, declined 47% between 2001 and 2021, from 0.90 per 100,000 to 0.48 (Figure 4).
- Brain cancer death rates did not change significantly between 2001 and 2011 but declined by 11% from 2011 (0.65) to 2021 (0.59).
- Among youth, cancer death rates due to bone and articular cartilage cancer declined from 0.23 to 0.21 during 2001–2011 but then increased to 0.25 through 2021.
- Brain cancer was the leading type of cancer causing death in youth in 2021, with a death rate that was 23% higher than for leukemia and more than twice that of bone and articular cancer.
Figure 4. Cancer death rate for youth ages 0–19 years, by the three most common types of cancer in youth: United States, 2001, 2011, and 2021
1Rate in 2011 significantly lower than in 2001 (p < 0.05).
2Rate in 2021 significantly lower than in 2011 (p < 0.05).
3Rate in 2001 significantly higher than for all other groups (p < 0.05).
4Rate in 2021 significantly higher than for all other groups (p < 0.05).
5Rate in 2021 significantly higher than in 2011 (p < 0.05).
NOTES: Cancer deaths are identified with International Classification of Diseases, 10th Revision underlying cause-of-death codes leukemia (C91–C95), brain (C71), and bone and articular cartilage (C40–C41). Access data table for Figure 4.
SOURCE: National Center for Health Statistics, National Vital Statistics System, mortality data file.
Summary
Cancer mortality in youth continued to decline during 2001–2021, building on progress of the previous 3 decades (1–4). The overall cancer death rate declined by one-fourth during 2001–2021, with a greater percentage decline for females (30%) than males (19%). All 5-year age groups experienced declines from 2001 to 2011, but only the younger age groups (0–4 and 5–9 years) experienced significant declines from 2011 to 2021. White, Black, and Hispanic youth had similar cancer death rates in 2001 and 2011. However, the rate for White youth continued to decline from 2011 to 2021, while rates for Black and Hispanic youth remained stable. As such, in 2021, the rate for White youth was significantly lower than for Black and Hispanic youth. Leukemia had been the most common type of cancer causing death in youth in 2001 but declined by 47% over the period. Despite an 11% decline in the second half of the period, brain cancer was the leading type of cancer causing death in youth in 2021. Death rates due to bone and articular cancer increased from 2011 to 2021.
Data source and methods
Mortality and population data are from the National Center for Health Statistics 1999–2020 underlying cause-of-death bridged-race files and 2018–2021 underlying cause-of-death single-race files (5). Population data for 2001–2009 are based on July 1 intercensal estimates, and for 2011–2020 they are July 1 postcensal estimates based on the 2020 census. Population estimates for 2021 are estimated as of July 1 based on the Blended Base produced by the U.S. Census Bureau in lieu of the April 1, 2020, decennial population count. The Blended Base is a blend of vintage 2020 postcensal population estimates, 2020 Demographic Analysis estimates, and the 2020 Census PL 94-171 Redistricting File (6). Cancer deaths are those with International Classification of Diseases, 10th Revision underlying cause-of-death codes C00–C97 (7). Cancer deaths by specific anatomical site are classified as follows: leukemia (C91–C95), brain cancer (C71), and bone and articular cartilage (C40–C41).
Trends in Figure 1 were evaluated using the Joinpoint Regression Program (8). The Joinpoint software was used to fit weighted least-squares regression models to the estimated proportions on the logarithmic scale. The default settings allowed for as few as three observed time points in the beginning, ending, and middle line segments, including the joinpoints. Using these settings, a maximum of three joinpoints were searched for using the grid search algorithm and permutation test, using an overall alpha level of 0.05. Pairwise comparisons of rates shown in Figures 2–4 were tested using the test statistic at p < 0.05.
This report features data for the three largest race and ethnicity groups (White, Black, and Hispanic), which comprised 92% of all cancer deaths in youth in 2021. Data are not shown for American Indian and Alaska Native non-Hispanic, Asian non-Hispanic, and Native Hawaiian and Other Pacific Islander non-Hispanic people due to small sample sizes in some years that can result in unreliable rates. Information on race and ethnicity are from death certificates and are supplied by an informant, usually the next of kin. Race and Hispanic origin are two distinct attributes and are reported separately on death certificates. As such, the data shown in this report by Hispanic origin and race are based on a combination of the two attributes for the non-Hispanic population. Data shown for the Hispanic population include youth of any race. Death rates for Hispanic people are impacted by inconsistencies in reporting Hispanic origin on the death certificate compared with censuses and surveys. A validity study has shown underreporting on death certificates of Hispanic decedents by 3% (9). However, this underreporting was not found for Hispanic decedents under age 25. Rates in this report for 2001 and 2011 are based on multiple-race mortality data that were bridged to single-race categories based on the 1977 Office of Management and Budget standards for the classification of race and ethnicity. Rates for 2021 were based on the 1997 Office of Management and Budget standards and might differ slightly compared with the 1977 standards (10).
About the authors
Sally C. Curtin and Robert N. Anderson are with the National Center for Health Statistics, Division of Vital Statistics.
References
- Siegel RL, Miller KD, Wagle NS, Jemal A. Cancer statistics, 2023. Ca Cancer J 73:17–48. 2023.
- Ries LAG, Smith MA, Gurney JG, Linet M, Tamra T, Young JL, Bunin GR. Cancer incidence and survival among children and adolescents: United States SEER program 1975–1995, National Cancer Institute, SEER program. NIH Pub. No. 99-4649. 1999.
- Cronin KA, Scott S, Firth AU, Sung H, Henley JS, Sherman RL, et al. Annual report to the nation on the status of cancer, part 1: National cancer statistics. Cancer 128(24):4251–84. 2022.
- Curtin SC, Miniño AM, Anderson RN. Declines in cancer death rates among children and adolescents in the United States, 1999–2014. NCHS Data Brief, no 257. Hyattsville, MD: National Center for Health Statistics. 2016.
- National Center for Health Statistics. CDC WONDER. 1999–2020 underlying cause of death by bridged-race categories. 2018–2021 underlying cause of death by single-race categories. 2023.
- U.S. Census Bureau. Methodology for the United States population estimates: vintage 2021 nation, states, counties, and Puerto Rico–April 1, 2020 to July 1, 2021. 2021.
- World Health Organization. International statistical classification of diseases and related health problems, 10th revision (ICD–10). 2008 ed. 2009.
- National Cancer Institute. Joinpoint Regression Program (Version 4.9.0.0) [computer software]. 2021.
- Arias E, Heron M, Hakes JK. The validity of race and Hispanic-origin reporting on death certificates in the United States: An update. National Center for Health Statistics. Vital Health Stat 2(172). 2016.
- Heron M. Comparability of race-specific mortality data based on 1977 versus 1997 reporting standards. National Vital Statistics Reports; vol 70 no 3. Hyattsville, MD: National Center for Health Statistics. 2021.
Suggested citation
Curtin SC, Anderson RN. Declines in cancer death rates among youth: United States, 2001–2021. NCHS Data Brief, no 484. Hyattsville, MD: National Center for Health Statistics. 2023. DOI: https://dx.doi.org/10.15620/cdc:134499.
Copyright information
All material appearing in this report is in the public domain and may be reproduced or copied without permission; citation as to source, however, is appreciated.
National Center for Health Statistics
Brian C. Moyer, Ph.D., Director
Amy M. Branum, Ph.D., Associate Director for Science
Division of Vital Statistics
Paul D. Sutton, Ph.D., Director
Andrés A. Berruti, Ph.D., M.A., Associate Director for Science