Suicide Among Adults Age 55 and Older, 2021
- Key findings
- In 2021, among adults age 55 and older, men had higher suicide rates than women for all age groups.
- Between 2001 and 2021, suicide rates significantly increased for men ages 55–74 and women ages 55–84.
- Firearm-related suicide was the leading mechanism of death for men age 55 and older in 2021.
- Among women age 55 and older, women ages 55–64 had the highest rates of firearm-, poisoning-, and suffocation-related suicide in 2021.
Data from the National Vital Statistics System
- In 2021, among adults age 55 and older, the highest rates of suicide were for men age 85 and older (55.7 deaths per 100,000 population) and women ages 55–64 (7.8).
- The largest percent increase in suicide rates between 2001and 2021 occurred among men ages 55–64 and among women ages 65–74.
- Firearm-related suicide was the leading mechanism of suicide for men age 55 and older across all age groups in 2021.
- For women age 55 and older, rates of firearm-related and poisoning-related suicide were similar across all age groups.
Suicide is a leading cause of mortality in the United States, with an age-adjusted rate of 14.1 deaths per 100,000 population in 2021 (1). Older adults tend to have higher rates of suicide, although they represent a low percentage of the total number of suicides (2). Factors that specifically affect older adults can include declines in physical and cognitive functioning, changes in mental health, and other factors often associated with getting older, like bereavement, loneliness, and lack of social connectedness (3–8). This report presents suicide rates for adults age 55 and older by sex and mechanism of suicide.
Keywords: older adults, mortality, intentional self-harm, firearms, National Vital Statistics System
In 2021, among adults age 55 and older, men had higher suicide rates than women for all age groups.
- Among adults age 55 and older in 2021, the suicide rate for men was 29.6 deaths per 100,000 population, and the rate for women was 6.2 (Figure 1).
- Among men age 55 and older, the suicide rate increased with increasing age, from 26.6 (ages 55–64) and 26.1 (ages 65–74), to 38.2 (ages 75–84) and 55.7 (age 85 and older).
- Among women age 55 and older, the suicide rate decreased with increasing age, from 7.8 (ages 55–64) and 5.6 (ages 65–74), to 4.8 (ages 75–84) and 3.3 (age 85 and older).
- Among adults ages 55–64 and 65–74, the rates for men were 3 to 5 times higher than rates for women. Among adults ages 75–84, the rate for men was almost 8 times higher, and among adults age 85 and older, the rate for men was nearly 17 times higher than the rate for women.
Figure 1. Suicide rate among adults age 55 and older, by age group and sex: United States, 2021
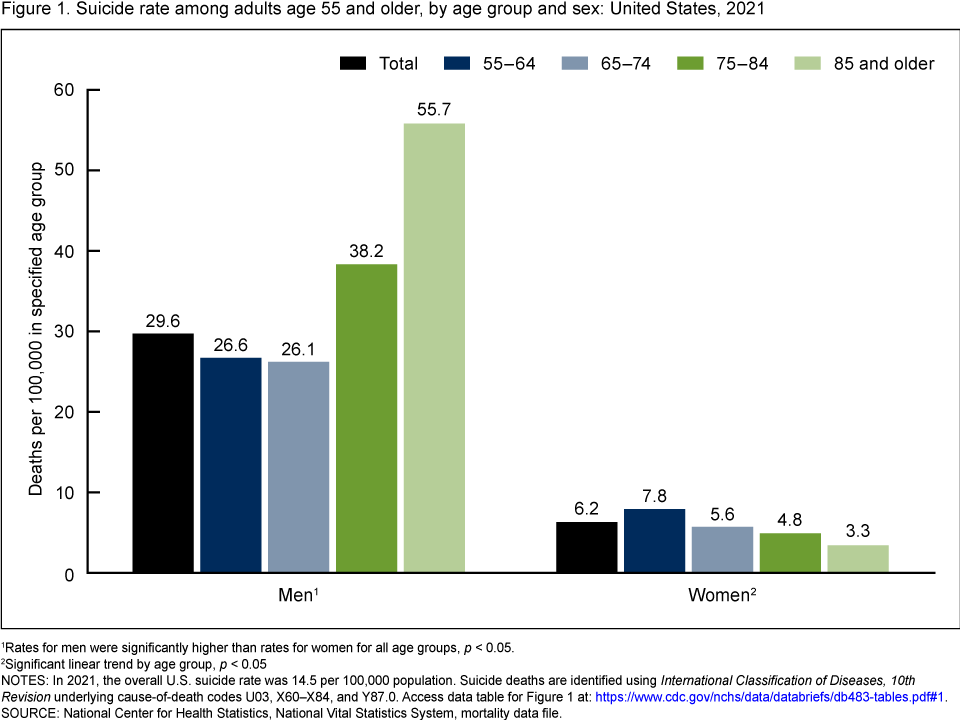
1Rates for men were significantly higher than rates for women for all age groups, p < 0.05.
2Significant linear trend by age group, p < 0.05.
NOTES: In 2021, the overall U.S. suicide rate was 14.5 per 100,000 population. Suicide deaths are identified using International Classification of Diseases, 10th Revision underlying cause-of-death codes U03, X60–X84, and Y87.0. Access data table for Figure 1.
SOURCE: National Center for Health Statistics, National Vital Statistics System, mortality data file.
Between 2001 and 2021, suicide rates significantly increased for men ages 55–74 and women ages 55–84.
- Among men age 55 and older, suicide rates increased across all age groups between 2001 and 2021, although only the increases for men ages 55–64 (from 21.2 deaths per 100,000 population to 26.6) and men ages 65–74 (from 24.5 to 26.1) were significant (Figure 2).
- Among women age 55 and older, suicide rates increased between 2001 and 2021 for those younger than 85.
- The largest increase in suicide rates for men occurred among those ages 55–64 (25% increase, from 21.2 to 26.6), and for women, among those ages 65–74 (44% increase, from 3.9 to 5.6).
Figure 2. Suicide rate among adults age 55 and older, by age group and sex: United States, 2001 and 2021

1Rate in 2021 was significantly higher than in 2001, p < 0.05.
2Significant linear trend by age group in 2001, p < 0.05.
3Significant linear trend by age group in 2021, p < 0.05.
NOTES: Suicide deaths are identified using International Classification of Diseases, 10th Revision underlying cause-of-death codes U03, X60–X84, and Y87.0. Access data table for Figure 2.
SOURCE: National Center for Health Statistics, National Vital Statistics System, mortality data file.
Firearm-related suicide was the leading mechanism of death for men age 55 and older in 2021.
- Firearm-related suicide rates increased with age. Men ages 55–64 had the lowest rate (16.0 deaths per 100,000 population), followed by ages 65–74 (19.2), ages 75–84 (32.1), and age 85 and older (45.9) (Figure 3).
- Poisoning-related suicide rates (includes deaths from drug overdose) were highest among men age 85 and older (3.5) compared with the other age groups, which ranged from 2.0 among men ages 65–74 to 2.5 among men ages 55–64.
- Suffocation-related suicide rates were highest among men ages 55–64 (5.7) and lowest among men ages 75–84 (2.4).
- Among men age 55 and older, rates for firearm-related suicide were nearly 3 to 14 times higher across age groups than rates for the next two leading mechanisms, suffocation and poisoning.
Figure 3. Suicide rate among men age 55 and older, by age group and mechanism of death: United States, 2021
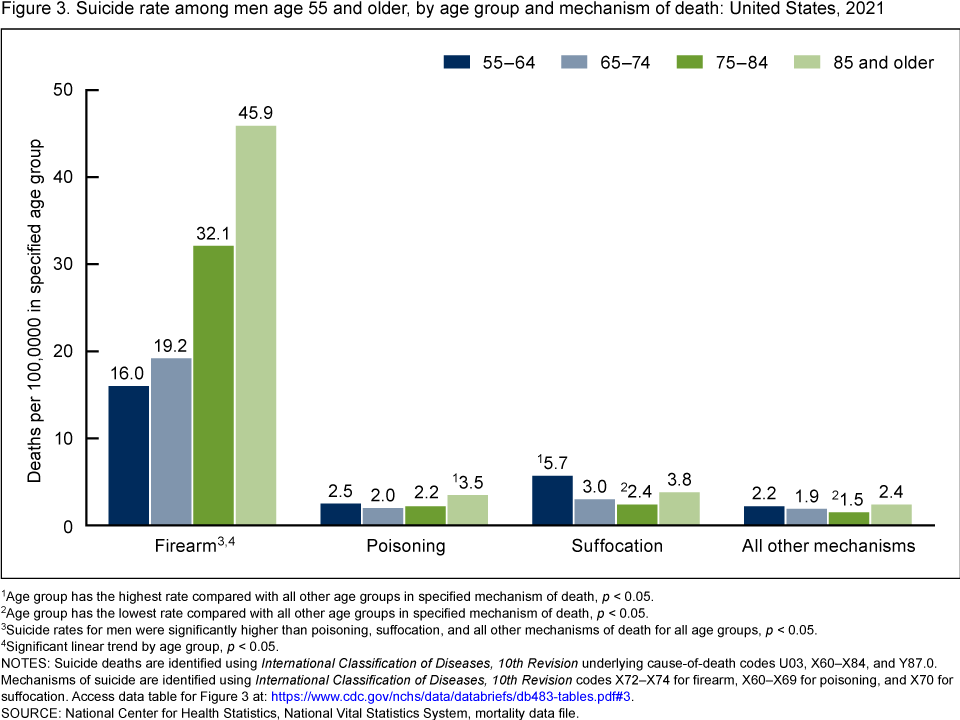
1Age group has the highest rate compared with all other age groups in specified mechanism of death, p < 0.05.
2Age group has the lowest rate compared with all other age groups in specified mechanism of death, p < 0.05.
3Suicide rates for men were significantly higher than poisoning, suffocation, and all other mechanisms of death for all age groups, p < 0.05.
4Significant linear trend by age group, p < 0.05.
NOTES: Suicide deaths are identified using International Classification of Diseases, 10th Revision underlying cause-of-death codes U03, X60–X84, and Y87.0. Mechanisms of suicide are identified using International Classification of Diseases, 10th Revision codes X72–X74 for firearm, X60–X69 for poisoning, and X70 for suffocation. Access data table for Figure 3.
SOURCE: National Center for Health Statistics, National Vital Statistics System, mortality data file.
Among women age 55 and older, women ages 55–64 had the highest rates of firearm–, poisoning–, and suffocation-related suicide in 2021.
- For firearm-related suicide, rates declined with increasing age. Women ages 55–64 had the highest rate (2.8 deaths per 100,000 population), and women age 85 and older had the lowest rate (0.9) (Figure 4).
- For poisoning-related (includes deaths from drug overdose) and suffocation-related suicide, rates generally declined with increasing age, although the trend for suffocation-related suicide by age was not significant.
- Among women age 55 and older, rates of firearm-related and poisoning-related suicide were similar for each age group.
Figure 4. Suicide rate among women age 55 and older, by age group and mechanism of death: United States, 2021
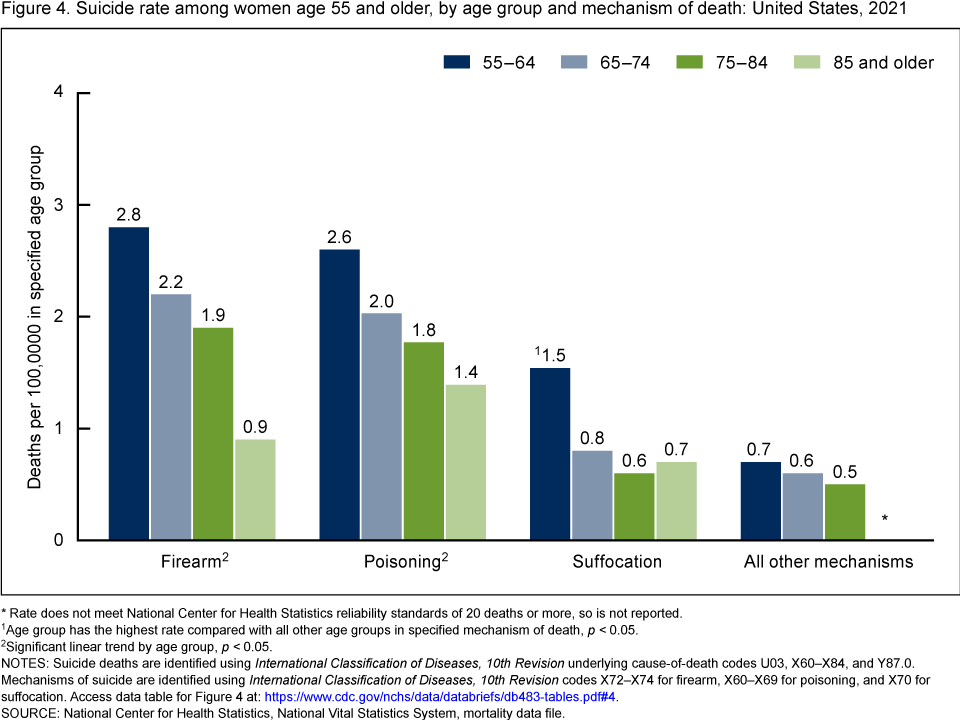
* Rate does not meet National Center for Health Statistics reliability standards of 20 deaths or more, so is not reported.
1Age group has the highest rate compared with all other age groups in specified mechanism of death, p < 0.05.
2Significant linear trend by age group, p < 0.05.
NOTES: Suicide deaths are identified using International Classification of Diseases, 10th Revision underlying cause-of-death codes U03, X60–X84, and Y87.0. Mechanisms of suicide are identified using International Classification of Diseases, 10th Revision codes X72–X74 for firearm, X60–X69 for poisoning, and X70 for suffocation. Access data table for Figure 4.
SOURCE: National Center for Health Statistics, National Vital Statistics System, mortality data file.
Summary
In 2021, suicide rates among adults age 55 and older varied by age group, sex, and mechanism of suicide. Among adults age 55 and older, the suicide rate for men generally increased with age, while the suicide rate for women decreased with age. Men age 85 and older had the highest rate, while women ages 55–64 had the highest rate. Between 2001 and 2021, the largest increases in suicide rates for men occurred among those ages 55–64 (25% increase), and for women among those ages 65–74 (44% increase). Rates significantly increased from 2001 to 2021 for men ages 55–64 and 65–74, while the rates increased for women ages 55–64, 65–74, and 75–84. Due to these increases among women, unlike 2001 where rates were similar for most age groups, suicide rates declined with increasing age in 2021.
For men age 55 and older, firearms were the leading mechanism of suicide across all age groups; rates were nearly 3 to 14 times higher than rates for suicide due to poisoning and suffocation across age groups. For firearm-related suicide among men, the rate increased with age. This pattern was not observed for poisoning, suffocation, or all other causes.
The patterns for women age 55 and older were different from men both in terms of magnitude and mechanism of suicide. For women age 55 and older, rates of firearm-related and poisoning-related suicide were generally highest, with similar rates for each age group across both mechanisms of suicide. Both firearm-related and poisoning-related suicide rates declined with increasing age among women.
Data source and methods
Data were analyzed using National Vital Statistics System multiple cause-of-death mortality files from 2001 to 2021 (1). Suicide deaths are identified using International Classification of Diseases, 10th Revision underlying cause-of-death codes U03, X60–X84, and Y87.0 (2). Mechanisms of suicide are identified using International Classification of Diseases, 10th Revision codes X72–X74 for firearm, X60–X69 for poisoning, and X70 for suffocation. Pairwise comparisons of rates were conducted using the z test with an alpha level of 0.05, and tests for trends across age groups were conducted using linear regression with an alpha level of 0.05 (9,10).
Population estimates for 2021 were estimated as of July 1, 2021, based on the Blended Base produced by the U.S. Census Bureau instead of the April 1, 2020, decennial population count. The Blended Base consists of the blend of vintage 2020 postcensal population estimates, 2020 Demographic Analysis Estimates, and the 2020 Census PL 94–171 Redistricting File (see
https://www2.census.gov/programs-surveys/popest/technical-documentation/methodology/2020-2021/methods-statement-v2021.pdf). Population data for 2001 are July 1 intercensal census estimates.
About the authors
Matthew F. Garnett, Merianne Rose Spencer, and Julie D. Weeks are with the National Center for Health Statistics, Division of Analysis and Epidemiology.
References
- Centers for Disease Control and Prevention. CDC WONDER online database. About multiple cause of death, 1999–2021. 2022.
- Garnett MF, Curtin SC. Suicide mortality in the United States, 2001–2021. NCHS Data Brief, no 464. Hyattsville, MD: National Center for Health Statistics. 2023. DOI: https://dx.doi.org/10.15620/cdc:125705.
- De Leo D. Late-life suicide in an aging world. Nat Aging 2(1):7–12. 2022.
- Handley TE, Hiles SA, Inder KJ, Kay-Lambkin FJ, Kelly BJ, Lewin TJ, et al. Predictors of suicidal ideation in older people: A decision tree analysis. Am J Geriatr Psychiatry 22(11): 1325–35. 2014.
- Conwell Y, Thompson C. Suicidal behavior in elders. Psychiatr Clin North Am. 31(2):333–56. 2008.
- Erlangsen A, Jeune B, Bille-Brahe U, Vaupel JW. Loss of partner and suicide risks among oldest old: A population-based register study. Age Ageing 33(4):378–83. 2004.
- Raue PJ, Morales KH, Post EP, Bogner HR, Have TT, Bruce ML. The wish to die and 5-year mortality in elderly primary care patients. Am J Geriatr Psychiatry 18(4):341–50. 2010.
- Almeida OP, Draper B, Snowdon J, Lautenschlager NT, Pirkis J, Byrne G, et al. Factors associated with suicidal thoughts in a large community study of older adults. Br J Psychiatry 201(6):466–72. 2012.
- Xu JQ, Murphy SL, Kochanek KD, Arias E. Deaths: Final data for 2019. National Vital Statistics Reports; vol 70 no 8. Hyattsville, MD: National Center for Health Statistics. 2021. DOI: https://dx.doi.org/10.15620/cdc:106058.
- Ingram DD, Malec DJ, Makuc DM, Kruszon-Moran D, Gindi RM, Albert M, et al. National Center for Health Statistics guidelines for analysis of trends. National Center for Health Statistics. Vital Health Stat 2(179). 2018.
Suggested citation
Garnett MF, Spencer MR, Weeks JD. Suicide among adults age 55 and older, 2021. NCHS Data Brief, no 483. Hyattsville, MD: National Center for Health Statistics. 2023. DOI: https://doi.org/10.15620/cdc:133701.
Copyright information
All material appearing in this report is in the public domain and may be reproduced or copied without permission; citation as to source, however, is appreciated.
National Center for Health Statistics
Brian C. Moyer, Ph.D., Director
Amy M. Branum, Ph.D., Associate Director for Science
Division of Analysis and Epidemiology
Irma E. Arispe, Ph.D., Director
Kimberly A. Lochner, Sc.D., Associate Director for Science