Long COVID in Adults: United States, 2022
- Key findings
- What percentage of adults ever had Long COVID or currently have Long COVID, and did it differ by sex?
- Did the percentage of adults who ever had Long COVID or who currently have Long COVID differ by age?
- Did the percentage of adults who ever had Long COVID or who currently have Long COVID differ by race and Hispanic origin?
- Did the percentage of adults who ever had Long COVID or who currently have Long COVID differ by family income as a percentage of the federal poverty level?
- Did the percentage of adults who ever had Long COVID or who currently have Long COVID differ by urbanization level?
Data from the National Health Interview Survey
- In 2022, 6.9% of adults ever had Long COVID and 3.4% had Long COVID at the time of interview (currently have Long COVID); women were more likely than men to ever have or currently have Long COVID.
- Adults ages 35–49 were the age group most likely to ever have (8.9%) or currently have (4.7%) Long COVID.
- The percentage of adults who ever had or currently had Long COVID varied by race and Hispanic origin.
- Adults with family incomes at 400% or more of the federal poverty level were less likely than those with family incomes at 200%–399% to ever have or currently have Long COVID.
- The percentage of adults who ever had Long COVID was lower in large central metropolitan areas compared with medium and small metropolitan and nonmetropolitan areas. Current Long COVID was lowest in large central metropolitan areas.
People who have had COVID-19 may continue to have symptoms or develop new symptoms months after being infected with SARS-CoV-2 (1). This can lead to long-term health and economic impacts on those affected and on society (2). This report uses data from the 2022 National Health Interview Survey to describe the percentage of adults who ever had or had Long COVID at the time of interview (currently have Long COVID) by sociodemographic and geographic characteristics. Long COVID was defined as self-reporting the presence of symptoms for at least 3 months after having COVID-19 among those who reported either a positive test or a doctor’s diagnosis of COVID-19.
Keywords: COVID-19, coronavirus, post-acute sequelae of SARS-CoV-2 infection (PASC), post-COVID conditions, National Health Interview Survey (NHIS)
What percentage of adults ever had Long COVID or currently have Long COVID, and did it differ by sex?
- In 2022, 6.9% of adults ever had Long COVID and 3.4% of adults currently had Long COVID (Figure 1).
- Women (8.5%) were more likely than men (5.2%) to ever have Long COVID, and women (4.4%) were also more likely than men (2.3%) to currently have Long COVID.
Figure 1. Percentage of adults who ever had Long COVID or currently have Long COVID, by sex: United States, 2022

1Significantly different from men within the same outcome (p < 0.05).
NOTES: Ever Long COVID was based on a “yes” response to the survey question, “Did you have any symptoms lasting 3 months or longer that you did not have prior to having COVID-19?” among those who reported receiving either a positive test or a doctor’s diagnosis of COVID-19 and were symptomatic. Current Long COVID was based on meeting the definition of ever Long COVID plus the presence of symptoms at the time of interview. Estimates are based on household interviews of a sample of the U.S. civilian noninstitutionalized population. Access data table for Figure 1.
SOURCE: National Center for Health Statistics, National Health Interview Survey, 2022.
Did the percentage of adults who ever had Long COVID or who currently have Long COVID differ by age?
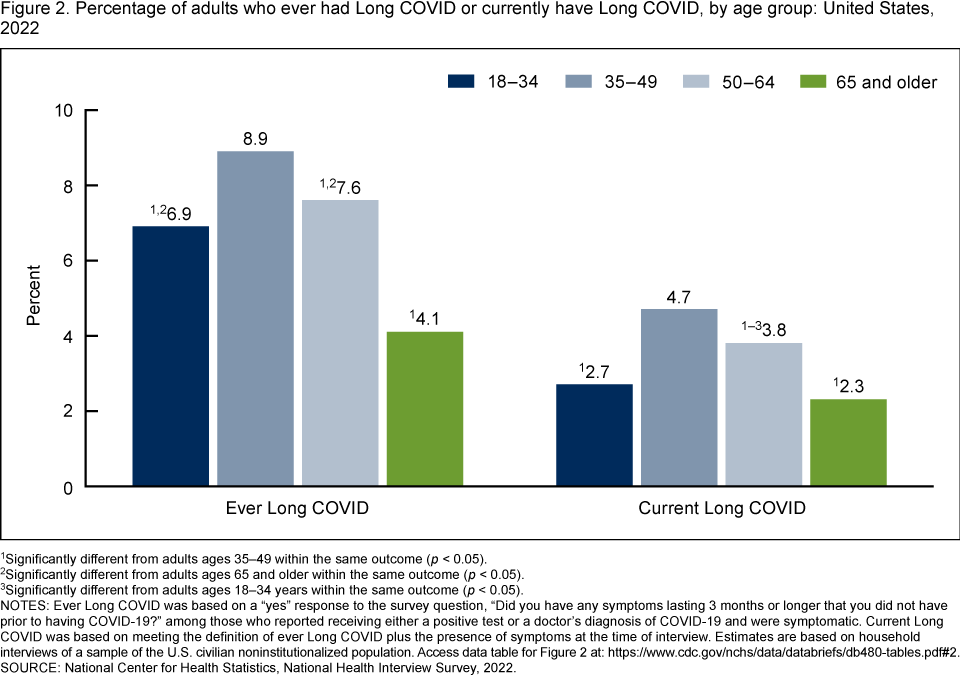
- Adults ages 35–49 (8.9%) were more likely than adults ages 18–34 (6.9%), 50–64 (7.6%), and 65 and older (4.1%) to ever have Long COVID (Figure 2). Adults ages 65 and older were the least likely to ever have Long COVID.
- Adults ages 35–49 (4.7%) were more likely than those ages 18–34 (2.7%), 50–64 (3.8%), and 65 and older (2.3%) to currently have Long COVID. Adults ages 50–64 were also more likely than those ages 18–34 and 65 and older to currently have Long COVID.
Figure 2. Percentage of adults who ever had Long COVID or currently have Long COVID, by age group: United States, 2022
1Significantly different from adults ages 35–49 within the same outcome (p < 0.05).
2Significantly different from adults ages 65 and older within the same outcome (p < 0.05).
3Significantly different from adults ages 18–34 years within the same outcome (p < 0.05).
NOTES: Ever Long COVID was based on a “yes” response to the survey question, “Did you have any symptoms lasting 3 months or longer that you did not have prior to having COVID-19?” among those who reported receiving either a positive test or a doctor’s diagnosis of COVID-19 and were symptomatic. Current Long COVID was based on meeting the definition of ever Long COVID plus the presence of symptoms at the time of interview. Estimates are based on household interviews of a sample of the U.S. civilian noninstitutionalized population. Access data table for Figure 2.
SOURCE: National Center for Health Statistics, National Health Interview Survey, 2022.
Did the percentage of adults who ever had Long COVID or who currently have Long COVID differ by race and Hispanic origin?
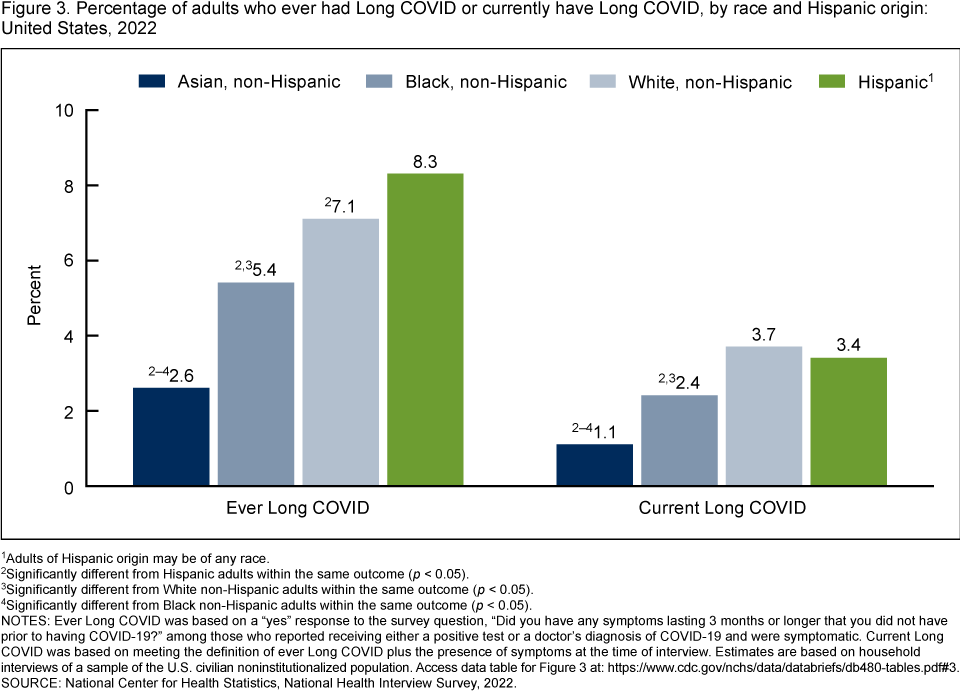
- In 2022, Asian non-Hispanic adults (subsequently, Asian) (2.6%) were less likely than Black non-Hispanic (subsequently, Black) (5.4%), White non-Hispanic (subsequently, White) (7.1%), and Hispanic (8.3%) adults to ever have Long COVID (Figure 3). Black adults were less likely than White adults to ever have Long COVID. Black and White adults were also less likely than Hispanic adults to ever have Long COVID.
- Asian adults (1.1%) were less likely than Black (2.4%), White (3.7%), and Hispanic (3.4%) adults to currently have Long COVID. Black adults were less likely than White and Hispanic adults to currently have Long COVID.
Figure 3. Percentage of adults who ever had Long COVID or currently have Long COVID, by race and Hispanic origin: United States, 2022
1Adults of Hispanic origin may be of any race.
2Significantly different from Hispanic adults within the same outcome (p < 0.05).
3Significantly different from White non-Hispanic adults within the same outcome (p < 0.05).
4Significantly different from Black non-Hispanic adults within the same outcome (p < 0.05).
NOTES: Ever Long COVID was based on a “yes” response to the survey question, “Did you have any symptoms lasting 3 months or longer that you did not have prior to having COVID-19?” among those who reported receiving either a positive test or a doctor’s diagnosis of COVID-19 and were symptomatic. Current Long COVID was based on meeting the definition of ever Long COVID plus the presence of symptoms at the time of interview. Estimates are based on household interviews of a sample of the U.S. civilian noninstitutionalized population. Access data table for Figure 3.
SOURCE: National Center for Health Statistics, National Health Interview Survey, 2022.
Did the percentage of adults who ever had Long COVID or who currently have Long COVID differ by family income as a percentage of the federal poverty level?
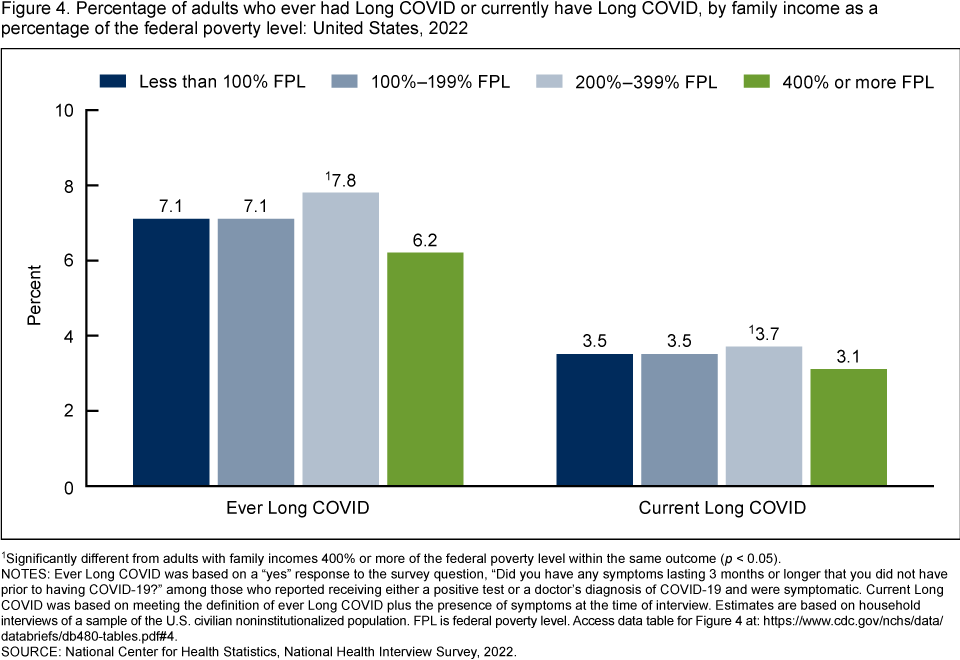
- Adults with family incomes at 400% or more of the federal poverty level (6.2% and 3.1%, respectively) were less likely than those with family incomes from 200% through 399% of the federal poverty level (7.8% and 3.7%, respectively) to ever have or currently have Long COVID (Figure 4). Ever or current Long COVID was similar among the other family income categories.
Figure 4. Percentage of adults who ever had Long COVID or currently have Long COVID, by family income as a percentage of the federal poverty level: United States, 2022
1Significantly different from adults with family incomes 400% or more of the federal poverty level within the same outcome (p < 0.05).
NOTES: Ever Long COVID was based on a “yes” response to the survey question, “Did you have any symptoms lasting 3 months or longer that you did not have prior to having COVID-19?” among those who reported receiving either a positive test or a doctor’s diagnosis of COVID-19 and were symptomatic. Current Long COVID was based on meeting the definition of ever Long COVID plus the presence of symptoms at the time of interview. Estimates are based on household interviews of a sample of the U.S. civilian noninstitutionalized population. FPL is federal poverty level. Access data table for Figure 4.
SOURCE: National Center for Health Statistics, National Health Interview Survey, 2022.
Did the percentage of adults who ever had Long COVID or who currently have Long COVID differ by urbanization level?
- Adults living in nonmetropolitan (7.7%) and medium and small metropolitan areas (7.6%) were more likely than adults living in large central metropolitan areas (6.3%) to ever have Long COVID (Figure 5). While adults living in medium and small metropolitan and nonmetropolitan areas were more likely than those living in large fringe metropolitan areas to ever have Long COVID, the observed difference was not significant between nonmetropolitan and large fringe metropolitan areas.
- Adults living in nonmetropolitan (4.1%), medium and small metropolitan (3.9%), and large fringe metropolitan (3.3%) areas were more likely than adults living in large central metropolitan areas (2.6%) to currently have Long COVID.
Figure 5. Percentage of adults who ever had Long COVID or currently have Long COVID, by urbanization level: United States, 2022

1Significantly different from large central metropolitan within the same outcome (p < 0.05).
2Significantly different from large fringe metropolitan within the same outcome (p < 0.05).
NOTES: Ever Long COVID was based on a “yes” response to the survey question, “Did you have any symptoms lasting 3 months or longer that you did not have prior to having COVID-19?” among those who reported receiving either a positive test or a doctor’s diagnosis of COVID-19 and were symptomatic. Current Long COVID was based on meeting the definition of ever Long COVID plus the presence of symptoms at the time of interview. Estimates are based on household interviews of a sample of the U.S. civilian noninstitutionalized population. Access data table for Figure 5.
SOURCE: National Center for Health Statistics, National Health Interview Survey, 2022.
Summary
In 2022, 6.9% of adults ever had Long COVID and 3.4% of adults currently had Long COVID. For both outcomes, prevalence estimates were higher among women compared with men, adults ages 35–49 compared with other age groups, and adults living in more rural areas compared with those living in large central metropolitan areas. Prevalence estimates were lower among Asian adults compared with other racial and ethnic groups, and adults with family incomes of 400% or more of the federal poverty level compared with those with incomes from 200% through 399% of the federal poverty level.
Data from the Nationwide Blood Donor Seroprevalence Survey suggest that 77.5% of people ages 16 and older had antibodies indicating a previous COVID-19 infection as of December 2022 (3). Adults ages 65 and older and Asian adults were least likely to have antibodies for the virus that causes COVID-19.
Definitions
Family income as a percentage of the federal poverty level: Based on the federal poverty level, which was derived from the family’s income in the previous calendar year and family size using the U.S. Census Bureau’s poverty thresholds (4). Family income was imputed when missing (5).
Long COVID: Ever Long COVID was based on a “yes” response to the survey question, “Did you have any symptoms lasting 3 months or longer that you did not have prior to having COVID-19?” among those who reported receiving either a positive test or a doctor’s diagnosis of COVID-19 and were symptomatic. Current Long COVID was based on meeting the definition of ever Long COVID plus the presence of symptoms at the time of interview.
Race and Hispanic origin: Adults categorized as Hispanic may be of any race or combination of races. Adults categorized as non-Hispanic indicated one race only. Due to the inability to make statistically reliable estimates, estimates for non-Hispanic adults of races other than Asian, Black, and White are not shown but are included in the total estimates.
Urbanization level: Counties were classified according to their metropolitan status using the National Center for Health Statistics Urban–Rural Classification Scheme (6). Large central metropolitan areas include counties containing the area’s major city (inner cities). Large fringe metropolitan areas include counties surrounding large central counties. Medium and small metropolitan areas include medium and small metropolitan counties. Nonmetropolitan areas include micropolitan statistical areas and noncore areas.
Data source and methods
Data from the 2022 National Health Interview Survey Sample Adult interview (n = 27,651) were used for this analysis. The National Health Interview Survey is a nationally representative household survey of the U.S. civilian noninstitutionalized population. It is conducted continuously throughout the year by the National Center for Health Statistics. Interviews are typically conducted in respondents’ homes, but follow-ups to complete interviews may be conducted over the telephone. Due to the COVID-19 pandemic, data collection procedures were disrupted, and during 2022, 55.7% of Sample Adult interviews were conducted at least partially by telephone (7). For more information about the National Health Interview Survey, visit https://www.cdc.gov/nchs/nhis.htm.
Point estimates and corresponding confidence intervals for this analysis were calculated using SAS-callable SUDAAN software (8) to account for the complex sample design of the National Health Interview Survey. All estimates are based on self-report and meet National Center for Health Statistics data presentation standards for proportions (9). Differences between percentages were evaluated using two-sided significance tests at the 0.05 level.
About the authors
Dzifa Adjaye-Gbewonyo and Anjel Vahratian are with the National Center for Health Statistics, Division of Health Interview Statistics. Cria Perrine is with the National Center for Immunization and Respiratory Diseases, Coronavirus and Other Respiratory Viruses Division. Jeanne Bertolli is with the National Center for Emerging and Zoonotic Infectious Diseases, Division of High-Consequence Pathogens and Pathology.
References
- Department of Health and Human Services, Office of the Assistant Secretary for Health. National research action plan on Long COVID. 2022.
- Katz GM, Bach K, Bobos P, Cheung A, Décary S, Goulding S, et al. Understanding how post-COVID-19 condition affects adults and health care systems. JAMA Health Forum 4(7):e231933. 2023. DOI: https://dx.doi.org/10.1001/jamahealthforum.2023.1933.
- Centers for Disease Control and Prevention. COVID data tracker. 2023.
- U.S. Census Bureau. Poverty thresholds. 2021.
- National Center for Health Statistics. Multiple imputation of family income in 2022 National Health Interview Survey: Methods. 2023.
- Ingram DD, Franco SJ. 2013 NCHS urban–rural classification scheme for counties. National Center for Health Statistics. Vital Health Stat 2(166). 2014.
- National Center for Health Statistics. National Health Interview Survey, 2022 survey description. 2023.
- RTI International. SUDAAN (Release 11.0.3) [computer software]. 2018.
- Parker JD, Talih M, Malec DJ, Beresovsky V, Carroll M, Gonzalez JF Jr, et al. National Center for Health Statistics data presentation standards for proportions. National Center for Health Statistics. Vital Health Stat 2(175). 2017.
Suggested citation
Adjaye-Gbewonyo D, Vahratian A, Perrine CG, Bertolli J. Long COVID in adults: United States, 2022. NCHS Data Brief, no 480. Hyattsville, MD: National Center for Health Statistics. 2023. DOI: https://dx.doi.org/10.15620/cdc:132417.
Copyright information
All material appearing in this report is in the public domain and may be reproduced or copied without permission; citation as to source, however, is appreciated.
National Center for Health Statistics
Brian C. Moyer, Ph.D., Director
Amy M. Branum, Ph.D., Associate Director for Science
Division of Health Interview Statistics
Stephen J. Blumberg, Ph.D., Director
Anjel Vahratian, Ph.D., M.P.H., Associate Director for Science