Long COVID in Children: United States, 2022
- Key findings
- What percentage of children ever had Long COVID or currently have Long COVID, and did it differ by sex?
- Did the percentage of children who ever had Long COVID or who currently have Long COVID differ by age?
- Did the percentage of children who ever had Long COVID or who currently have Long COVID differ by race and Hispanic origin?
- Summary
Data from the National Health Interview Survey
-
In 2022, 1.3% of children ever had Long COVID, and 0.5% of children had Long COVID at the time of interview (currently have Long COVID). Girls (1.6%) were more likely than boys (0.9%) to ever have Long COVID.
-
Children ages 12–17 years were more likely than those ages 0–5 years and 6–11 years to ever have or currently have Long COVID.
-
Hispanic children (1.9%) were more likely than Asian non-Hispanic (0.2%) and Black non-Hispanic children (0.6%) to ever have Long COVID.
While most individuals who contract COVID-19 feel better within a few weeks, others have new, returning, or ongoing symptoms that they did not have before COVID-19, which is often referred to as Long COVID (1). This report describes the percentage of children ages 0–17 years who ever had Long COVID or had Long COVID at the time of interview (currently have Long COVID) based on parent-reported data from the 2022 National Health Interview Survey (NHIS). Long COVID was defined as the presence of symptoms for at least 3 months after having COVID-19 among those who received either a positive test or a doctor’s diagnosis of COVID-19.
Keywords: Adolescents, post-acute COVID-19 syndrome, prevalence, National Health Interview Survey (NHIS)
What percentage of children ever had Long COVID or currently have Long COVID, and did it differ by sex?
-
In 2022, 1.3% of U.S. children ever had Long COVID, and 0.5% of children currently had Long COVID (Figure 1). Girls (1.6%) were more likely than boys (0.9%) to have ever had Long COVID. While the percentage of girls who currently have Long COVID (0.6%) was higher than that of boys (0.3%), this difference was not significant.
Figure 1. Percentage of children who ever had Long COVID or currently have Long COVID, by sex: United States, 2022
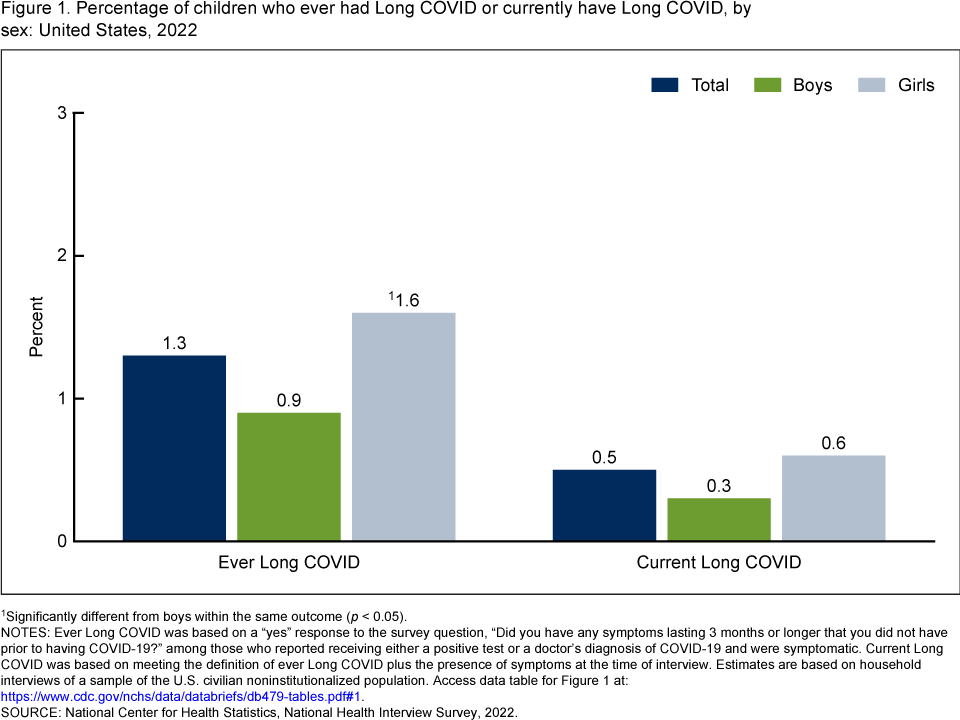
1Significantly different from boys within the same outcome (p < 0.05).
NOTES: Ever Long COVID was based on a “yes” response to the survey question, “Did you have any symptoms lasting 3 months or longer that you did not have prior to having COVID-19?” among those who reported receiving either a positive test or a doctor’s diagnosis of COVID-19 and were symptomatic. Current Long COVID was based on meeting the definition of ever Long COVID plus the presence of symptoms at the time of interview. Estimates are based on household interviews of a sample of the U.S. civilian noninstitutionalized population. Access data table for Figure 1.
SOURCE: National Center for Health Statistics, National Health Interview Survey, 2022.
Did the percentage of children who ever had Long COVID or who currently have Long COVID differ by age?
-
Children ages 12–17 years (2.0%) were more likely than those ages 0–5 years (1.0%) and those ages 6–11 years (0.8%) to ever have Long COVID (Figure 2). Similar patterns occurred for current Long COVID (0.8% for those 12–17 years compared with 0.2% for those 0–5 years and 0.3% for those 6–11 years).
Figure 2. Percentage of children who ever had Long COVID or currently have Long COVID, by age group: United States, 2022
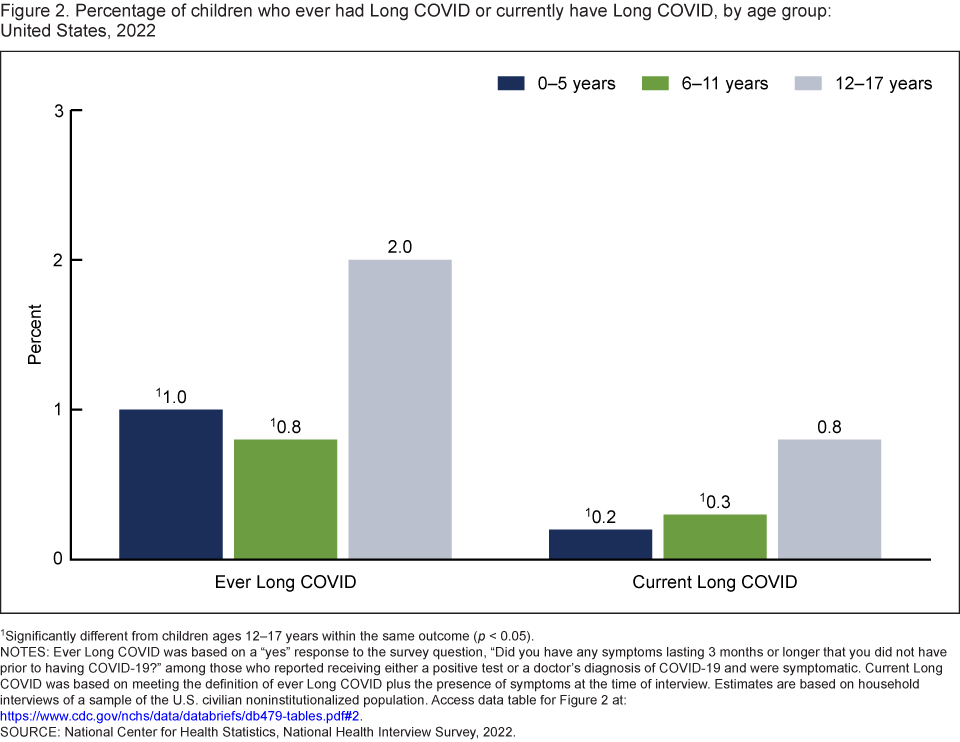
1Significantly different from children ages 12–17 years within the same outcome (p < 0.05).
NOTES: Ever Long COVID was based on a “yes” response to the survey question, “Did you have any symptoms lasting 3 months or longer that you did not have prior to having COVID-19?” among those who reported receiving either a positive test or a doctor’s diagnosis of COVID-19 and were symptomatic. Current Long COVID was based on meeting the definition of ever Long COVID plus the presence of symptoms at the time of interview. Estimates are based on household interviews of a sample of the U.S. civilian noninstitutionalized population. Access data table for Figure 2.
SOURCE: National Center for Health Statistics, National Health Interview Survey, 2022.
Did the percentage of children who ever had Long COVID or who currently have Long COVID differ by race and Hispanic origin?
- Asian non-Hispanic children (subsequently, Asian) (0.2%) and Black non-Hispanic children (subsequently, Black) (0.6%) were less likely than Hispanic children (1.9%) to ever have Long COVID (Figure 3). Asian children were also less likely than White non-Hispanic children (subsequently White) (1.2%) to ever have Long COVID. All other observed differences between Black, White, and Hispanic children were not significant.
- Black children (0.1%) were less likely than White children (0.6%) to currently have Long COVID. The observed difference between Black and Hispanic children was not significant.
Figure 3. Percentage of children who ever had Long COVID or currently have Long COVID, by race and Hispanic origin: United States, 2022
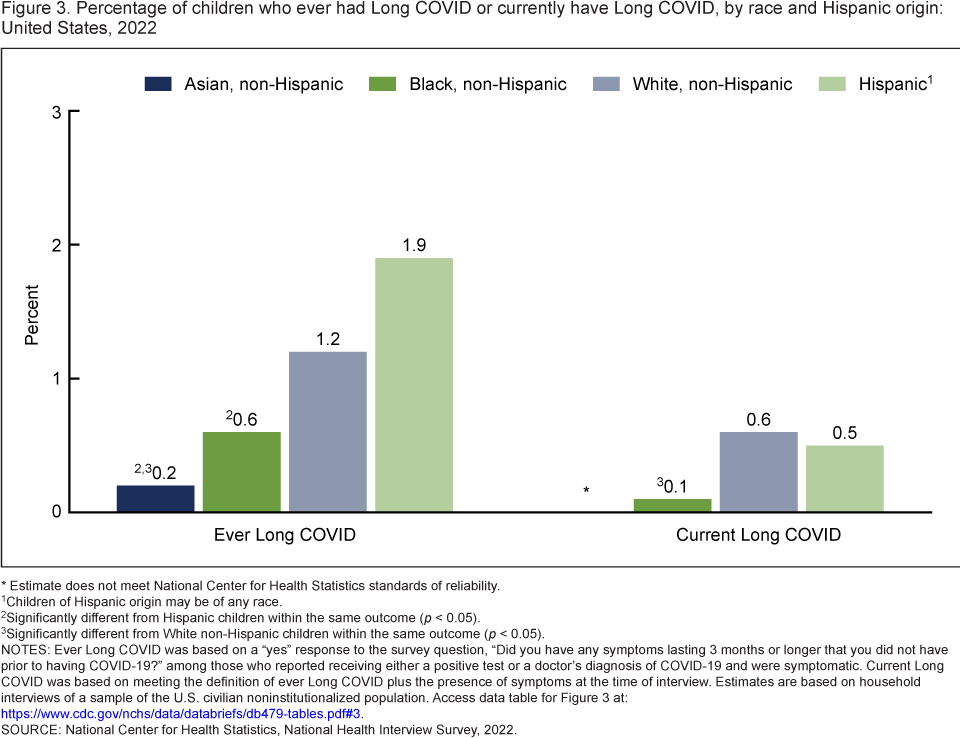
* Estimate does not meet National Center for Health Statistics standards of reliability.
1Children of Hispanic origin may be of any race.
2Significantly different from Hispanic children within the same outcome (p < 0.05).
3Significantly different from White non-Hispanic children within the same outcome (p < 0.05).
NOTES: Ever Long COVID was based on a “yes” response to the survey question, “Did you have any symptoms lasting 3 months or longer that you did not have prior to having COVID-19?” among those who reported receiving either a positive test or a doctor’s diagnosis of COVID-19 and were symptomatic. Current Long COVID was based on meeting the definition of ever Long COVID plus the presence of symptoms at the time of interview. Estimates are based on household interviews of a sample of the U.S. civilian noninstitutionalized population. Access data table for Figure 3.
SOURCE: National Center for Health Statistics, National Health Interview Survey, 2022.
Summary
In 2022, 1.3% of children ever had Long COVID and 0.5% currently had Long COVID. Ever having Long COVID was higher in girls than boys, older compared with younger children, and Hispanic compared with Asian or Black children. While the percentage of children who currently have Long COVID was low, the differences observed by age persisted.
Data from the Nationwide Commercial Laboratory Seroprevalence Survey show that, as of December 2022, 91.9% of children had antibodies indicating a previous COVID-19 infection (2). Estimates by age group ranged from 86.8% in children ages 0–4 years to 93.5% in those ages 5–11 years, and 93.0% in those ages 12–17 years. Estimates were similar in girls (92.3%) and boys (91.5%), but these estimates may not be representative of all U.S. children. While more than 90% of children ages 0–17 years have been exposed to COVID-19, Long COVID remains rare, especially in children younger than 12 years.
Definitions
Long COVID: Ever Long COVID was based on a “yes” response to the survey question, “Did you have any symptoms lasting 3 months or longer that you did not have prior to having COVID-19?” among those who reported receiving either a positive test or a doctor’s diagnosis of COVID-19 and were symptomatic. Current Long COVID was based on meeting the definition of ever Long COVID plus the presence of symptoms at the time of interview.
Race and Hispanic origin: Children categorized as non-Hispanic indicated one race only; respondents had the option to select more than one racial group. Children categorized as Hispanic could be any race or combination of races. Estimates for non-Hispanic children of races other than Asian, Black, and White are not shown due to the inability to make statistically reliable estimates for these groups, but they are included in total estimates.
Data source and methods
Data from the 2022 National Health Interview Survey Sample Child interview (n = 7,464) were used for this analysis. The National Health Interview Survey is a nationally representative household survey of the U.S. civilian noninstitutionalized population. It is conducted continuously throughout the year by the National Center for Health Statistics. Interviews are typically conducted in respondents’ homes, but follow-ups to complete interviews may be conducted over the telephone. Due to the COVID-19 pandemic, data collection procedures were disrupted, and during 2022, 56.1% of Sample Child interviews were conducted at least partially by telephone (3). For more information about the National Health Interview Survey, visit:
https://www.cdc.gov/nchs/nhis.htm.
Point estimates and the corresponding confidence intervals were calculated using SAS-callable SUDAAN software (4) to account for the complex sample design of the National Health Interview Survey. All estimates are based on parent or guardian report and meet National Center for Health Statistics data presentation standards for proportions (5). Differences between percentages were evaluated using two-sided significance tests at the 0.05 level.
About the authors
Anjel Vahratian and Dzifa Adjaye-Gbewonyo are with the National Center for Health Statistics, Division of Health Interview Statistics. Jin-Mann S. Lin is with the National Center for Emerging and Zoonotic Infectious Diseases, Division of High-Consequence Pathogens and Pathology. Sharon Saydah is with the National Center for Immunization and Respiratory Diseases, Coronaviruses and Other Respiratory Viruses Division.
References
- Department of Health and Human Services, Office of the Assistant Secretary for Health. National research action plan on Long COVID. 2022.
- Centers for Disease Control and Prevention. COVID data tracker. 2023.
- National Center for Health Statistics. National Health Interview Survey, 2022 survey description. 2023.
- RTI International. SUDAAN (Release 11.0.3) [computer software]. 2018.
- Parker JD, Talih M, Malec DJ, Beresovsky V, Carroll M, Gonzalez JF Jr, et al. National Center for Health Statistics data presentation standards for proportions. National Center for Health Statistics. Vital Health Stat 2(175). 2017.
Suggested citation
Vahratian A, Adjaye-Gbewonyo D, Lin JS, Saydah S. Long COVID in children: United States, 2022. NCHS Data Brief, no 479. Hyattsville, MD: National Center for Health Statistics. 2023. DOI: https://dx.doi.org/10.15620/cdc:132416.
Copyright information
All material appearing in this report is in the public domain and may be reproduced or copied without permission; citation as to source, however, is appreciated.
National Center for Health Statistics
Brian C. Moyer, Ph.D., Director
Amy M. Branum, Ph.D., Associate Director for Science
Division of Health Interview Statistics
Stephen J. Blumberg, Ph.D., Director
Anjel Vahratian, Ph.D., M.P.H., Associate Director for Science