Activity-limiting Injury in Adults: United States, 2020−2021
- Key findings
- What percentage of adults had an activity-limiting injury in the past 3 months, and did it vary by sex and age?
- Did the percentage of adults who had an activity-limiting injury in the past 3 months vary by race and Hispanic origin?
- Did the percentage of adults who had an activity-limiting injury in the past 3 months vary by family income and education level?
- Did the percentage of adults who had an activity-limiting injury in the past 3 months vary by region and urbanization level?
- Summary
Data from the National Health Interview Survey
- In 2020−2021, about 6% of U.S. adults had an activity-limiting injury in the past 3 months.
- White non-Hispanic adults were most likely to have had an activity-limiting injury (6.6%), followed by Black non-Hispanic (4.9%), Hispanic (4.6%), and Asian non-Hispanic (3.2%) adults.
- The percentage of adults who had an activity-limiting injury in the past 3 months was higher among adults with some college (6.1%) and a college degree or higher (6.3%) than among adults with less than a high school diploma or GED (5.1%).
- The percentage of adults who had an activity-limiting injury in the past 3 months varied by region and urbanization level.
Injuries can have physical (1), psychological (2,3), and economic (4) consequences, including problems with wound repair and persistent pain. Additionally, the consequences of injury may interfere with normal activities and return to work (1). This report describes the percentage of adults who had an injury that limited their usual activities in the past 3 months (an activity-limiting injury) by selected sociodemographic characteristics from the 2020 and 2021 National Health Interview Survey (NHIS).
Keywords: nonfatal injury, mobility-restricting injury, National Health Interview Survey
What percentage of adults had an activity-limiting injury in the past 3 months, and did it vary by sex and age?
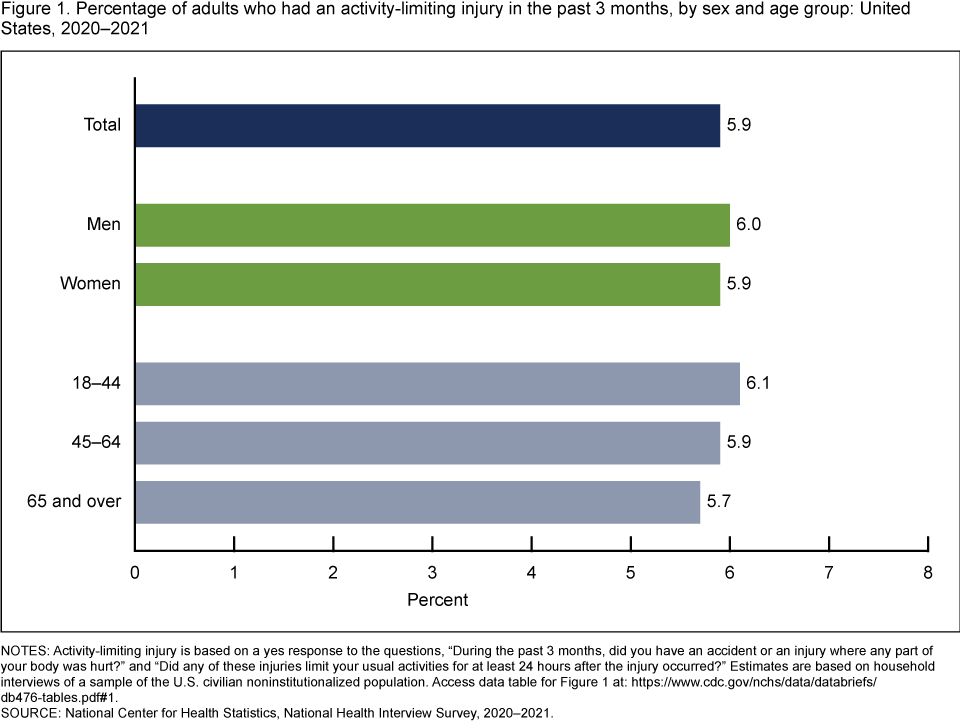
- In 2020−2021, about 6% of adults had an activity-limiting injury in the past 3 months (Figure 1).
- The percentage of adults who had an activity-limiting injury was similar between men (6.0%) and women (5.9%).
- The percentage who had an activity-limiting injury was 6.1% among adults aged 18−44, 5.9% among adults aged 45−64, and 5.7% among adults aged 65 and over. The observed decreasing trend by age was not significant.
Figure 1. Percentage of adults who had an activity-limiting injury in the past 3 months, by sex and age group: United States, 2020–2021
NOTES: Activity-limiting injury is based on a yes response to the questions, “During the past 3 months, did you have an accident or an injury where any part of your body was hurt?” and “Did any of these injuries limit your usual activities for at least 24 hours after the injury occurred?” Estimates are based on household interviews of a sample of the U.S. civilian noninstitutionalized population. Access data table for Figure 1.
SOURCE: National Center for Health Statistics, National Health Interview Survey, 2020–2021.
Did the percentage of adults who had an activity-limiting injury in the past 3 months vary by race and Hispanic origin?
-
The percentage of adults who had an activity-limiting injury in the past 3 months in 2020−2021 was highest among White non-Hispanic (subsequently, White) adults (6.6%), followed by Black non-Hispanic (subsequently, Black) (4.9%) and Hispanic (4.6%) adults, and was lowest among Asian non-Hispanic (subsequently, Asian) adults (3.2%) (Figure 2).
Figure 2. Percentage of adults who had an activity-limiting injury in the past 3 months, by race and Hispanic origin: United States, 2020–2021
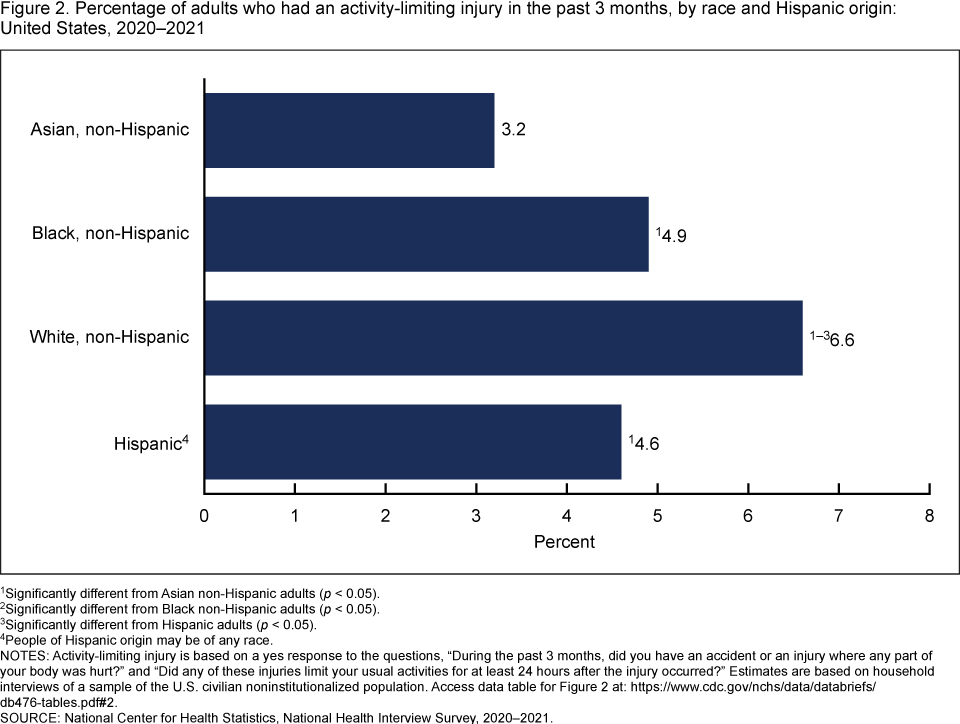
1Significantly different from Asian non-Hispanic adults (p < 0.05).
2Significantly different from Black non-Hispanic adults (p < 0.05).
3Significantly different from Hispanic adults (p < 0.05).
4People of Hispanic origin may be of any race.
NOTES: Activity-limiting injury is based on a yes response to the questions, “During the past 3 months, did you have an accident or an injury where any part of your body was hurt?” and “Did any of these injuries limit your usual activities for at least 24 hours after the injury occurred?” Estimates are based on household interviews of a sample of the U.S. civilian noninstitutionalized population. Access data table for Figure 2.
SOURCE: National Center for Health Statistics, National Health Interview Survey, 2020–2021.
Did the percentage of adults who had an activity-limiting injury in the past 3 months vary by family income and education level?
- In 2020−2021, the percentage of adults who had an activity-limiting injury in the past 3 months did not vary by family income as a percentage of the federal poverty level (Figure 3).
- Adults with some college (6.1%) and a college degree or higher (6.3%) were more likely to have had an activity-limiting injury than adults with less than a high school diploma or GED (5.1%). All other observed differences by education level were not significant.
Figure 3. Percentage of adults who had an activity-limiting injury in the past 3 months, by family income and education level: United States, 2020–2021
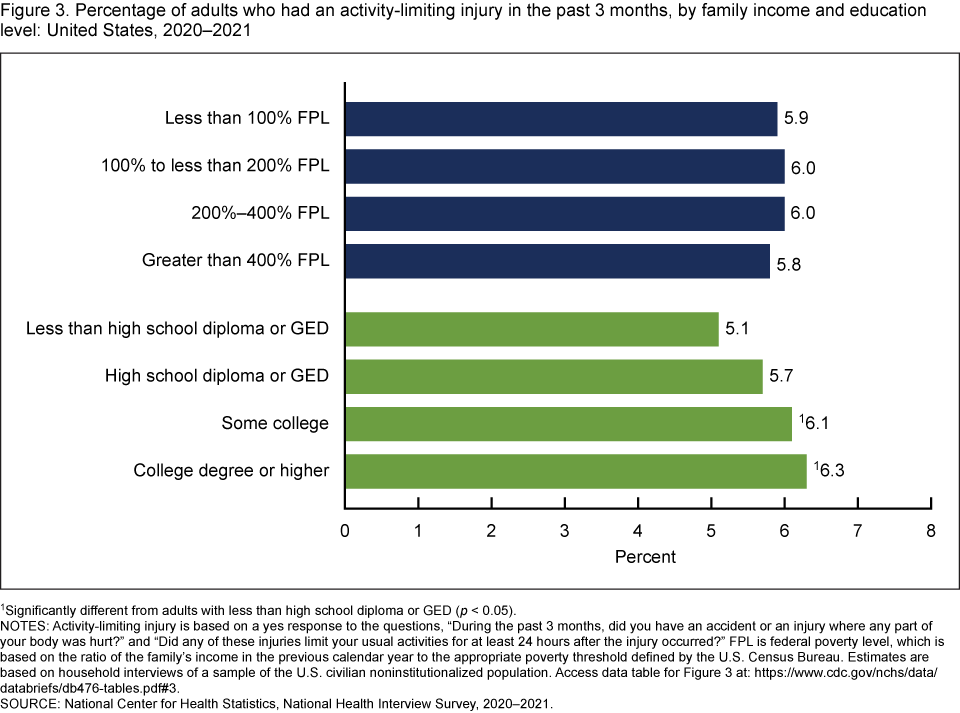
1Significantly different from adults with less than high school diploma or GED (p < 0.05).
NOTES: Activity-limiting injury is based on a yes response to the questions, “During the past 3 months, did you have an accident or an injury where any part of your body was hurt?” and “Did any of these injuries limit your usual activities for at least 24 hours after the injury occurred?” FPL is federal poverty level, which is based on the ratio of the family’s income in the previous calendar year to the appropriate poverty threshold defined by the U.S. Census Bureau. Estimates are based on household interviews of a sample of the U.S. civilian noninstitutionalized population. Access data table for Figure 3.
SOURCE: National Center for Health Statistics, National Health Interview Survey, 2020–2021.
Did the percentage of adults who had an activity-limiting injury in the past 3 months vary by region and urbanization level?
-
Adults living in the Midwest (6.1%) and West (6.4%) regions were more likely to have had an activity-limiting injury in the past 3 months than those living in the Northeast (5.3%) region (Figure 4). All other observed differences by region were not significant.
-
The percentage of adults who had an activity-limiting injury was higher among adults living in medium and small metropolitan (6.4%) and nonmetropolitan (6.5%) areas than among those living in large central metropolitan areas (5.3%). The observed difference between large central metropolitan areas and large fringe metropolitan areas (5.9%) was not significant.
Figure 4. Percentage of adults who had an activity-limiting injury in the past 3 months, by region and urbanization level: United States, 2020–2021
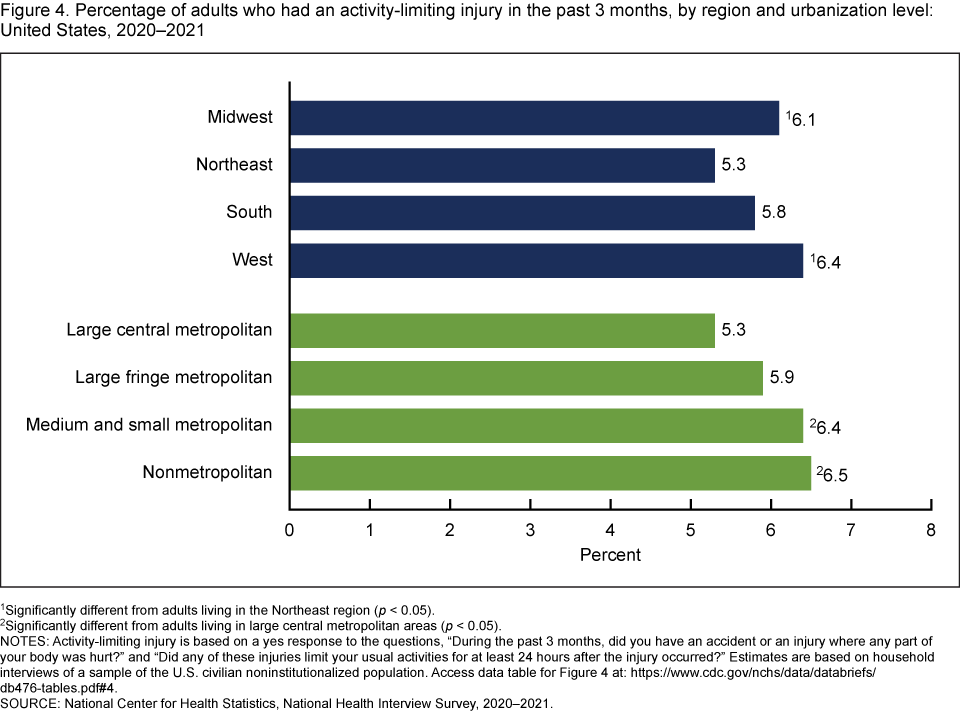
1Significantly different from adults living in the Northeast region (p < 0.05).
2Significantly different from adults living in large central metropolitan areas (p < 0.05).
NOTES: Activity-limiting injury is based on a yes response to the questions, “During the past 3 months, did you have an accident or an injury where any part of your body was hurt?” and “Did any of these injuries limit your usual activities for at least 24 hours after the injury occurred?” Estimates are based on household interviews of a sample of the U.S. civilian noninstitutionalized population. Access data table for Figure 4.
SOURCE: National Center for Health Statistics, National Health Interview Survey, 2020–2021.
Summary
In 2020−2021, 5.9% of all adults had an injury that limited their usual activities for at least 24 hours. White adults were more likely to have had an activity-limiting injury (6.6%) compared with Black (4.9%), Hispanic (4.6%), and Asian (3.2%) adults. Adults with some college (6.1%) or higher (6.3%) education were more likely to have had an injury that limited their usual activities than adults with less than a high school diploma or GED (5.1%). Additionally, adults living in medium and small metropolitan (6.4%) and nonmetropolitan (6.5%) areas were more likely to have had an activity-limiting injury than adults living in large central metropolitan areas (5.3%). No statistically significant differences were observed in the percentage of adults with an activity-limiting injury by sex, age, and family income. Previously, many epidemiological studies of injury focused on specific populations, activities, and outcomes (5,6). Using nationally representative data, this report provides the overall prevalence of activity-limiting injury in adults in the United States.
Definitions
Activity-limiting injury: Estimates are based on responses to the questions, “During the past 3 months, did you have an accident or an injury where any part of your body was hurt?” and “Did any of these injuries limit your usual activities for at least 24 hours after the injury occurred?” A response of yes to both questions was considered as having an activity-limiting injury in the past 3 months.
Family income as a percentage of family poverty level: Estimates are based on the federal poverty level, which was derived from family income and family size using the U.S. Census Bureau’s poverty thresholds for the previous calendar year (7). The 2020 and 2021 NHIS imputed income files were used to create the poverty levels (8,9).
Race and Hispanic origin: Adults categorized as Hispanic may be of any race or combination of races. Adults categorized as Asian, Black, or White indicated one race only. Other and multiple races (includes those who did not identify as White, Black, Asian, or Hispanic, or who identified as more than one race) are not shown. Results were limited to the race and Hispanic-origin groups for which statistically reliable estimates could be shown.
Region: Based on the geographic classification of the U.S. population, states are grouped into four regions that are used by the U.S. Census Bureau:
-
Midwest: Illinois, Indiana, Iowa, Kansas, Michigan, Minnesota, Missouri, Nebraska, North Dakota, Ohio, South Dakota, and Wisconsin
-
Northeast: Connecticut, Maine, Massachusetts, New Hampshire, New Jersey, New York, Pennsylvania, Rhode Island, and Vermont
-
South: Alabama, Arkansas, Delaware, District of Columbia, Florida, Georgia, Kentucky, Louisiana, Maryland, Mississippi, North Carolina, Oklahoma, South Carolina, Tennessee, Texas, Virginia, and West Virginia
-
West: Alaska, Arizona, California, Colorado, Hawaii, Idaho, Montana, Nevada, New Mexico, Oregon, Utah, Washington, and Wyoming
Urbanization level: Categorized by collapsing the 2013 National Center for Health Statistics Urban–Rural Classification Scheme for counties (10) into four categories: large central metropolitan, large fringe metropolitan, medium and small metropolitan counties, and nonmetropolitan (counties in micropolitan statistical areas and nonmetropolitan counties).
Data source and methods
Data from the 2020−2021 NHIS were used for this analysis. NHIS is a nationally representative household survey of the U.S. civilian noninstitutionalized population. It is conducted continuously throughout the year by the National Center for Health Statistics. Interviews are typically conducted in a respondent’s home, but follow-ups to complete interviews may be conducted over the telephone. Because of the COVID-19 pandemic, data collection procedures in 2020 and 2021 were disrupted. NHIS data collection switched to a telephone-only mode beginning on March 19, 2020. Personal visits to households resumed in selected areas in July 2020 and in all areas of the country in September 2020. However, interviews were still attempted by telephone first, and most were completed by telephone. The “telephone first” data collection approach that began in July 2020 continued through April 2021.
Starting in May 2021, interviewers were instructed to return to regular survey interviewing procedures, where first contact attempts to households were made in person, with follow-up allowed by telephone. Interviewers were given flexibility to continue using telephone-first contact attempts based on local COVID-19 conditions. In 2020 and 2021, the percentage of sample adult interviews that were completed at least partially by telephone was 70.7% and 62.8%, respectively (11,12). For more information about NHIS, visit: https://www.cdc.gov/nchs/nhis.
Point estimates and their corresponding variances were calculated using SAS-callable SUDAAN software (13) to account for the complex sample design of NHIS. All estimates in this report met National Center for Health Statistics standards of reliability as specified in “National Center for Health Statistics Data Presentation Standards for Proportions” (14). Tests for trend were evaluated using orthogonal polynomials in logistic regression. Differences between percentages were evaluated using two-sided significance tests at the 0.05 level.
About the authors
Amy E. Cha and Xun Wang are with the National Center for Health Statistics, Division of Health Interview Statistics.
References
- Clay FJ, Newstead SV, Watson WL, Ozanne-Smith J, Guy J, McClure RJ. Bio-psychosocial determinants of persistent pain 6 months after non-life-threatening acute orthopaedic trauma. J Pain 11(5):420−30. 2010.
- McCarthy ML, MacKenzie EJ, Edwin D, Bosse MJ, Castillo RC, Starr A, LEAP study group. Psychological distress associated with severe lower-limb injury. J Bone Joint Surg Am 85(9):1689−97. 2003.
- Nota SPFT, Bot AGJ, Ring D, Kloen P. Disability and depression after orthopaedic trauma. Injury 46(2):207−12. 2015.
- Peterson C, Miller GF, Barnett SBL, Florence C. Economic cost of injury—United States, 2019. MMWR Morb Mortal Wkly Rep 70(48):1655−9. 2021.
- Ni H, Barnes P, Hardy AM. Recreational injury and its relation to socioeconomic status among school aged children in the US. Inj Prev 8(1):60−5. 2002.
- Gu JK, Charles LE, Andrew ME, Ma CC, Hartley TA, Violanti JM, Burchfiel CM. Prevalence of work-site injuries and relationship between obesity and injury among U.S. workers: NHIS 2004−2012. J Safety Res 58:21−30. 2016.
- U.S. Census Bureau. Poverty thresholds.
- National Center for Health Statistics. Multiple imputation of family income in 2020 National Health Interview Survey: Methods. 2021.
- National Center for Health Statistics. Multiple imputation of family income in 2021 National Health Interview Survey: Methods. 2022.
- Ingram DD, Franco SJ. 2013 NCHS urban−rural classification scheme for counties. National Center for Health Statistics. Vital Health Stat 2(166). 2014.
- National Center for Health Statistics. National Health Interview Survey: 2020 survey description. 2021
- National Center for Health Statistics. National Health Interview Survey: 2021 survey description. 2022
- RTI International. SUDAAN (Release 11.0.3) [computer software]. 2018.
- Parker JD, Talih M, Malec DJ, Beresovsky B, Carroll M, Gonzalez JF Jr, et al. National Center for Health Statistics data presentation standards for proportions. National Center for Health Statistics. Vital Health Stat 2(175). 2017.
Suggested citation
Cha AE, Wang X. Activity-limiting injury in adults: United States, 2020−2021. NCHS Data Brief, no 476. Hyattsville, MD: National Center for Health Statistics. 2023. DOI: https://dx.doi.org/10.15620/cdc:130171.
Copyright information
All material appearing in this report is in the public domain and may be reproduced or copied without permission; citation as to source, however, is appreciated.
National Center for Health Statistics
Brian C. Moyer, Ph.D., Director
Amy M. Branum, Ph.D., Associate Director for Science
Division of Health Interview Statistics
Stephen J. Blumberg, Ph.D., Director
Anjel Vahratian, Ph.D., M.P.H., Associate Director for Science