Diagnosed Developmental Disabilities in Children Aged 3–17 Years: United States, 2019–2021
- Key findings
- The prevalence of any developmental disability, including other developmental delay, increased from 2019 to 2021.
- The prevalence of any developmental disability varied by sex and race and Hispanic origin but not age group.
- The prevalence of intellectual disability varied by sex, age group, and race and Hispanic origin.
- The prevalence of autism spectrum disorder varied by sex and age group.
- The prevalence of developmental delay other than autism spectrum disorder or intellectual disability varied by sex, age group, and race and Hispanic origin.
Data from the National Health Interview Survey
- During 2019–2021, the prevalence of any diagnosed developmental disability in children aged 3–17 years increased from 7.40% to 8.56%.
- The prevalence of any developmental disability was lowest in non-Hispanic Asian children compared with other race and Hispanic-origin groups.
- The prevalence of intellectual disability increased with age, while the prevalence of other developmental delay decreased with age.
- Boys (4.66%) were more than three times as likely as girls (1.50%) to be diagnosed with autism spectrum disorder.
Developmental disabilities are common in children in the United States, and the prevalence has increased in recent years (1). Timely estimates are necessary to assess the adequacy of services and interventions that children with developmental disabilities typically need (2). This report provides updated prevalence estimates for diagnosed autism spectrum disorder, intellectual disability, and other developmental delay among children aged 3–17 years from the 2019–2021 National Health Interview Survey (NHIS), with differences in prevalence examined between years and by sex, age group, and race and Hispanic origin. Estimates are also presented for any developmental disability, defined as having had one or more of these three diagnoses.
Keywords: autism spectrum disorder, intellectual disability, other developmental delay, developmental disability, National Health Interview Survey (NHIS)
The prevalence of any developmental disability, including other developmental delay, increased from 2019 to 2021.
- During 2019–2021, the prevalence of any diagnosed developmental disability in children aged 3–17 years increased from 7.40% in 2019 to 8.56% in 2021 (Figure 1).
- No significant change in the prevalence of diagnosed intellectual disability was observed during 2019–2021 (1.70% in 2019, 2.20% in 2020, and 1.65% in 2021).
- No significant change in the prevalence of diagnosed autism spectrum disorder was observed during 2019–2021 (2.79% in 2019, 3.49% in 2020, and 3.05% in 2021).
- The prevalence of diagnosed other developmental delay increased from 5.08% in 2019 to 6.06% in 2021.
Figure 1. Prevalence of children aged 3–17 years ever diagnosed with selected developmental disabilities, by year: United States, 2019–2021
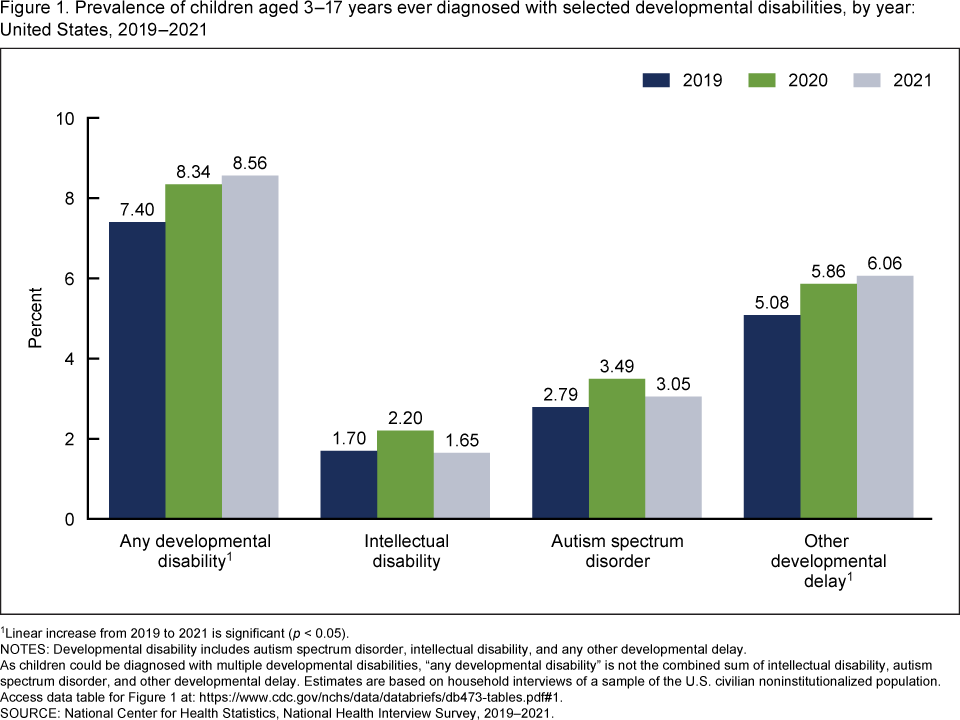
1Linear increase from 2019 to 2021 is significant (p < 0.05).
NOTES: Developmental disability includes autism spectrum disorder, intellectual disability, and any other developmental delay. As children could be diagnosed with multiple developmental disabilities, “any developmental disability” is not the combined sum of intellectual disability, autism spectrum disorder, and other developmental delay. Estimates are based on household interviews of a sample of the U.S. civilian noninstitutionalized population. Access data table for Figure 1.
SOURCE: National Center for Health Statistics, National Health Interview Survey, 2019–2021.
The prevalence of any developmental disability varied by sex and race and Hispanic origin but not age group.
- During 2019–2021, the prevalence of any developmental disability was higher in boys (10.76%) than girls (5.31%) (Figure 2).
- The prevalence of any developmental disability was similar across age groups: 8.42% in children aged 3–7, 8.05% in children aged 8–12, and 7.84% in children aged 13–17.
- Non-Hispanic Asian children (subsequently, Asian) (4.85%) were less likely to have any developmental disability compared with Hispanic (7.40%), non-Hispanic Black (subsequently, Black) (9.07%), and non-Hispanic White (subsequently, White) (8.42%) children.
- The observed differences in the prevalence of any developmental disability between Hispanic and Black children and Hispanic and White children were not significant.
Figure 2. Prevalence of children aged 3–17 years ever diagnosed with any developmental disability, by sex, age, and race and Hispanic origin: United States, 2019–2021

1Significantly different from girls (p < 0.05).
2Significantly different from Asian, non-Hispanic children (p < 0.05).
3Children of Hispanic origin may be of any race.
NOTES: Developmental disability includes autism spectrum disorder, intellectual disability, and any other developmental delay. Estimates are based on household interviews of a sample of the U.S. civilian noninstitutionalized population. Access data table for Figure 2.
SOURCE: National Center for Health Statistics, National Health Interview Survey, 2019–2021.
The prevalence of intellectual disability varied by sex, age group, and race and Hispanic origin.
- During 2019–2021, the prevalence of diagnosed intellectual disability was higher in boys (2.31%) than girls (1.37%) (Figure 3).
- The prevalence of intellectual disability increased with age, from 1.39% for children aged 3–7 years to 2.35% for children aged 13–17 years.
- Black children (2.82%) were more likely to be diagnosed with an intellectual disability than Hispanic (1.77%), White (1.76%), and Asian (0.72%) children.
- Compared with other race and Hispanic-origin groups, Asian children were the least likely to be diagnosed with an intellectual disability.
Figure 3. Prevalence of children aged 3–17 years ever diagnosed with intellectual disability, by sex, age, and race and Hispanic origin: United States, 2019–2021

1Significantly different from girls (p < 0.05).
2Significant linear trend by age group (p < 0.05).
3Significantly different from Asian, non-Hispanic children (p < 0.05).
4Significantly different from Black, non-Hispanic children (p < 0.05).
5Children of Hispanic origin may be of any race.
NOTES: Estimates are based on household interviews of a sample of the U.S. civilian noninstitutionalized population. Access data table for Figure 3.
SOURCE: National Center for Health Statistics, National Health Interview Survey, 2019–2021
The prevalence of autism spectrum disorder varied by sex and age group.
- During 2019–2021, the prevalence of autism spectrum disorder was higher in boys (4.66%) than girls (1.50%) (Figure 4).
- Children aged 3–7 years (2.62%) were less likely to have been diagnosed with autism spectrum disorder than children aged 8–12 years (3.36%) and 13–17 years (3.35%).
- While the prevalence of autism spectrum disorder was highest in Black children (3.56%), a significant difference was not observed between any of the race and Hispanic-origin groups.
Figure 4. Prevalence of children aged 3–17 years ever diagnosed with autism spectrum disorder, by sex, age, and race and Hispanic origin: United States, 2019–2021
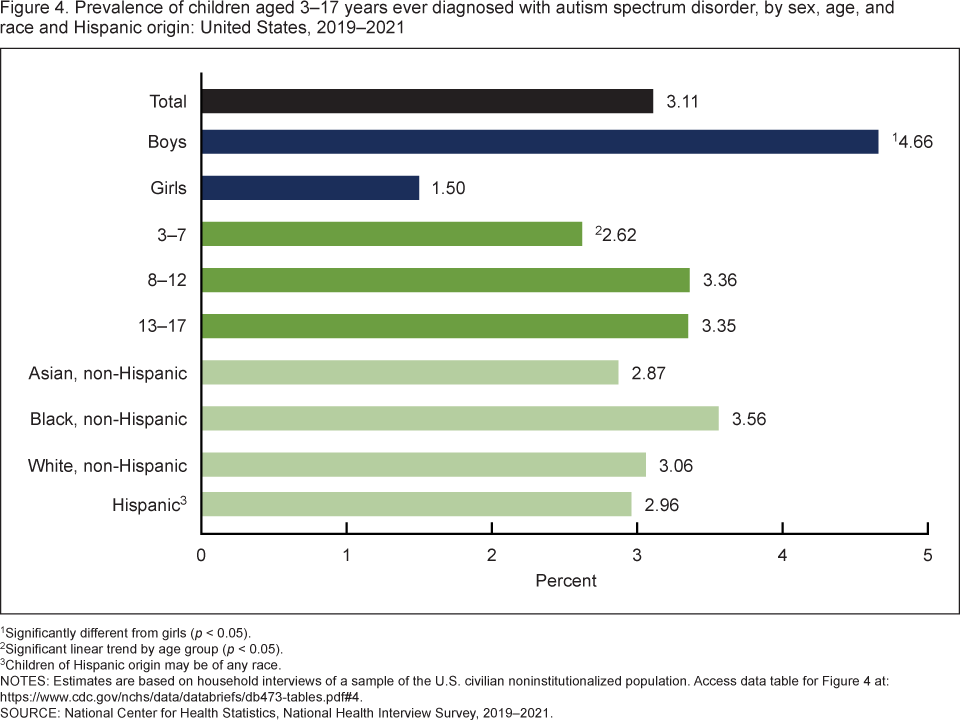
1Significantly different from girls (p < 0.05).
2Significant linear trend by age group (p < 0.05).
3Children of Hispanic origin may be of any race.
NOTES: Estimates are based on household interviews of a sample of the U.S. civilian noninstitutionalized population. Access data table for Figure 4.
SOURCE: National Center for Health Statistics, National Health Interview Survey, 2019–2021.
The prevalence of developmental delay other than autism spectrum disorder or intellectual disability varied by sex, age group, and race and Hispanic origin.
- During 2019–2021, the prevalence of any other developmental delay was higher in boys (7.31%) than girls (3.94%) (Figure 5).
- The prevalence of any other developmental delay decreased with age, from 6.58% for children aged 3–7 years to 4.89% for children aged 13–17 years.
- Asian children (2.53%) were less likely to have any other developmental delay compared with Hispanic (5.13%), Black (6.43%), and White (6.00%) children.
- The observed differences in the prevalence of any other developmental delay between Hispanic and Black children and Hispanic and White children were not significant.
Figure 5. Prevalence of children aged 3–17 years ever diagnosed with other developmental delay, by sex, age, and race and Hispanic origin: United States, 2019–2021
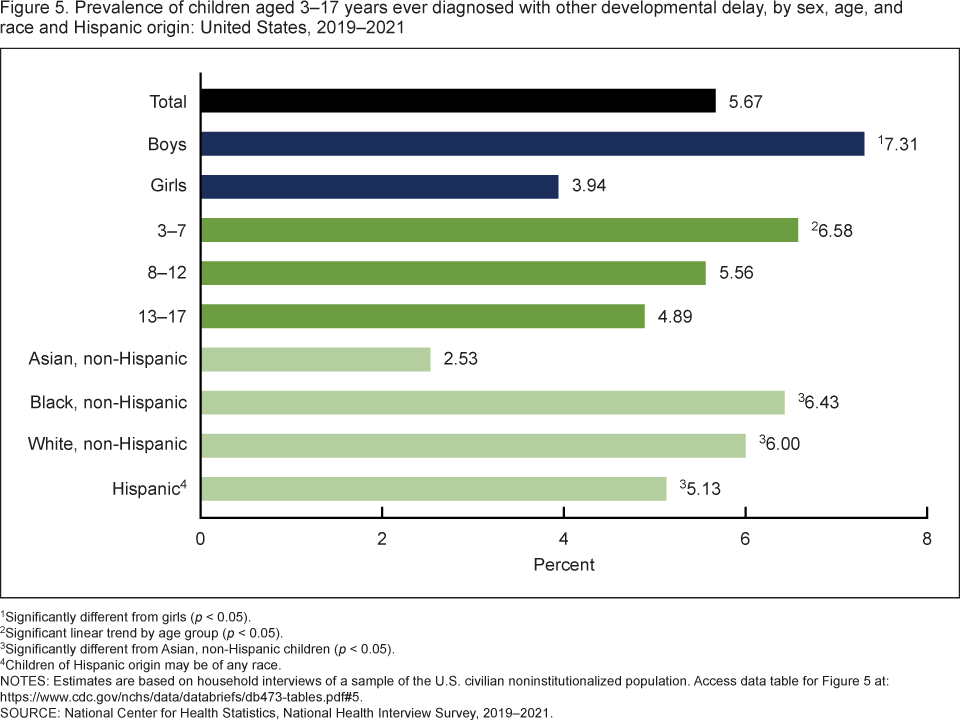
1Significantly different from girls (p < 0.05).
2Significant linear trend by age group (p < 0.05).
3Significantly different from Asian, non-Hispanic children (p < 0.05).
4Children of Hispanic origin may be of any race.
NOTES: Estimates are based on household interviews of a sample of the U.S. civilian noninstitutionalized population. Access data table for Figure 5.
SOURCE: National Center for Health Statistics, National Health Interview Survey, 2019–2021.
Summary
During 2019–2021, a significant increase in the prevalence of any diagnosed developmental disability was observed. However, no significant change in the prevalence of diagnosed autism spectrum disorder or intellectual disability was observed over the same period. The increase in the prevalence of any developmental disability was largely the result of the significant increase in prevalence of any other developmental delay.
Estimates presented in this report are the first on developmental disabilities from NHIS since the survey was redesigned in 2019. While the prevalence reported in this report was higher for each selected condition than in a previous report from NHIS (3) with estimates from 2014–2016, these estimates may not be comparable with pre-redesign estimates. Boys were more likely to be diagnosed with a developmental disability than girls, younger children were less likely to be diagnosed with intellectual disability, and older children were less likely to be diagnosed with a developmental delay. This report did not find Black and Hispanic children to be more likely to be diagnosed with autism spectrum disorder compared with White children, unlike recent reports (4).
Definitions
Diagnosed developmental disabilities: Children were considered to have a developmental disability if they were diagnosed with one or more of the three selected developmental disabilities:
- Autism spectrum disorder: Based on a “yes” response to the survey question, “Has a doctor or other health professional ever told you that [sample child] had autism, Asperger’s disorder, pervasive developmental disorder, or autism spectrum disorder?” Children diagnosed with autism spectrum disorder could also be diagnosed with intellectual disability.
- Intellectual disability: Based on a “yes” response to the survey question, “Has a doctor or other health professional ever told you that [sample child] had an intellectual disability, also known as mental retardation?” Children diagnosed with intellectual disability could also be diagnosed with autism spectrum disorder.
- Other developmental delay: Based on a “yes” response to the survey question, “Has a doctor or other health professional ever told you that [sample child] had any other developmental delay?” Parents who affirmed that their child had autism spectrum disorder or intellectual disability were asked to exclude those conditions when asked about any other developmental delay. Children who were diagnosed with either or both autism spectrum disorder and intellectual disability and had a “yes” response to this survey question were considered to have been diagnosed with both or all three conditions.
Race and Hispanic origin: Categories shown for non-Hispanic children are for those who selected only one racial group; respondents had the option to select more than one racial group. Children categorized as Hispanic may be of any race or combination of races. Estimates for non-Hispanic children of races other than White only, Black only, or Asian only are not shown but are included in total estimates. Analyses were limited to the race and Hispanic-origin groups for which data were reliable and sufficiently powered for group comparisons based on National Center for Health Statistics presentation standards (5).
Data source and methods
Data from the 2019–2021 NHIS were used for this analysis. NHIS is a nationally representative household survey of the U.S. civilian noninstitutionalized population. It is conducted continuously throughout the year by the National Center for Health Statistics. Interviews are typically conducted in respondents’ homes, but follow-ups to complete interviews may be conducted over the telephone. Because of the COVID-19 pandemic, interviewing procedures were disrupted, and 68.0% of 2020 and 61.4% of 2021 Sample Child interviews were conducted at least partially by telephone (6,7). In 2019, 31.7% of Sample Child interviews were conducted at least partially by telephone (8). For more information about NHIS, visit https://www.cdc.gov/nchs/nhis.htm. The NHIS questionnaire was redesigned in 2019, which may impact the ability to compare estimates from this report with previous years. For more information on the NHIS redesign, visit https://www.cdc.gov/nchs/nhis/2019_quest_redesign.htm.
Point estimates and the corresponding confidence intervals were calculated using SAS-callable SUDAAN software (9). All estimates are based on parent or guardian report and meet National Center for Health Statistics data presentation standards for proportions (5). Estimates are presented at two decimal places to allow comparability with reports from the Autism and Developmental Disabilities Monitoring Network (4) and previous National Center for Health Statistics reports (3). Differences between percentages were evaluated using two-sided significance tests at the 0.05 level via logistic regression. Linear and quadratic trends by age group were evaluated using two-sided significance tests at the 0.05 level.
About the authors
Benjamin Zablotsky, Amanda E. Ng, Lindsey I. Black, and Stephen J. Blumberg are with the National Center for Health Statistics, Division of Health Interview Statistics.
References
- Zablotsky B, Black LI, Maenner MJ, Schieve LA, Danielson ML, Bitsko RH, et al. Prevalence and trends of developmental disabilities among children in the United States: 2009–2017. Pediatrics 144(4):e20190811. 2019.
- Cogswell ME, Coil E, Tian LH, Tinker SC, Ryerson AB, Maenner MJ, et al. Health needs and use of services among children with developmental disabilities—United States, 2014–2018. MMWR Morb Mortal Wkly Rep 71(12):453–8. 2022.
- Zablotsky B, Black LI, Blumberg SJ. Estimated prevalence of children with diagnosed developmental disabilities in the United States, 2014–2016. NCHS Data Brief, no 291. Hyattsville, MD: National Center for Health Statistics. 2017.
- Maenner MJ, Warren Z, Williams AR, Amoakohene E, Bakian AV, Bilder DA, et al. Prevalence and characteristics of autism spectrum disorder among children aged 8 years—Autism and Developmental Disabilities Monitoring Network, 11 sites, United States, 2020. MMWR Surveill Summ 72(2):1–14. 2023.
- Parker JD, Talih M, Malec DJ, Beresovsky V, Carroll M, Gonzalez JF Jr, et al. National Center for Health Statistics data presentation standards for proportions. National Center for Health Statistics. Vital Health Stat 2(175). 2017.
- National Center for Health Statistics. National Health Interview Survey, 2020 survey description. 2021.
- National Center for Health Statistics. National Health Interview Survey, 2021 survey description. 2022.
- National Center for Health Statistics. National Health Interview Survey, 2019 survey description. 2020.
- RTI International. SUDAAN (Release 11.0.3) [computer software]. 2018.
Suggested citation
Zablotsky B, Ng AE, Black LI, Blumberg SJ. Diagnosed developmental disabilities in children aged 3–17 years: United States, 2019–2021. NCHS Data Brief, no 473. Hyattsville, MD: National Center for Health Statistics. 2023. DOI: https://dx.doi.org/10.15620/cdc:129520.
Copyright information
All material appearing in this report is in the public domain and may be reproduced or copied without permission; citation as to source, however, is appreciated.
National Center for Health Statistics
Brian C. Moyer, Ph.D., Director
Amy M. Branum, Ph.D., Associate Director for Science
Division of Health Interview Statistics
Stephen J. Blumberg, Ph.D., Director
Anjel Vahratian, Ph.D., M.P.H., Associate Director for Science