Suicide and Homicide Death Rates Among Youth and Young Adults Aged 10–24: United States, 2001–2021
- Key findings
- Suicide rates for people aged 10–24 increased from 2007 through 2021, while homicide rates increased from 2014 through 2021.
- For people aged 10–14, suicide rates increased from 2007 through 2018, while homicide rates increased from 2016 through 2020.
- Suicide rates for people aged 15–19 increased from 2009 through 2017, while homicide rates increased from 2014 through 2021.
- Suicide rates for people aged 20–24 increased from 2001 through 2021, while homicide rates increased from 2014 through 2021.
Data from the National Vital Statistics System
- Suicide rates for people aged 10–24 increased from 2007 through 2021 (from 6.8 deaths per 100,000 to 11.0), while homicide rates declined from 2006 through 2014, and then increased through 2021.
- For people aged 10–14, the suicide rate tripled from 2007 through 2018 (from 0.9 to 2.9), and then did not change significantly through 2021, while the homicide rate doubled from 2016 through 2021.
- For people aged 15–19, the suicide rate increased from 2009 through 2017, and the homicide rate decreased from 2006 through 2013 but then increased through 2021, surpassing the suicide rate in 2020.
- For people aged 20–24, the suicide rate increased over the entire period, while the homicide rate increased from 2014 through 2020 and remained unchanged in 2021.
Deaths due to suicide and homicide, often referred to collectively as violent deaths, have been a leading cause of premature death to people aged 10–24 in the United States (1–3). A previous version of this report with data through 2017 showed that suicide and homicide rates for people aged 10–24 were trending upward (4). This report updates the previous report using the most recent data from the National Vital Statistics System and presents trends from 2001 through 2021 in suicide and homicide rates for people aged 10–24 and for age groups 10–14, 15–19, and 20–24.
Keywords: violent deaths, self-harm, National Vital Statistics System
Suicide rates for people aged 10–24 increased from 2007 through 2021, while homicide rates increased from 2014 through 2021.
- The suicide rate among people aged 10–24 remained stable from 2001 through 2007 and then increased 62% from 2007 through 2021 (from 6.8 deaths per 100,000 to 11.0) (Figure 1).
- The homicide rate did not change significantly from 2001 through 2006, declined 28% from 2006 through 2014 (from 9.3 to 6.7), and then increased 60% through 2021 (10.7).
- During 2001–2021, the largest annual increase in the homicide rate was from 2019 through 2020 (37%, from 7.8 to 10.7), and the largest annual increase in the suicide rate was from 2016 through 2017 (10%, from 9.6 to 10.6).
- Although suicide rates surpassed homicide rates in 2010 for people aged 10–24, by 2020, rates were similar due to the increase in homicide rates from 2019 through 2020.
Figure 1. Suicide and homicide death rates among people aged 10–24: United States, 2001–2021
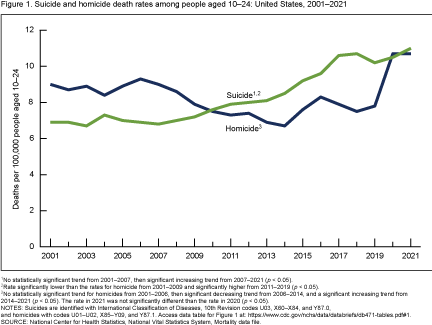
1No statistically significant trend from 2001–2007, then significant increasing trend from 2007–2021 (p < 0.05).
2Rate significantly lower than the rates for homicide from 2001–2009 and significantly higher from 2011–2019 (p < 0.05).
3No statistically significant trend for homicides from 2001–2006, then significant decreasing trend from 2006–2014, and a significant increasing trend from 2014–2021 (p < 0.05). The rate in 2021 was not significantly different than the rate in 2020 (p < 0.05).
NOTE: Suicides are identified with International Classification of Diseases, 10th Revision codes U03, X60–X84, and Y87.0, and homicides with codes U01–U02, X85–Y09, and Y87.1. Access data table for Figure 1.
SOURCE: National Center for Health Statistics, National Vital Statistics System, Mortality data file.
For people aged 10–14, suicide rates increased from 2007 through 2018, while homicide rates increased from 2016 through 2020.
- The suicide rate for people aged 10–14 declined from 2001 through 2007 (from 1.3 deaths per 100,000 to 0.9), tripled from 2007 through 2018 (from 0.9 to 2.9), and then did not change significantly through 2021 (Figure 2).
- Homicide rates for people aged 10–14 declined from 2001 through 2016 (0.9 to 0.7), doubled through 2020 (1.4), and then remained unchanged in 2021.
- During 2001–2021, the largest annual increase in the homicide rate was from 2019 through 2020 (56%, from 0.9 to 1.4), while the largest annual increase in the suicide rate was from 2008 through 2009 (30%, from 1.0 to 1.3).
- The suicide rate for people aged 10–14 was higher than the homicide rate from 2001 through 2005, similar from 2006 through 2008, and higher again from 2009 through 2021.
Figure 2. Suicide and homicide death rates among people aged 10–14: United States, 2001–2021
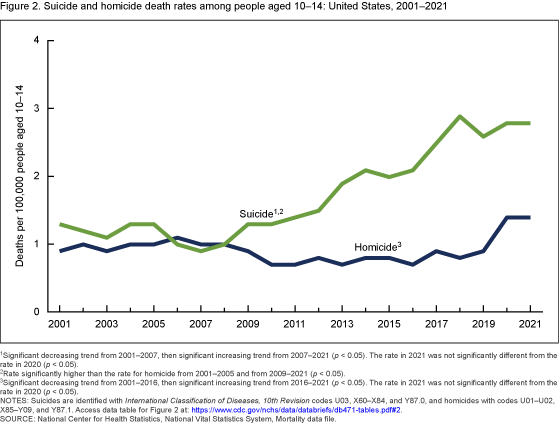
1Significant decreasing trend from 2001–2007, then significant increasing trend from 2007–2021 (p < 0.05). The rate in 2021 was not significantly different from the rate in 2020 (p < 0.05).
2Rate significantly higher than the rate for homicide from 2001–2005 and from 2009–2021 (p < 0.05).
3Significant decreasing trend from 2001–2016, then significant increasing trend from 2016–2021 (p < 0.05). The rate in 2021 was not significantly different from the rate in 2020 (p < 0.05).
NOTES: Suicides are identified with International Classification of Diseases, 10th Revision codes U03, X60–X84, and Y87.0, and homicides with codes U01–U02, X85–Y09, and Y87.1. Access data table for Figure 2.
SOURCE: National Center for Health Statistics, National Vital Statistics System, Mortality data file.
Suicide rates for people aged 15–19 increased from 2009 through 2017, while homicide rates increased from 2014 through 2021.
- The suicide rate for people aged 15–19 did not change significantly from 2001 through 2009, then increased 57% from 2009 through 2017 (from 7.5 deaths per 100,000 to 11.8). From 2017 through 2021, the trend did not change significantly (Figure 3).
- Homicide rates for people aged 15–19 increased from 2001 (9.3) through 2006 (10.5), declined from 2006 through 2014 (6.7), and then increased 91% through 2021 (12.8).
- During 2001–2021, the largest annual increase in the homicide rate was from 2019 through 2020 (38%, from 8.9 to 12.3), while the largest annual increase in the suicide rate was from 2016 through 2017 (18%, from 10.0 to 11.8).
- In 2001, the homicide rate for people aged 15–19 was higher than the suicide rate and remained higher through 2010. From 2011 through 2019, the suicide rate was higher than the homicide rate, but homicide rates surpassed suicide rates again in 2020.
Figure 3. Suicide and homicide death rates among people aged 15–19: United States, 2001–2021

1Significant increasing trend from 2001–2006, then significant decreasing trend from 2006–2014, then significant increasing trend from 2014–2021 (p < 0.05).
2Rate significantly higher than the rate for suicide from 2001–2010, significantly lower from 2011–2019, and significantly higher from 2020–2021 (p < 0.05).
3No statistically significant trend from 2001–2009, then significant increasing trend from 2009–2017, then no statistically significant trend from 2017–2021 (p < 0.05).
NOTES: Suicides are identified with International Classification of Diseases, 10th Revision codes U03, X60–X84, and Y87.0, and homicides with codes U01–U02, X85–Y09, and Y87.1. Access data table for Figure 3.
SOURCE: National Center for Health Statistics, National Vital Statistics System, Mortality data file.
Suicide rates for people aged 20–24 increased from 2001 through 2021, while homicide rates increased from 2014 through 2021.
- The suicide rate for people aged 20–24 increased 63% from 2001 through 2021 (from
11.9 deaths per 100,000 to 19.4), with a greater pace of increase from 2012 through 2021 (4% annually, on average) than from 2001 through 2012 (1% annually) (Figure 4). - The homicide rate declined 30% from 2001 through 2014 (from 17.2 to 12.1), increased 49% through 2020 (18.0), and remained stable in 2021.
- During 2001–2021, the largest annual increase in the homicide rate was from 2019 through 2020 (34%, from 13.4 to 18.0), while the largest annual increase for suicide occurred from 2020 through 2021 (9%, from 17.8 to 19.4).
- From 2001 through 2009, the homicide rate for people aged 20–24 was higher than the suicide rate, rates were not significantly different from 2010 through 2012, and then the suicide rate became higher than the homicide rate from 2013 through 2019. Rates were not statistically different in 2020, then became higher again for suicide in 2021.
Figure 4. Suicide and homicide death rates among people aged 20–24: United States, 2001–2021

1Significant increasing trend from 2001–2021 with different rates of change over time (p < 0.05).
2Rate significantly lower than the rate for homicide from 2001–2009 and significantly higher from 2013–2019 and in 2021 (p < 0.05).
3Significant decreasing trend from 2001–2014, then significant increasing trend from 2014–2021 (p < 0.05). The rate in 2021 was not significantly different than the rate in 2020 (p < 0.05).
NOTES: Suicides are identified with International Classification of Diseases, 10th Revision codes U03, X60–X84, and Y87.0, and homicides with codes U01–U02, X85–Y09, and Y87.1. Access data table for Figure 4.
SOURCE: National Center for Health Statistics, National Vital Statistics System, Mortality data file.
Summary
In 2021, suicide and homicide were the second and third leading causes of death, respectively, for people aged 10–24 and among the top four leading causes of death for the individual age groups 10–14, 15–19, and 20–24 (5). After a period with no significant change in trends from 2001 through 2006–2007, suicide rates for people aged 10–24 increased through 2021, and homicide rates declined through 2014 and then increased through 2021. Homicide rates were lower than suicide rates from 2011 through 2019, but the rates converged by 2020. This change was due to the relatively large annual increase in the homicide rate from 2019 through 2020. For age groups 10–14, 15–19, and 20–24, both suicide and homicide rates increased during the period, with the increases in suicide rates beginning earlier than homicide rates. In addition, the largest annual increases in homicide rates for all groups were from 2019 through 2020, and the largest annual increases in suicide rates were from 2008 through 2009 for those aged 10–14, from 2016 through 2017 for those aged 15–19, and from 2020 through 2021 for those aged 20–24. In 2021, the suicide rate was higher than the homicide rate for people aged 10–14 and 20–24, while the homicide rate was higher for people aged 15–19.
Data source and methods
Mortality and population data are from the National Center for Health Statistics’ 2001–2021 multiple cause-of-death mortality files (6,7). Population data for 2010 are April 1 bridged-race census counts; for 2001–2009, they are July 1 intercensal estimates; and for 2011–2020, they are July 1 postcensal estimates based on the 2020 census. Population estimates for 2021 are estimated as of July 1 based on the Blended Base produced by the U.S. Census Bureau in lieu of the April 1, 2020, decennial population count. The Blended Base is a blend of Vintage 2020 postcensal population estimates, 2020 Demographic Analysis Estimates, and the 2020 Census PL 94-171 Redistricting File (8). Deaths for people aged 10–24 that were assigned an International Classification of Diseases, 10th Revision (9) underlying cause-of-death code for homicide (U01–U02, X85–Y09, and Y87.1) and suicide (U03, X60–X84, and Y87.0) were selected. Numbers of deaths for suicide and homicide for the age groups 10–14, 15–19, and 20–24 are in the backup tables to the figures.
Figures 1–4 were evaluated using the Joinpoint Regression Program (10). The Joinpoint software was used to fit weighted least-squares regression models to the estimated proportions on the logarithmic scale. The default settings allowed for as few as three observed time points in the beginning, ending, and middle line segments, including the joinpoints. Using these settings, a maximum of two joinpoints were searched for using the grid search algorithm and permutation test and an overall alpha level of 0.05.
Pairwise comparisons between suicide and homicide rates were tested using the z test statistic at the 0.05 level of significance.
About the authors
The authors are with the National Center for Health Statistics. Sally C. Curtin is with the Division of Vital Statistics, and Matthew F. Garnett is with the Division of Analysis and Epidemiology.
References
- David-Ferdon C, Vivolo-Kantor AM, Dahlberg LL, Marshall KJ, Rainford N, Hall JE. A comprehensive technical package for the prevention of youth violence and associated risk behaviors. National Center for Injury Prevention and Control. 2016.
- Johnston BD, Ebel BE. Child injury control: Trends, themes, and controversies. Acad Pediatr 13(6):499–507. 2013.
- Sumner SA, Mercy JA, Dahlberg LL, Hills SD, Klevens J, Houry D. Violence in the United States: Status, challenges, and opportunities. JAMA 314(5):478–88. 2015.
- Curtin SC, Heron M. Death rates due to suicide and homicide among persons aged 10–24: United States, 2000–2017. NCHS Data Brief, no 352. Hyattsville, MD: National Center for Health Statistics. 2019.
- Heron M. Deaths: Leading causes for 2021. National Vital Statistics Reports. Hyattsville, MD: National Center for Health Statistics. 2023. [Forthcoming].
- Centers for Disease Control and Prevention. CDC WONDER. About underlying cause of death, 1999–2020, bridged race.
- Centers for Disease Control and Prevention. CDC WONDER. About underlying cause of death, 2018–2021, single race.
- U.S. Census Bureau. Methodology for the United States population estimates: Vintage 2021 nation, states, counties, and Puerto Rico – April 1, 2020 to July 1, 2021. 2021.
- World Health Organization. International statistical classification of diseases and related health problems, 10th revision (ICD–10). 2008 ed. 2009.
- National Cancer Institute. Joinpoint Regression Program (Version 4.8.0.1) [computer software]. 2020.
Suggested citation
Curtin SC, Garnett MF. Suicide and homicide death rates among youth and young adults aged 10–24: United States, 2001–2021. NCHS Data Brief, no 471. Hyattsville, MD: National Center for Health Statistics. 2023. DOI: https://dx.doi.org/10.15620/cdc:128423.
Copyright information
All material appearing in this report is in the public domain and may be reproduced or copied without permission; citation as to source, however, is appreciated.
National Center for Health Statistics
Brian C. Moyer, Ph.D., Director
Amy M. Branum, Ph.D., Associate Director for Science
Division of Vital Statistics
Steven Schwartz, Ph.D., Director
Andrés A. Berruti, Ph.D., M.A., Associate Director for Science
Division of Analysis and Epidemiology
Irma E Arispe, Ph.D., Director
Julie D. Weeks, Ph.D., Acting Associate Director for Science