Characteristics of Adults Aged 18–64 Who Did Not Take Medication as Prescribed to Reduce Costs: United States, 2021
- Key findings
- The percentage of adults aged 18–64 who took prescription medication in the past 12 months and did not take it as prescribed to reduce costs varied by sex and race and Hispanic origin.
- The percentage of adults taking prescription drugs who did not take medication as prescribed to reduce costs was higher among those with disabilities and those reporting fair or poor health.
- The percentage of adults taking prescription drugs who did not take medication as prescribed to reduce costs decreased with increasing income and was highest among uninsured adults.
- The percentage of adults who did not take medication as prescribed to reduce costs was highest among those without prescription drug coverage.
- Summary
Data from the National Health Interview Survey
- In 2021, 8.2% of adults aged 18–64 who took prescription medication in the past 12 months reported not taking medication as prescribed due to cost. Women (9.1%) were more likely than men (7.0%) to not take medication as prescribed.
- Adults with disabilities (20.0%) were more likely than adults without disabilities (7.1%) to not take medication as prescribed to reduce costs.
- Uninsured adults were more likely than adults with other health coverage, Medicaid, or private health insurance to not take medication as prescribed due to cost.
- Adults without prescription drug coverage were more likely to not take medication as prescribed to reduce costs compared with adults with public or private prescription drug coverage.
About 60% of adults aged 18 and over reported taking at least one prescription medication in 2021, with 36% reporting taking three or more (1). Out-of-pocket costs on retail drugs rose 4.8% to $63 billion in 2021 (2). High costs may limit individuals’ access to medications and lead to people not taking medication as prescribed (3,4); this may result in more serious illness and require additional treatment (5). This report examines the characteristics of adults aged 18–64 who took prescription medication in the past 12 months and did not take medication as prescribed due to cost. Cost-saving measures included skipping doses, taking less medication than prescribed, or delaying filling a prescription.
Keywords: prescription drugs, nonadherence, medical expenses, National Health Interview Survey (NHIS)
The percentage of adults aged 18–64 who took prescription medication in the past 12 months and did not take it as prescribed to reduce costs varied by sex and race and Hispanic origin.
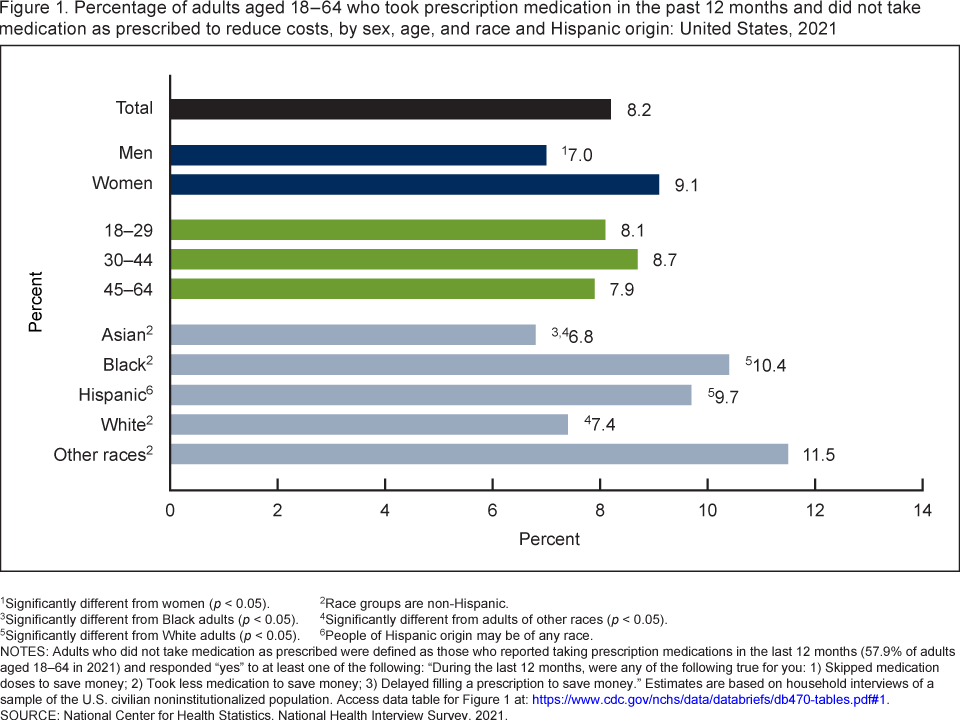
- In 2021, among adults aged 18–64 who took prescription medication in the past 12 months, 8.2% did not take medication as prescribed due to cost (Figure 1).
- Women (9.1%) were more likely than men (7.0%) to not take medication as prescribed.
- The percentage of adults who did not take medication as prescribed was similar by age group.
- Non-Hispanic other or multiple race adults (11.5%) and non-Hispanic Black adults (10.4%) were more likely than non-Hispanic White (subsequently, White) (7.4%) or non-Hispanic Asian (6.8%) adults to not take medication as prescribed. Hispanic adults were more likely than White adults to not take medication due to cost.
Figure 1. Percentage of adults aged 18–64 who took prescription medication in the past 12 months and did not take medication as prescribed to reduce costs, by sex, age, and race and Hispanic origin: United States, 2021
1Significantly different from women (p < 0.05).
2Race groups are non-Hispanic.
3Significantly different from Black adults (p < 0.05).
4Significantly different from adults of other races (p < 0.05).
5Significantly different from White adults (p < 0.05).
6People of Hispanic origin may be of any race.
NOTE: Adults who did not take medication as prescribed were defined as those who reported taking prescription medications in the last 12 months (57.9% of adults aged 18–64 in 2021) and responded “yes” to at least one of the following: “During the last 12 months, were any of the following true for you: 1) Skipped medication doses to save money; 2) Took less medication to save money; 3) Delayed filling a prescription to save money.” Estimates are based on household interviews of a sample of the U.S. civilian noninstitutionalized population. Access data table for Figure 1.
SOURCE: National Center for Health Statistics, National Health Interview Survey, 2021.
The percentage of adults taking prescription drugs who did not take medication as prescribed to reduce costs was higher among those with disabilities and those reporting fair or poor health.
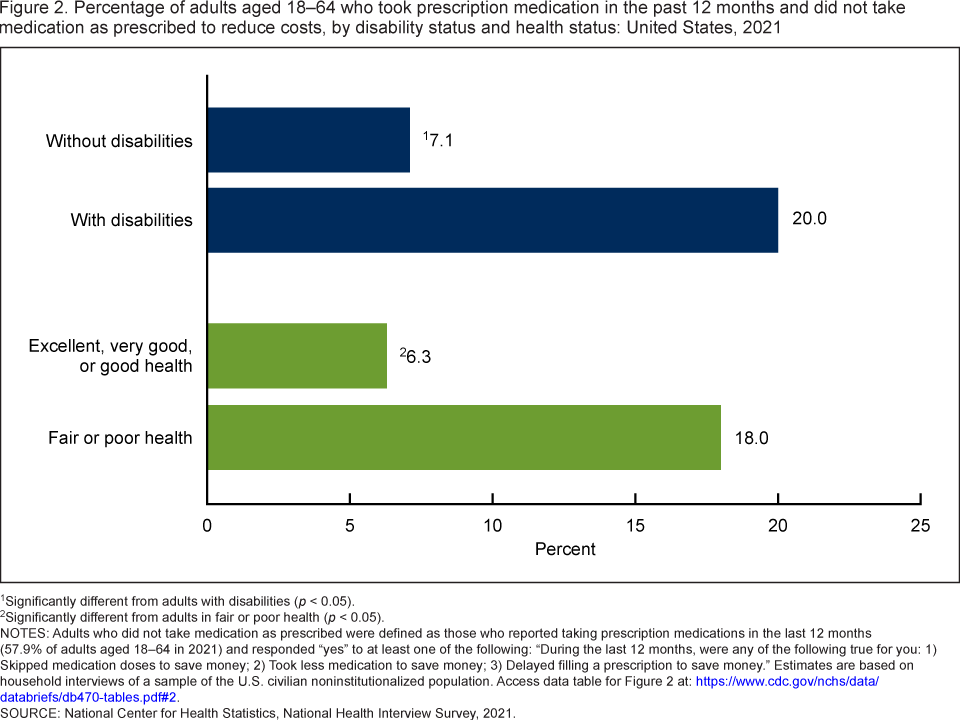
- Among adults aged 18–64 who took prescription medication in the past 12 months, those with disabilities (20.0%) were nearly three times more likely than those without disabilities (7.1%) to not take medication as prescribed due to cost (Figure 2).
- Adults in fair or poor health (18.0%) were almost three times more likely than those in excellent, very good, or good health (6.3%) to not take medication as prescribed.
Figure 2. Percentage of adults aged 18–64 who took prescription medication in the past 12 months and did not take medication as prescribed to reduce costs, by disability status and health status: United States, 2021
1Significantly different from adults with disabilities (p < 0.05).
2Significantly different from adults in fair or poor health (p < 0.05).
NOTES: Adults who did not take medication as prescribed were defined as those who reported taking prescription medications in the last 12 months (57.9% of adults aged 18–64 in 2021) and responded “yes” to at least one of the following: “During the last 12 months, were any of the following true for you: 1) Skipped medication doses to save money; 2) Took less medication to save money; 3) Delayed filling a prescription to save money.” Estimates are based on household interviews of a sample of the U.S. civilian noninstitutionalized population. Access data table for Figure 2.
SOURCE: National Center for Health Statistics, National Health Interview Survey, 2021.
The percentage of adults taking prescription drugs who did not take medication as prescribed to reduce costs decreased with increasing income and was highest among uninsured adults.
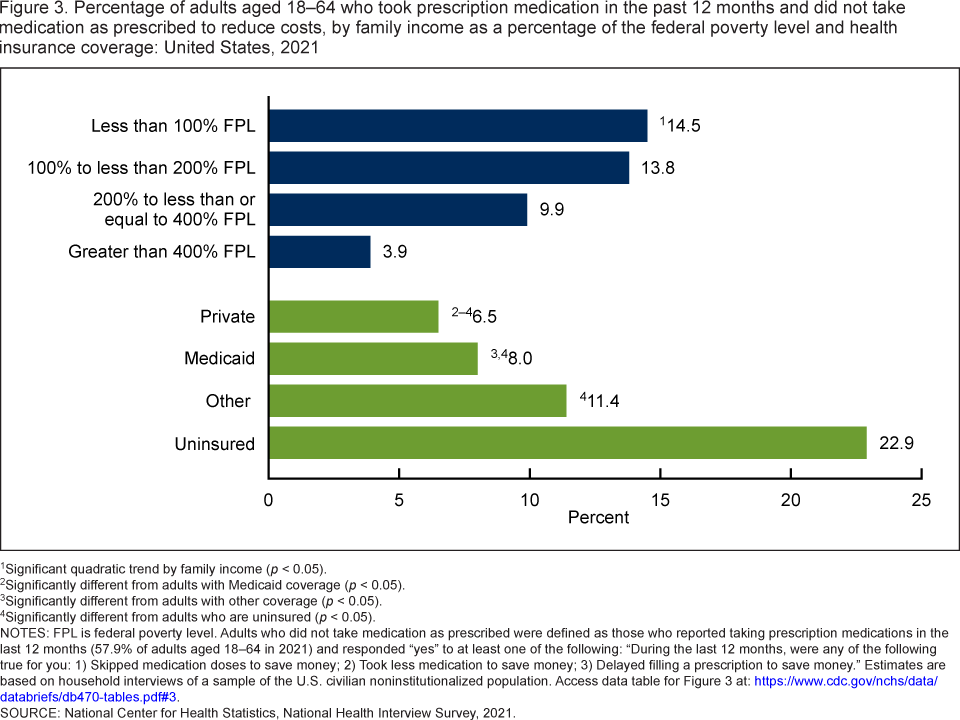
- Among adults aged 18–64 taking prescription drugs at any time in the past 12 months, the percentage of adults who did not take medications as prescribed to reduce costs decreased as family income as a percentage of the federal poverty level increased (Figure 3).
- Uninsured adults (22.9%) were the most likely to not take medications as prescribed, followed by adults with other health coverage (11.4%), Medicaid (8.0%), and those with private health insurance (6.5%).
Figure 3. Percentage of adults aged 18–64 who took prescription medication in the past 12 months and did not take medication as prescribed to reduce costs, by family income as a percentage of the federal poverty level and health insurance coverage: United States, 2021
1Significant quadratic trend by family income (p < 0.05).
2Significantly different from adults with Medicaid coverage (p < 0.05).
3Significantly different from adults with other coverage (p < 0.05).
4Significantly different from adults who are uninsured (p < 0.05).
NOTES: FPL is federal poverty level. Adults who did not take medication as prescribed were defined as those who reported taking prescription medications in the last 12 months (57.9% of adults aged 18–64 in 2021) and responded “yes” to at least one of the following: “During the last 12 months, were any of the following true for you: 1) Skipped medication doses to save money; 2) Took less medication to save money; 3) Delayed filling a prescription to save money.” Estimates are based on household interviews of a sample of the U.S. civilian noninstitutionalized population. Access data table for Figure 3.
SOURCE: National Center for Health Statistics, National Health Interview Survey, 2021.
The percentage of adults who did not take medication as prescribed to reduce costs was highest among those without prescription drug coverage.
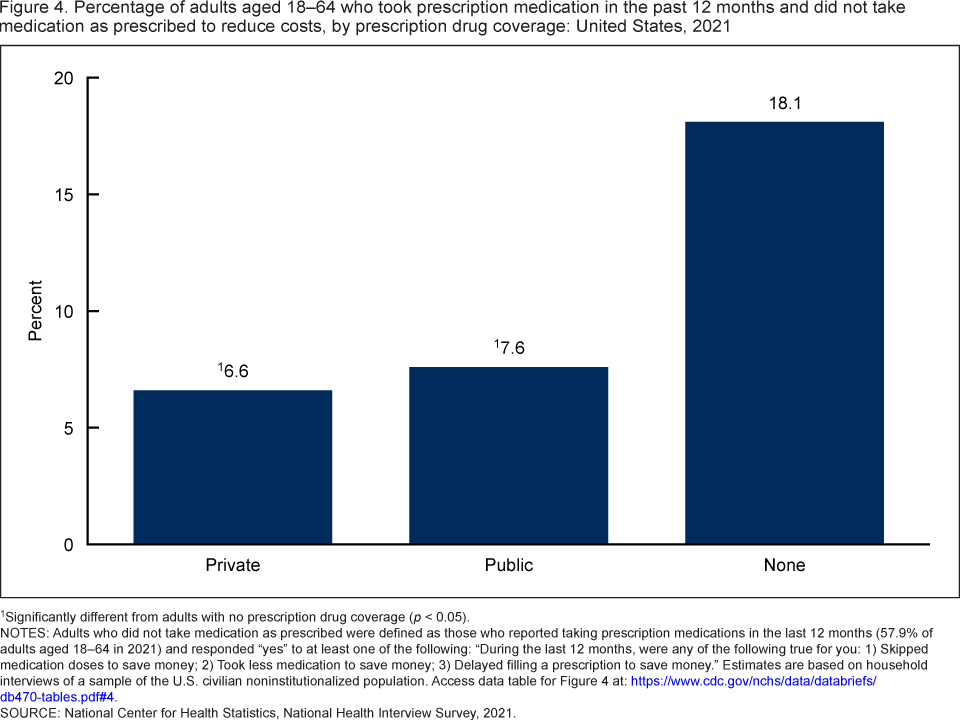
- Among adults aged 18–64 taking prescription medication in the past 12 months, 18.1% of those with no prescription drug coverage did not take medications as prescribed to reduce costs, compared with 6.6% of adults with private prescription drug coverage, and 7.6% of adults with prescription drug coverage through public programs (Figure 4).
- No significant difference was seen in not taking medications as prescribed between adults with private and public drug coverage.
Figure 4. Percentage of adults aged 18–64 who took prescription medication in the past 12 months and did not take medication as prescribed to reduce costs, by prescription drug coverage: United States, 2021
1Significantly different from adults with no prescription drug coverage (p < 0.05).
NOTES: Adults who did not take medication as prescribed were defined as those who reported taking prescription medications in the last 12 months (57.9% of adults aged 18–64 in 2021) and responded “yes” to at least one of the following: “During the last 12 months, were any of the following true for you: 1) Skipped medication doses to save money; 2) Took less medication to save money; 3) Delayed filling a prescription to save money.” Estimates are based on household interviews of a sample of the U.S. civilian noninstitutionalized population. Access data table for Figure 4.
SOURCE: National Center for Health Statistics, National Health Interview Survey, 2021.
Summary
In 2021, of the 57.9% of adults aged 18–64 who took prescription drugs at any time in the past 12 months, 9.2 million adults (8.2%) reported not taking medications as prescribed due to cost, employing such strategies as skipping doses, taking less than the prescribed dose, or delaying filling a prescription. Further, variation was seen in the percentage of adults not taking medication as prescribed by demographic and socioeconomic characteristics as well as by disability status and health status, health insurance, and prescription drug coverage. For example, women were more likely than men to not take medication as prescribed. The percentage of adults not taking medication as prescribed declined as family income increased. Adults who lacked health coverage, those in fair or poor health, and those with disabilities were among the most likely to not take medication as prescribed.
Although the average price per prescription remained flat between 2020 and 2021, the number of retail prescriptions grew, with out-of-pocket spending for prescription medications increasing by 4.8% (2). Cost-saving strategies such as skipping doses, taking reduced doses, and delaying filling a prescription may make health conditions worse, result in more serious illness, and require additional expensive treatment, and therefore have implications for health and the costs of care (3,5).
Definitions
Did not take medication as prescribed to reduce costs: Based on a positive response to any of the following questions, “During the past 12 months, are any of the following true for you? 1) You skipped medication doses to save money; 2) You took less medication to save money; and 3) You delayed filling a prescription to save money.” Adults were asked these questions only if they reported taking medication prescribed by a doctor or other health care provider during the past 12 months.
Disability status: Categorized by the level of difficulty reported in the Washington Group Short Set on Functioning. The six domains of functioning include: seeing (even if wearing glasses), hearing (even if wearing hearing aids), mobility (walking or climbing stairs), communication (understanding or being understood by others), cognition (remembering or concentrating), and self-care (such as washing all over or dressing). Adults who responded “a lot of difficulty” or “cannot do at all” to at least one of the six questions are considered to have disabilities.
Family income as a percentage of federal poverty level: Derived from the family’s income in the previous calendar year and family size using the U.S. Census Bureau’s poverty thresholds (6). The 2021 National Health Interview Survey (NHIS) imputed income file was used to create the poverty levels (7).
Health insurance coverage: At the time of interview, respondents reported their type(s) of coverage. This information was used to create a hierarchy of four mutually exclusive categories: private coverage, Medicaid and other public coverage (including the Children’s Health Insurance Program [CHIP]), other coverage, and uninsured. Adults with more than one type of health insurance were assigned to the first appropriate category in the hierarchy.
Prescription drug coverage: Determined at the time of interview. Adults were considered to have private prescription drug coverage if they obtained coverage through either a single service plan, a private health insurance plan, or Medicare Part D. Adults were considered to have public prescription drug coverage if they were covered by Medicaid, CHIP, other public coverage, or military coverage.
Data source and methods
Data from the 2021 NHIS were used for this analysis. NHIS is a nationally representative household survey of the U.S. civilian noninstitutionalized population. It is conducted continuously throughout the year by the National Center for Health Statistics. Interviews are typically conducted in respondents’ homes, but follow-ups to complete interviews may be conducted over the telephone. Because of the COVID-19 pandemic, interviewing procedures were disrupted, and 62.8% of Sample Adult interviews were conducted at least partially by telephone during 2021 (8). For more information about NHIS, visit: https://www.cdc.gov/nchs/nhis.htm.
Point estimates and corresponding confidence intervals were calculated using SAS 9.4 and Stata software version 16 (9) to account for the complex sample design of NHIS. Differences between percentages were evaluated using two-sided significance tests at the 0.05 level. Tests for linear trends were evaluated using logistic regression. All estimates in this report met National Center for Health Statistics data presentation standards for proportions (10).
About the authors
The authors are with the National Center for Health Statistics: Laryssa Mykyta is with the Division of Analysis and Epidemiology, and Robin A. Cohen is with the Division of Health Interview Statistics.
References
- Hamel L, Lopes L, Kirzinger A, Sparks G, Kearney A, Stokes M, Brodie M. Public opinion on prescription drugs and their prices. Kaiser Family Foundation. 2022.
- IQVIA Institute. The use of medicines in the U.S. 2022. 2022.
- Doshi JA, Li P, Huo H, Pettit AR, Armstrong KA. Association of patient out-of-pocket costs with prescription abandonment and delay in fills of novel oral anticancer agents. J Clin Oncol 36(5):476–82. 2018.
- Kaiser Family Foundation. Poll: Nearly 1 in 4 Americans taking prescription drugs say it’s difficult to afford their medicines, including larger shares among those with health issues, with low incomes and nearing Medicare age. 2019.
- Stewart SJF, Moon Z, Horne R. Medication nonadherence: Health impact, prevalence, correlates and interventions. Psychol Health 1–40. 2022. DOI: https://dx.doi.org/10.1080/08870446.2022.2144923.
- U.S. Census Bureau. Poverty thresholds.
- National Center for Health Statistics. Multiple imputation of family income in 2021 National Health Interview Survey: Methods. 2022.
- National Center for Health Statistics. National Health Interview Survey: 2021 survey description. 2022.
- RTI International. SUDAAN (Release 11.0.3) [computer software]. 2018.
- Parker JD, Talih M, Malec DJ, Beresovsky V, Carroll M, Gonzalez JF Jr, et al. National Center for Health Statistics data presentation standards for proportions. National Center for Health Statistics. Vital Health Stat 2(175). 2017.
Suggested citation
Mykyta L, Cohen RA. Characteristics of adults aged 18–64 who did not take medication as prescribed to reduce costs: United States, 2021. NCHS Data Brief, no 470. Hyattsville, MD: National Center for Health Statistics. 2023. DOI: https://dx.doi.org/10.15620/cdc:127680.
Copyright information
All material appearing in this report is in the public domain and may be reproduced or copied without permission; citation as to source, however, is appreciated.
National Center for Health Statistics
Brian C. Moyer, Ph.D., Director
Amy M. Branum, Ph.D., Associate Director for Science
Division of Analysis and Epidemiology
Irma E. Arispe, Ph.D., Director
Julie D. Weeks, Ph.D., Acting Associate Director for Science
Division of Health Interview Statistics
Stephen J. Blumberg, Ph.D., Director
Anjel Vahratian, Ph.D., M.P.H., Associate Director for Science