Visits to Primary Care Delivery Sites: United States, 2008
- Key findings
- CHCs and OPDs are important sources of primary care for poor populations.
- Visit rates were higher for persons with public insurance.
- The chronic disease burden is higher in CHCs than in other settings.
- Imaging and nonmedication treatment were more common at OPDs.
- Summary
- Definitions
- Data source and methods
- About the authors
- References
- Suggested citation
NCHS Data Brief No. 47, October 2010
PDF Version (675 KB)
Esther Hing, M.P.H., and Sayeedha Uddin, M.D., M.P.H.
Key findings
- In 2008, the majority of visits to primary care delivery sites (84%) occurred in physician offices, 11% in hospital outpatient departments (OPDs), and 5% in community health centers (CHCs).
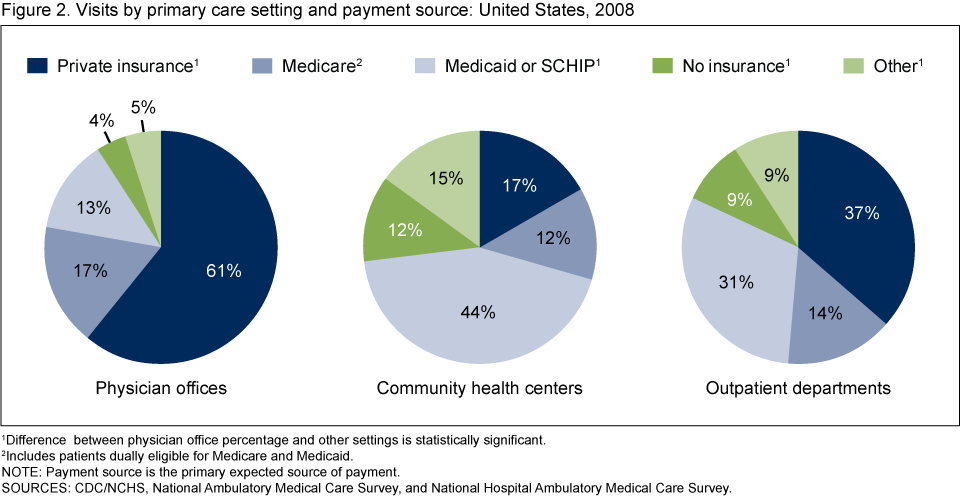
- Patients with Medicaid, State Children’s Health Insurance Plan (SCHIP) or no insurance accounted for a higher percentage of visits to CHCs (56%) and OPDs (40%) than to physician offices (17%).
- CHCs had a higher age-adjusted percentage of visits by patients with one or more chronic conditions (56%) compared with visits to physician offices (49%) and OPDs (49%).
Interest in access, utilization, and quality of primary care has increased due to its potential to prevent more serious health-related events (1-4). This report compares care delivered in physician offices, hospital outpatient departments (OPDs) and community health centers (CHCs). In 2008, 62% of the 1.1 billion ambulatory care visits were made to primary care delivery sites (5-7). Although primary care may be provided by any specialty, our analysis is limited to visits to office-based physicians, CHC providers, and OPD clinics specializing in internal medicine, family or general practice, general pediatrics, and general obstetrics and gynecology.
Keywords: physician offices, hospital outpatient departments, community health centers
CHCs and OPDs are important sources of primary care for poor populations.
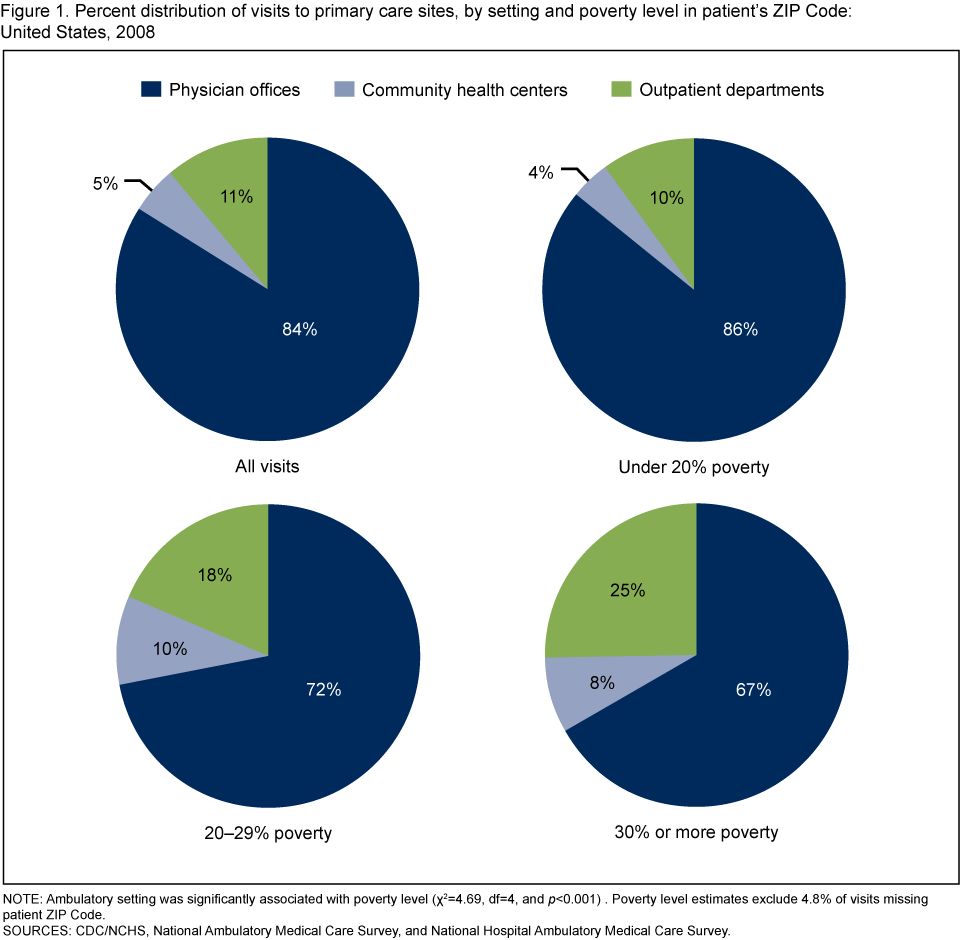
- Based on the National Ambulatory Medical Care Survey and the National Hospital Ambulatory Medical Care Survey, there were 664.0 million visits to primary care clinicians in 2008; 84% were to office-based physicians (556.6 million visits), 11% to hospital OPDs (73.1 million visits), and 5% were to CHCs (34.3 million visits).
- The proportion of visits made to CHCs and OPD clinics combined increased to approximately one-third of visits, as the poverty level of patients’ neighborhood increased to 30% or more in poverty (Figure 1)
Visit rates were higher for persons with public insurance.
- Private insurance was used more frequently for physician office visits (61%) than for visits to CHCs (17%) and OPDs (37%). A higher percentage of visits to CHCs (56%) and OPDs (40%) than to physician offices (17%) were made by patients using only Medicaid, State Children’s Health Insurance Plan (SCHIP) or no insurance for payment (Figure 2).
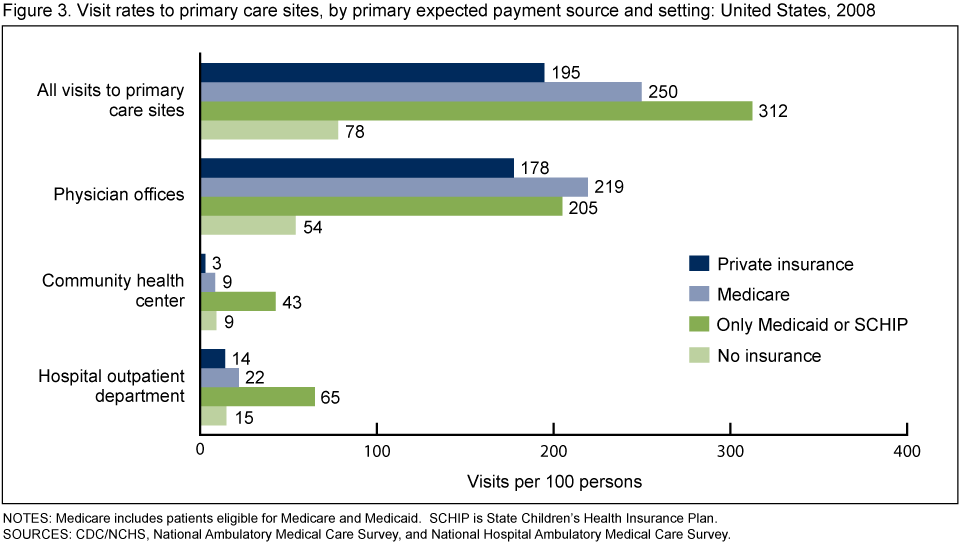
- Overall, the visit rates for persons with Medicare and persons relying only on Medicaid or SCHIP exceeded that for all other payment sources (Figure 3).
The chronic disease burden is higher in CHCs than in other settings.
- After adjusting for differences in age distributions across settings, CHCs had a higher percentage of visits by patients with one or more chronic conditions (56%) compared with physician offices (49%) and OPDs (49%) (Figure 4).
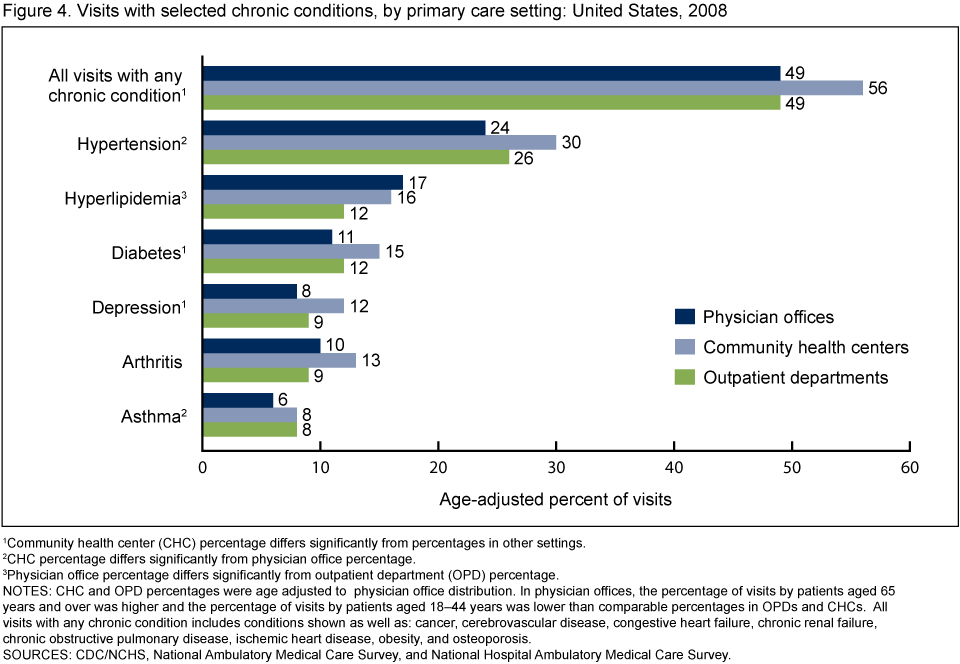
- The age-adjusted percentage of CHC visits made by patients with diabetes (15%) and depression (12%) exceeded analogous percentages in physician offices and hospital OPDs.The age-adjusted percentage of CHC visits made by patients with hypertension (30%) exceeded the percentage in physician offices (24%), while the age-adjusted percentage of physician office visits by patients with hyperlipidemia (17%) exceeded the percentage in OPDs (12%).
- The age-adjusted percentage of visits for acute conditions in CHCs (39%) was lower compared with OPDs (46%). The comparable percentage for office-based physicians (40%) was similar to that for CHCs (data not shown).
Imaging and nonmedication treatment were more common at OPDs.
- Hospital OPDs had a higher age-adjusted percentage of visits during which imaging was ordered or provided (18%) compared with physician offices (14%) and CHCs (11%) (Table).
Table. Selected services ordered or provided by primary care setting: United States, 2008
| Services ordered or provided | Physician offices | Community health centers | Outpatient departments |
|---|---|---|---|
| Age-adjusted percentage of visits | |||
| Drug or immunization mentioned | 80 | 83 | 81 |
| Lab and other tests1 | 50 | 49 | 52 |
| Health education service2 | 39 | 40 | 46 |
| Any imaging3 | 14 | 11 | 18 |
| Nonmedication treatment3,4 | 10 | 10 | 16 |
1 Lab and other tests include scope procedures, biopsy. EKG/ECG, spirometry/pulmonary function test, and other services.
2 Health education services include education about asthma, diet and nutrition, exercise, growth and development, injury prevention, stress management, tobacco use and exposure, weight reduction, and other education.
3 Difference between outpatient department and other settings is statistically significant.
4 Non-medication treatment includes: complementary and alternative medicine, durable medical equipment, home health care, hospice care, physical therapy, radiation therapy, speech and occupational therapy, psychotherapy, other mental health counseling, excision of tissue, orthopedic care, wound care, other nonsurgical procedures, and other surgical procedures.
NOTES: Community health center (CHC) and outpatient department (OPD) visits were age-adjusted to physician office distribution. In physician offices, the percentage of visits by patients 65 years and older was higher and the percentage of visits by patients aged 18-44 years was lower than comparable percentages in CHCs and OPDs.
SOURCES: CDC/NCHS, National Ambulatory Medical Care Survey and National Hospital Ambulatory Medical Care Survey.
- Hospital OPDs also had a higher percentage of age-adjusted visits during which nonmedication treatment was ordered or provided (16%) compared with physician offices (10%) and CHCs (10%).
- There was no difference among settings in the age-adjusted percentage of visits in which drugs or immunizations were prescribed or continued, lab and other types of tests were ordered or administered, and health education was documented.
Summary
This study describes primary care delivery across ambulatory care settings. Although the majority of visits to primary care settings occur in physician offices (84%), OPDs and CHCs are important sources of primary care for poor and uninsured populations.
CHCs also had a higher percentage of visits by patients with one or more chronic conditions compared with office-based physicians and OPDs. This higher burden may not be surprising, as there are well-established associations between socioeconomic status and health (8). Although OPDs and CHCs serve patients from similar neighborhoods and with similar sources of payment, OPDs receive fewer visits by patients with chronic disease. These observations may reflect true differences in case mix or differences in awareness or documentation of chronic disease across settings.
The higher percentage of hospital OPD visits in which imaging and nonmedication treatment was ordered or provided compared with physician offices and CHCs may be due to greater access to these services in a hospital setting. Additionally, our analysis suggests OPDs serve a critical complementary function to CHCs by providing care for acute conditions. These findings are consistent with the role of CHCs and OPDs in the health care safety net (9-12).
Definitions
Community health center (CHC): An outpatient clinic that serves a medically underserved population or is located in a medically underserved area. CHCs represented in NAMCS include clinics that receive Section 330 grants under the Public Health Services Act, “look-alike” Health Centers that meet Federally Qualified Health Center requirements, and Federally Qualified urban Indian Health Service clinics (5).
Outpatient department: A hospital facility where nonemergent ambulatory medical care is provided under the supervision of a physician.
Physician office: A place where nonfederally employed physicians provide direct patient care in the 50 states and the District of Columbia, excluding radiologists, anesthesiologists, and pathologists.
Data source and methods
All estimates are from the 2008 National Ambulatory Medical Care Survey (NAMCS) and the National Hospital Ambulatory Medical Care Survey (NHAMCS). NAMCS is an annual nationally representative survey of visits to nonfederal office-based physicians in the United States. Starting in the 2006 data year, the NAMCS sample includes a separate stratum of CHCs that includes physicians and nonphysician clinicians. NHAMCS is an annual nationally representative survey of visits to nonfederal, general and short-stay hospital emergency and OPDs. More details about NAMCS and NHAMCS methodology are available (5-7).
In this report, physician and OPD visits were based on physician or clinic specialty; OPD clinics were selected based on areview of the clinic’s description (7). All CHC visits were included except visits to providers seeing only patients with mental disorders or substance abuse. CHC and OPD visits include visits to both physicians and nonphysician clinicians (physician assistants, nurse practitioners, and nurse midwives). Comparable information on visits to nonphysician clinicians is underrepresented in the NAMCS compared with hospital OPDs and CHCs (13). However, analysis of these data after excluding visits to nonphysician clinicians yielded nearly identical patterns of care to those presented.
Data analyses were performed using the statistical packages SAS version 9.2 (SAS Institute, Cary, N.C.) and SUDAAN version 9.0 (Research Triangle Institute, Research Triangle Park, N.C.). Differences by site of care and selected patient and visit characteristics were examined using t-tests for differences in rates and Chi-square tests for differences in percent distributions at the p=.05 level.
About the authors
Esther Hing and Sayeedha Uddin are with the Centers for Disease Control and Prevention’s National Center for Health Statistics, Division of Health Care Statistics.
References
- Institute of Medicine Committee on the Future of Primary Care. Primary care America’s health in a new era. National Academy Press, Washington, DC: 1996.
- Medicare Payment Advisory Commission. Report to the Congress: Reforming the delivery system [PDF – 7.8 MB]. Washington, DC: June 2008.
- Starfield B, Shi L, Macinko J. Contribution of primary care to health systems and health. Milbank Quarterly; 83(3):457-502. 2005.
- Grumbach K, Bodenheimer T. A primary care home for Americans: putting the house in order. JAMA; 288(7):889-93. Aug 21, 2002.
- National Ambulatory Medical Care Survey. Public Use Data File Documentation. 2008 National Ambulatory Medical Care Survey. Hyattsville, MD: National Center for Health Statistics. 2010.
- National Center for Health Statistics. Public Use Data File Documentation. Community Health Center data from the 2006-2008 National Ambulatory Medical Care Survey. Hyattsville, MD: National Center for Health Statistics. In preparation.
- National Hospital Ambulatory Medical Care Survey. Public Use Data File Documentation. 2008 National Hospital Ambulatory Medical Care Survey. Hyattsville, MD: National Center for Health Statistics. 2010.
- Marmot M Wilkinson RG (eds). Social Determinants of Health, Oxford University Press, New York: 1999.
- Taylor J. The Fundamentals of Community Health Centers. National Health Policy Forum Background Paper. The George Washington University. Washington, DC. August 31, 2004.
- Regenstein M, Huang J. Stresses to the Safety Net: The Public Hospital Perspective. The Kaiser Commission on Medicaid and the Uninsured. June 2005.
- Hing E, Burt CW. Characteristics of office-based physicians and their medical practices: United States, 2005-06. National Center for Health Statistics. Vital Health Stat 13(166). 2008.
- Forrest CB, Whelan EM. Primary care safety-net delivery sites in the United States: A comparison of community health centers, hospital outpatient departments, and physicians’ offices. JAMA; 284(16):2077-83. Oct 25, 2000.
- Morgan PA, Strand J, Ostbye T, Albanese MA. Missing in action: Care by physician assistants and nurse practitioners in national health surveys. HSR 42(5): 2022-37. 2007.
Suggested citation
Hing E, Uddin S. Visits to primary care delivery sites: United States, 2008. NCHS data brief, no 47. Hyattsville, MD: National Center for Health Statistics. 2010.
Copyright information
All material appearing in this report is in the public domain and may be reproduced or copied without permission; citation as to source, however, is appreciated.
National Center for Health Statistics
Edward J. Sondik, Ph.D., Director
Jennifer H. Madans, Ph.D., Associate Director for Science
Division of Health Care Statistics
Jane E. Sisk, Ph.D., Director