Emergency Department Visits Among Children Aged 0–17 by Selected Characteristics: United States, 2019–2020
- Key findings
- How did ED visit rates for children aged 0–17 change from 2019 to 2020 by age group?
- How did ED visit rates for children aged 0–17 change from 2019 to 2020 by sex?
- How did ED visit rates for children aged 0–17 change from 2019 to 2020 by race and ethnicity?
- How did ED wait times for children aged 0–17 change from 2019 to 2020?
- Summary
Data from the National Hospital Ambulatory Medical Care Survey
- The overall emergency department (ED) visit rate among children aged 0–17 decreased from 48 visits per 100 children in 2019 to 31 visits per 100 children in 2020.
- The ED visit rates for both sexes were lower in 2020 than in 2019.
- The ED visit rates for Black or African American non-Hispanic, White non-Hispanic, and children of other non-Hispanic races and ethnicities were lower in 2020 than in 2019.
- The percentage of visits at which children waited less than 30 minutes until being seen in the ED was higher in 2020 than in 2019 (81% compared with 68%), while the percentage of visits at which children waited 60 minutes or more was lower in 2020 than in 2019 (7% compared with 16%).
With the disruptions to access and use of care caused by the COVID-19 pandemic, emergency department (ED) visit rates decreased from 2019 to 2020 among children and adolescents (1). The ED visit rate for children under age 1 year in 2020 was nearly one-half of the rate in 2019, and the rate for those aged 1–17 years decreased over the same period (2). This report uses data from the National Hospital Ambulatory Medical Care Survey (NHAMCS) (3,4) to compare ED visits for children aged 0–17 from 2019 to 2020, by age group, sex, and race and ethnicity, and to assess changes in wait time at ED visits.
Keywords: emergency care, hospital visit, pediatric care, National Hospital Ambulatory Medical Care Survey (NHAMCS)
How did ED visit rates for children aged 0–17 change from 2019 to 2020 by age group?
- The total ED visit rate for children aged 0–17 decreased from 48 visits per 100 children to 31 visits per 100 children in 2020 (Figure 1).
- Between 2019 and 2020, the ED visit rates decreased for children under age 1 year (123 compared with 68) and for children aged 1–5 years (63 compared with 34).
- The observed change in the ED visit rate for children aged 6–17 was not significant.
- ED visit rates decreased with increasing age in 2019 and 2020.
Figure 1. Emergency department visit rate among children aged 0–17, by age group: United States, 2019–2020
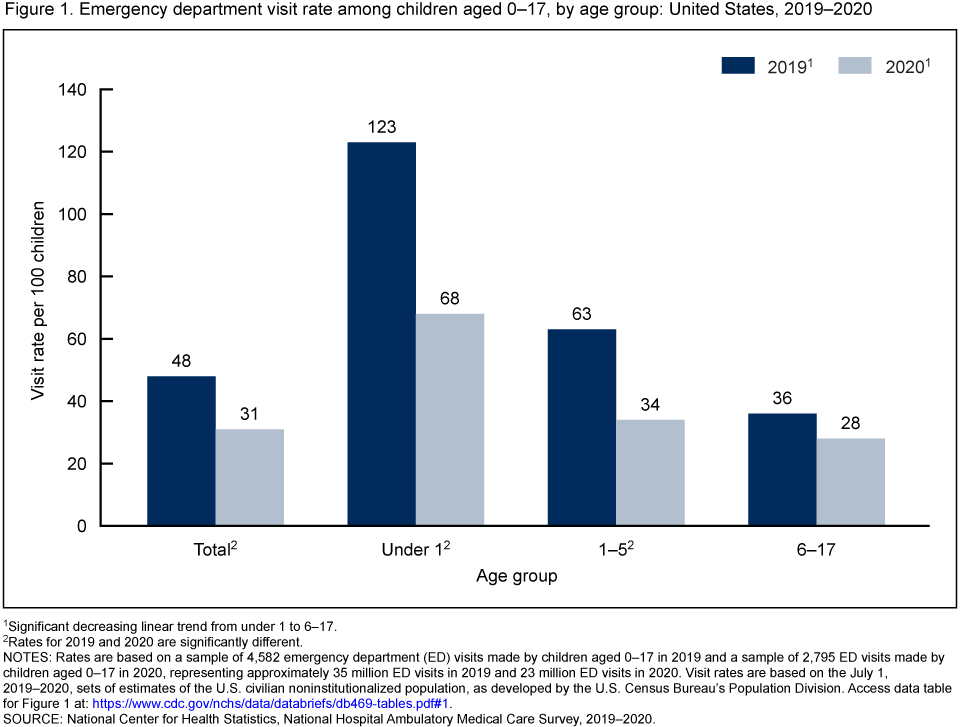
1Significant decreasing linear trend from under 1 to 6–17.
2Rates for 2019 and 2020 are significantly different.
NOTE: Rates are based on a sample of 4,582 emergency department (ED) visits made by children aged 0–17 in 2019 and a sample of 2,795 ED visits made by children aged 0–17 in 2020, representing approximately 35 million ED visits in 2019 and 23 million ED visits in 2020. Visit rates are based on the July 1, 2019–2020, sets of estimates of the U.S. civilian noninstitutionalized population, as developed by the U.S. Census Bureau’s Population Division. Access data table for Figure 1.
SOURCE: National Center for Health Statistics, National Hospital Ambulatory Medical Care Survey, 2019–2020.
How did ED visit rates for children aged 0–17 change from 2019 to 2020 by sex?
- The ED visit rate for girls decreased from 46 to 31 visits per 100 children from 2019 to 2020 (Figure 2).
- The ED visit rate for boys decreased from 50 to 32.
- In 2019 and 2020, ED rates were similar for boys and girls.
Figure 2. Emergency department visit rate among children aged 0–17, by sex: United States, 2019–2020
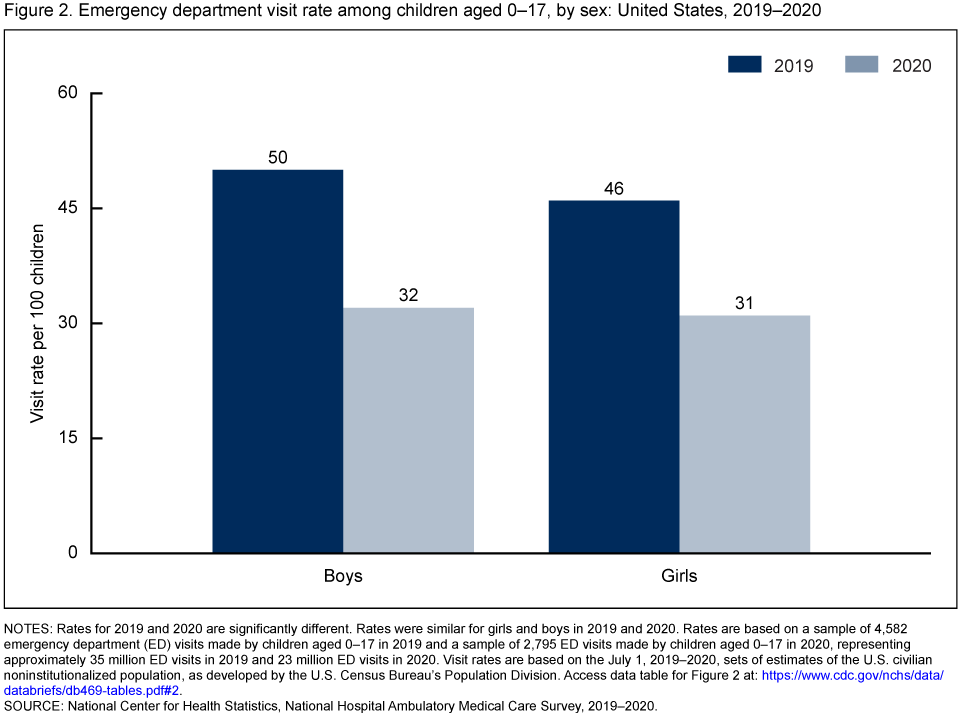
NOTES: Rates for 2019 and 2020 are significantly different. Rates were similar for girls and boys in 2019 and 2020. Rates are based on a sample of 4,582 emergency department (ED) visits made by children aged 0–17 in 2019 and a sample of 2,795 ED visits made by children aged 0–17 in 2020, representing approximately 35 million ED visits in 2019 and 23 million ED visits in 2020. Visit rates are based on the July 1, 2019–2020, sets of estimates of the U.S. civilian noninstitutionalized population, as developed by the U.S. Census Bureau’s Population Division. Access data table for Figure 2.
SOURCE: National Center for Health Statistics, National Hospital Ambulatory Medical Care Survey, 2019–2020.
How did ED visit rates for children aged 0–17 change from 2019 to 2020 by race and ethnicity?
- The ED visit rate for Black or African American non-Hispanic (subsequently, Black) children declined from 86 to 55 visits per 100 children from 2019 to 2020 (Figure 3).
- The ED visit rate for White non-Hispanic (subsequently, White) children declined from 39 to 29.
- The ED visit rate for children of other non-Hispanic races (subsequently, other races) declined from 19 to 10.
- In 2019 and 2020, ED visit rates were highest for Black children, followed by White, and then other races.
Figure 3. Emergency department visit rate among children aged 0–17, by race and ethnicity: United States 2019–2020
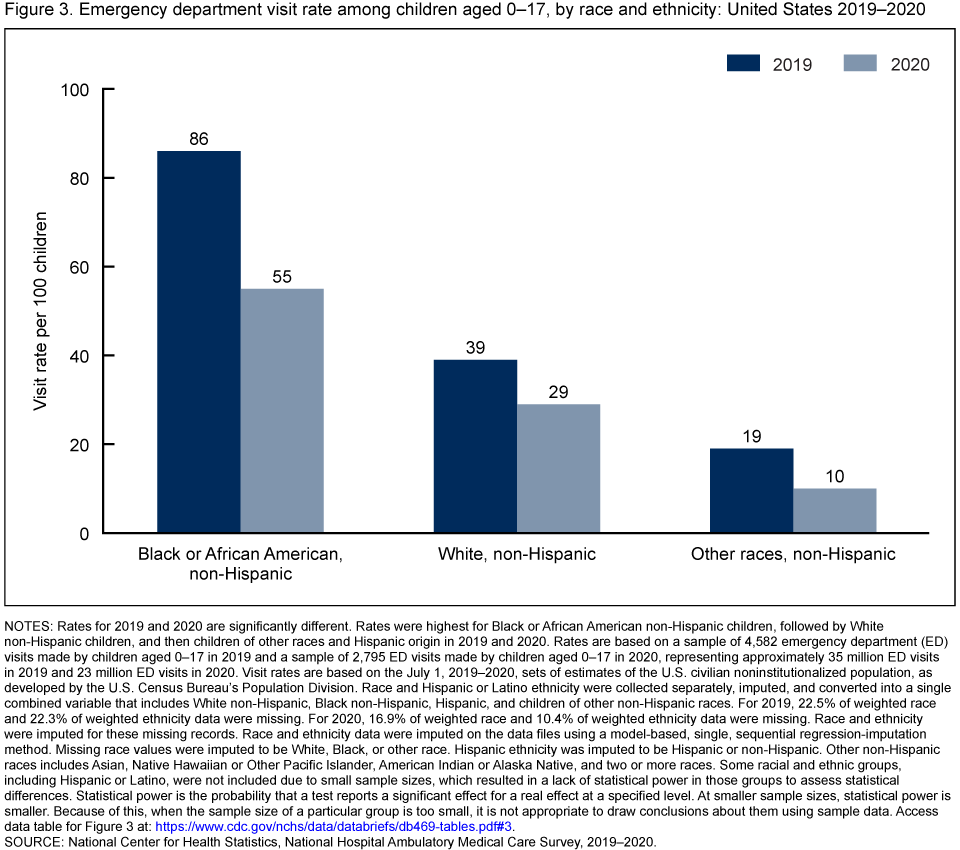
NOTES: Rates for 2019 and 2020 are significantly different. Rates were highest for Black or African American non-Hispanic children, followed by White non-Hispanic children, and then children of other races and Hispanic origin in 2019 and 2020. Rates are based on a sample of 4,582 emergency department (ED) visits made by children aged 0–17 in 2019 and a sample of 2,795 ED visits made by children aged 0–17 in 2020, representing approximately 35 million ED visits in 2019 and 23 million ED visits in 2020. Visit rates are based on the July 1, 2019–2020, sets of estimates of the U.S. civilian noninstitutionalized population, as developed by the U.S. Census Bureau’s Population Division. Race and Hispanic or Latino ethnicity were collected separately, imputed, and converted into a single combined variable that includes White non-Hispanic, Black non-Hispanic, Hispanic, and children of other non-Hispanic races. For 2019, 22.5% of weighted race and 22.3% of weighted ethnicity data were missing. For 2020, 16.9% of weighted race and 10.4% of weighted ethnicity data were missing. Race and ethnicity were imputed for these missing records. Race and ethnicity data were imputed on the data files using a model-based, single, sequential regression-imputation method. Missing race values were imputed to be White, Black, or other race. Hispanic ethnicity was imputed to be Hispanic or non-Hispanic. Other non-Hispanic races includes Asian, Native Hawaiian or Other Pacific Islander, American Indian or Alaska Native, and two or more races. Some racial and ethnic groups, including Hispanic or Latino, were not included due to small sample sizes, which resulted in a lack of statistical power in those groups to assess statistical differences. Statistical power is the probability that a test reports a significant effect for a real effect at a specified level. At smaller sample sizes, statistical power is smaller. Because of this, when the sample size of a particular group is too small, it is not appropriate to draw conclusions about them using sample data. Access data table for Figure 3.
SOURCE: National Center for Health Statistics, National Hospital Ambulatory Medical Care Survey, 2019–2020.
How did ED wait times for children aged 0–17 change from 2019 to 2020?
- The percentage of visits at which children waited less than 30 minutes to see a provider increased from 68% to 81% from 2019 to 2020 (Figure 4).
- The percentage of children who waited 60 minutes or longer to see a provider decreased from 16% to 7% from 2019 to 2020.
- The observed change in the percentage of children who waited 30–59 minutes was not significant.
Figure 4. Percentage of emergency department visits among children aged 0–17, by wait time: United States, 2019–2020
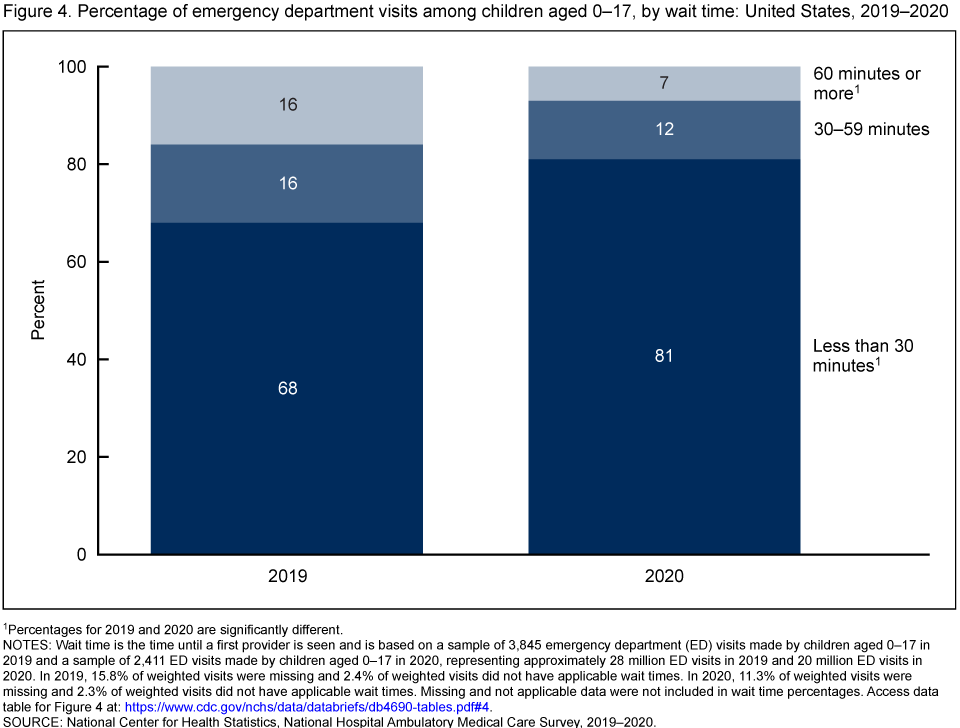
1Percentages for 2019 and 2020 are significantly different.
NOTES: Wait time is the time until a first provider is seen and is based on a sample of 3,845 emergency department (ED) visits made by children aged 0–17 in 2019 and a sample of 2,411 ED visits made by children aged 0–17 in 2020, representing approximately 28 million ED visits in 2019 and 20 million ED visits in 2020. In 2019, 15.8% of weighted visits were missing and 2.4% of weighted visits did not have applicable wait times. In 2020, 11.3% of weighted visits were missing and 2.3% of weighted visits did not have applicable wait times. Missing and not applicable data were not included in wait time percentages. Access data table for Figure 4.
SOURCE: National Center for Health Statistics, National Hospital Ambulatory Medical Care Survey, 2019–2020.
Summary
The total number of ED visits in the United States was lower in 2020 compared with 2019 (3,4). While no change was observed among adults, the rate of visits among children aged 0–17 decreased between these 2 years, and this change occurred for both sexes. The decrease also occurred for Black children, White children, and children of other races. Findings from this report align with other studies that noted decreases in ED visits among children in 2020 (1). This report highlights changes in ED visits made by children aged 0–17, before and during the first year of the COVID-19 pandemic, a period with limited access to and use of care.
Definitions
ED visit rates: Calculated by dividing the number of ED visits by estimates of the U.S. civilian noninstitutionalized population (obtained from the U.S. Census Bureau’s Population Division) for selected characteristics including age group, sex, and race and ethnicity.
Race and ethnicity: Race and Hispanic ethnicity were collected separately, imputed, and converted into a single combined variable that includes Black or African American non-Hispanic, other non-Hispanic, and White non-Hispanic race groups. Other non-Hispanic races include Asian, Native Hawaiian or Other Pacific Islander, American Indian or Alaska Native, and people of two or more races. Some racial and ethnic groups, including Hispanic or Latino, were not included due to small sample sizes, which resulted in a lack of statistical power in those groups to assess statistical differences. Statistical power is the probability that a test reports a significant effect for a real effect at a specified level (5), or in the case of this study, at a level of p < 0.05. At smaller sample sizes, statistical power is smaller. Because of this, when the sample size of a particular group (such as Hispanic children, in this study) is too small, it is not appropriate to draw conclusions about them using sample data. For 2019, 22.5% of weighted race data and 22.3% of weighted ethnicity data were missing for ED visits, and for 2020, 16.9% of race data and 10.4% of ethnicity data were missing for ED visits. Race and ethnicity were imputed for these missing records using a model-based, single, sequential regression-imputation method (3,4). Missing race values were imputed to be Black, White, or other race. Hispanic ethnicity was imputed to be Hispanic or non-Hispanic.
Data source and methods
Data for this report are from NHAMCS, an annual nationally representative survey of nonfederal, general, and short-stay hospitals in the United States (3,4). NHAMCS provides data on the use and provision of ambulatory care services in hospital EDs. The weighted NHAMCS response rate for 2019 was 82.9% and for 2020 was 76.1%. Data analyses were performed using the statistical packages SAS version 9.4 (SAS Institute, Cary, N.C.) and SAS-callable SUDAAN version 11.0 (RTI International, Research Triangle Park, N.C.). Two-tailed t tests with a significance level of p < 0.05 were used to determine statistically significant differences between ED visit rates, and linear regression with a significance level of p < 0.05 was performed to test linear trends.
About the authors
Christopher Cairns, Jill J. Ashman, and Zachary J. Peters are with the National Center for Health Statistics, Division of Health Care Statistics.
References
- Barrett M, Owens P, Roemer M. Changes in emergency department visits in the initial period of the COVID-19 pandemic (April–December 2020), 29 states. Statistical Brief, no 298. Agency for Healthcare Research and Quality. 2022.
- Cairns C, Ashman J. QuickStats: Emergency department visit rates, by age group—United States, 2019–2020. MMWR Morb Mortal Wkly Rep 71(42):1350. 2022.
- National Center for Health Statistics. 2019 NHAMCS micro-data file. 2022.
- National Center for Health Statistics. 2020 NHAMCS micro-data file. 2022.
- Baguley T. Understanding statistical power in the context of applied research. Appl Ergon 35(2):73-80. 2004.
Suggested citation
Cairns C, Ashman JJ, Peters ZJ. Emergency department visits among children aged 0–17 by selected characteristics: United States, 2019–2020. NCHS Data Brief, no 469. Hyattsville, MD: National Center for Health Statistics. 2023. DOI: https://dx.doi.org/10.15620/cdc:127755.
Copyright information
All material appearing in this report is in the public domain and may be reproduced or copied without permission; citation as to source, however, is appreciated.
National Center for Health Statistics
Brian C. Moyer, Ph.D., Director
Amy M. Branum, Ph.D., Associate Director for Science
Division of Health Care Statistics
Carol J. DeFrances, Ph.D., Director
Alexander Strashny, Ph.D., Associate Director for Science