Sleep Medication Use in Adults Aged 18 and Over: United States, 2020
NCHS Data Brief No. 462, January 2023
PDF Version (512 KB)
- Key findings
- Overall, what percentage of adults took medication to help them fall or stay asleep in the last 30 days?
- Did the percentage of adults who took sleep medication vary by sex and age group?
- Were differences observed in the percentage of adults who took sleep medication by sex and race and Hispanic origin?
- Were differences observed in the percentage of adults who took sleep medication by sex and family income?
- Summary
Data from the National Health Interview Survey
- In 2020, 8.4% of adults took sleep medication in the last 30 days either every day or most days to help them fall or stay asleep.
- Women (10.2%) were more likely than men (6.6%) to take medication for sleep, and the use of medication generally increased with increasing age.
- Use of sleep medication varied by race and Hispanic origin for both men and women.
- Among men, those with the highest family incomes were least likely to use sleep medication compared with lower- and middle-income groups.
Sleep medications are a common treatment option for insomnia (1). Insufficient sleep is associated with many negative mental and physical health outcomes, including type 2 diabetes, heart disease, obesity, depression, and an increased risk of injury (2). The prevalence of sleep difficulties and use of sleep medication has differed between men and women (3−5). This report uses 2020 National Health Interview Survey (NHIS) data to describe the percentage of men and women who used medication for sleep, defined here as taking any medication to help fall or stay asleep most days or every day in the past 30 days, by selected sociodemographic characteristics.
Keywords: prescription, over-the-counter, health behavior, insomnia, National Health Interview Survey
Overall, what percentage of adults took medication to help them fall or stay asleep in the last 30 days?
- In 2020, 6.3% of adults took sleep medication every day in the last 30 days, 2.1% took medication most days, 10.0% took medication some days, and 81.6% never took medication (Figure 1).
Figure 1. Percent distribution of how often adults aged 18 and over used medication in the past 30 days to help them fall or stay asleep: United States, 2020
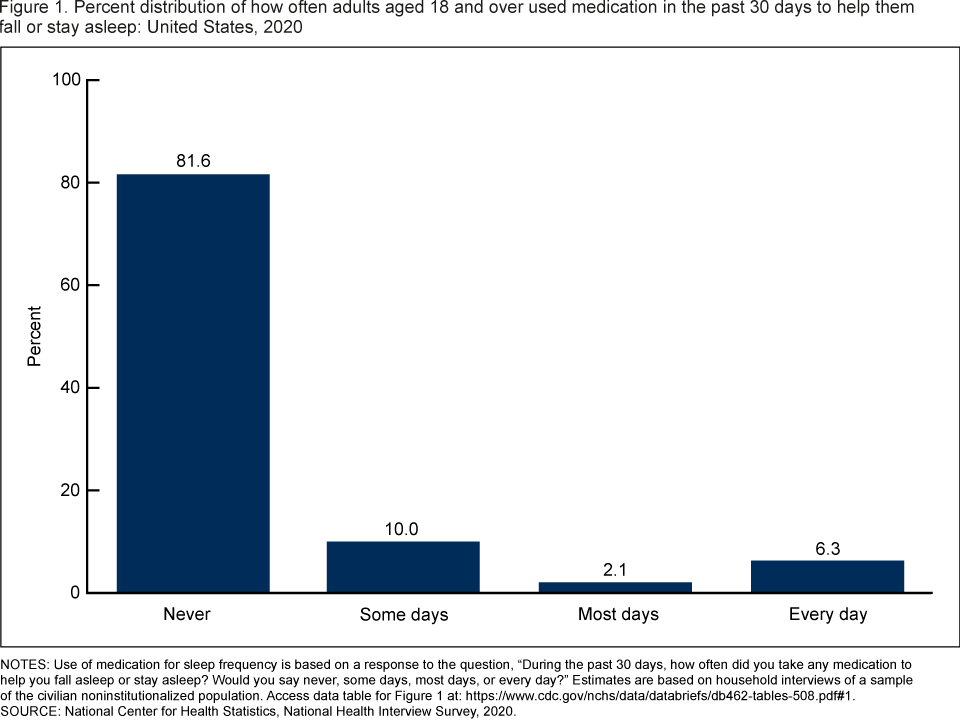
NOTES: Use of medication for sleep frequency is based on a response to the question, “During the past 30 days, how often did you take any medication to help you fall asleep or stay asleep? Would you say never, some days, most days, or every day?” Estimates are based on household interviews of a sample of the civilian noninstitutionalized population. Access data table for Figure 1.
SOURCE: National Center for Health Statistics, National Health Interview Survey, 2020.
Did the percentage of adults who took sleep medication vary by sex and age group?
- In 2020, the percentage of adults who took medication for sleep increased with age, from 5.6% of those aged 18–44, to 10.1% of those aged 45–64, and 11.9% of those aged 65 and over (Figure 2).
- Among men, the percentage who took medication for sleep also increased with increasing age, from 4.7% of men aged 18–44, to 7.1% of men aged 45–64, to 10.1% of men aged 65 and over. Among women, sleep medication use was less likely among those aged 18–44 (6.5%) than those aged 45–64 (13.0%) and those aged 65 and over (13.5%).
- Men were less likely to take medication for sleep than women across all age groups.
Figure 2. Percentage of adults aged 18 and over who took sleep medication every day or most days in the past 30 days to help them fall or stay asleep, by sex and age group: United States, 2020
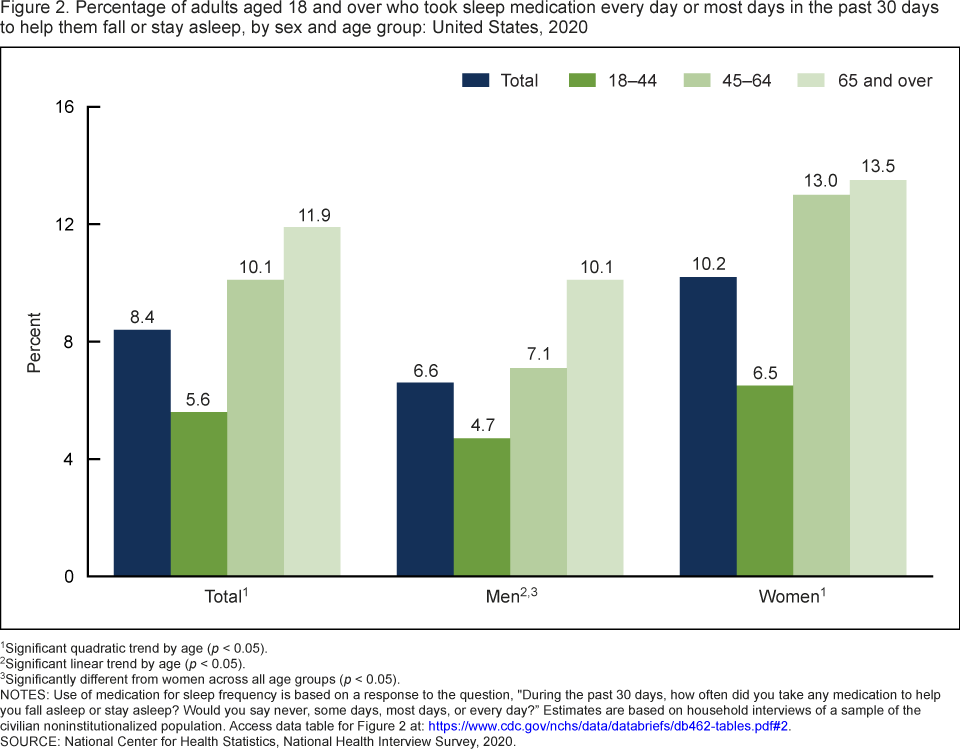
1Significant quadratic trend by age (p < 0.05).
2Significant linear trend by age (p < 0.05).
3Significantly different from women across all age groups (p < 0.05).
NOTES: Use of medication for sleep frequency is based on a response to the question, “During the past 30 days, how often did you take any medication to help you fall asleep or stay asleep? Would you say never, some days, most days, or every day?” Estimates are based on household interviews of a sample of the civilian noninstitutionalized population. Access data table for Figure 2.
SOURCE: National Center for Health Statistics, National Health Interview Survey, 2020.
Were differences observed in the percentage of adults who took sleep medication by sex and race and Hispanic origin?
- The percentage of adults who took medication for sleep every day or most days was highest among non-Hispanic White adults (10.4%), followed by non-Hispanic Black (6.1%) and Hispanic (4.6%) adults, and lowest among non-Hispanic Asian adults (2.8%) (Figure 3).
- Among men, non-Hispanic White men (8.0%) were most likely to use sleep medication and non-Hispanic Asian men (1.7%) were least likely.
- Non-Hispanic White women (12.6%) were most likely to take sleep medication and Hispanic women (5.4%) and non-Hispanic Asian women (3.9%) were least likely.
- Across all race and Hispanic-origin groups, men were less likely than women to take sleep medication.
Figure 3. Percentage of adults aged 18 and over who took sleep medication every day or most days in the past 30 days to help them fall or stay asleep, by sex and race and Hispanic origin: United States, 2020
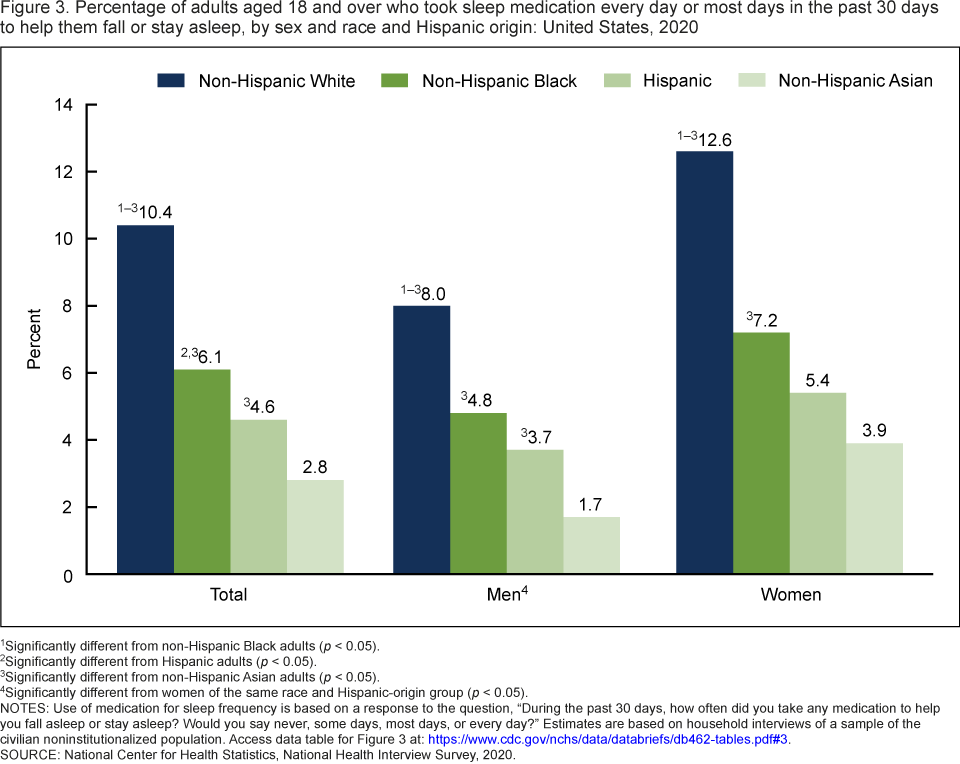
1Significantly different from non-Hispanic Black adults (p < 0.05).
2Significantly different from Hispanic adults (p < 0.05).
3Significantly different from non-Hispanic Asian adults (p < 0.05).
4Significantly different from women of the same race and Hispanic-origin group (p < 0.05).
NOTES: Use of medication for sleep frequency is based on a response to the question, “During the past 30 days, how often did you take any medication to help you fall asleep or stay asleep? Would you say never, some days, most days, or every day?” Estimates are based on household interviews of a sample of the civilian noninstitutionalized population. Access data table for Figure 3.
SOURCE: National Center for Health Statistics, National Health Interview Survey, 2020.
Were differences observed in the percentage of adults who took sleep medication by sex and family income?
- Sleep medication use decreased with increasing family income, from 10.0% among adults with family income less than 100% of the federal poverty level (FPL), to 8.7% of those with family income at 100% to less than 200% of FPL, and 8.2% of those with family income at 200% of FPL or more (Figure 4).
- Among men, those with family income of 200% of FPL or more (6.0%) were less likely to take sleep medication than those with family income less than 100% of FPL (8.3%) and 100% to less than 200% of FPL (8.2%).
- Among women, the observed differences in use of sleep medication among those with family incomes less than 100% of FPL (11.1%), those at 100% to less than 200% of FPL (9.2%), and those at 200% FPL or more (10.3%) were not significant.
- Among adults with family income less than 100% of FPL and those with family income at 200% of FPL or more, men were less likely to take medication for sleep than women.
Figure 4. Percentage of adults aged 18 and over who took sleep medication every day or most days in the past 30 days to help them fall or stay asleep, by sex and family income: United States, 2020
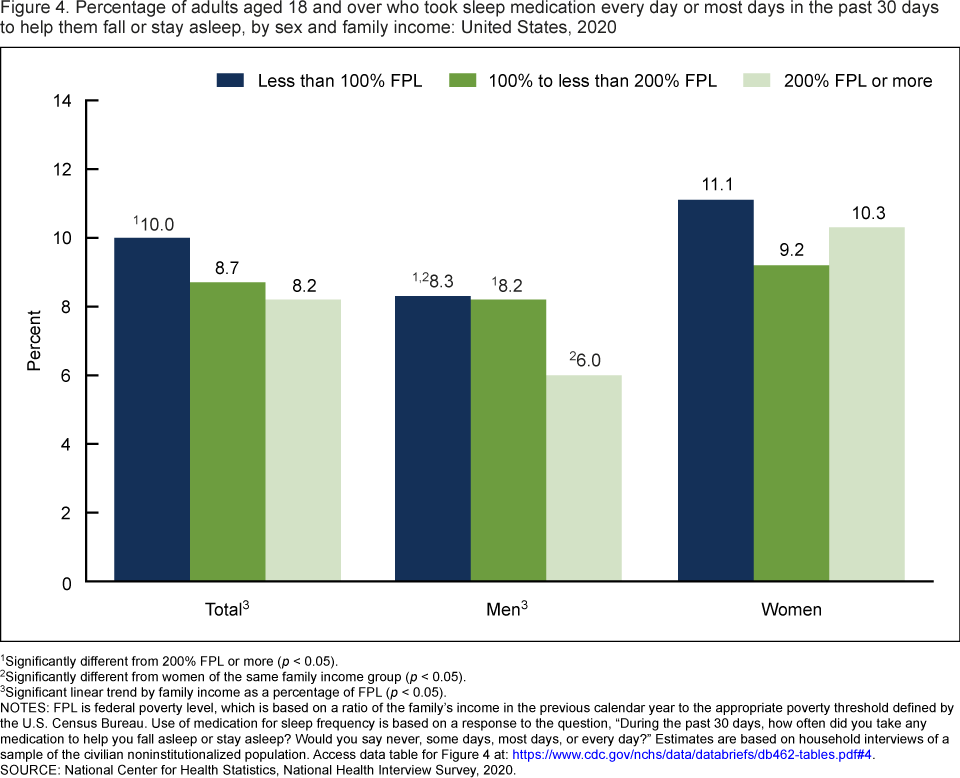
1Significantly different from 200% FPL or more (p < 0.05).
2Significantly different from women of the same family income group (p < 0.05).
3Significant linear trend by family income as a percentage of FPL (p < 0.05).
NOTES: FPL is federal poverty level, which is based on a ratio of the family’s income in the previous calendar year to the appropriate poverty threshold defined by the U.S. Census Bureau. Use of medication for sleep frequency is based on a response to the question, “During the past 30 days, how often did you take any medication to help you fall asleep or stay asleep? Would you say never, some days, most days, or every day?” Estimates are based on household interviews of a sample of the civilian noninstitutionalized population. Access data table for Figure 4.
SOURCE: National Center for Health Statistics, National Health Interview Survey, 2020.
Summary
In 2020, 8.4% of adults used sleep medication every day or most days in the past 30 days to help them fall or stay asleep. In general, a greater percentage of women used sleep medication compared with men across the lifespan, race and Hispanic-origin groups, and family-income groups. Among all adults, sleep medication use increased with increasing age, decreased with increasing income, and was higher among non-Hispanic White adults compared with adults of other race and Hispanic-origin groups. Some variation was observed in the patterns between men and women. Among men, the likelihood of using sleep medication increased with increasing age, while among women, the likelihood of taking sleep medication was the same for those aged 45−64 and those aged 65 and over. Hispanic men were more likely than non-Hispanic Asian men to take sleep medication, while among women, these groups were not different. Among men, those with family income at or above 200% of FPL were less likely to take sleep medication, while among women, no differences were observed across family income levels.
Definitions
Family income as a percentage of FPL: Based on FPL, which was calculated from the family’s income in the previous calendar year and family size using the U.S. Census Bureau’s poverty thresholds (6). Family income was imputed when missing (7).
Race and Hispanic origin: Adults categorized as Hispanic may be of any race or combination of races. Adults categorized as non-Hispanic White, non-Hispanic Black, and non-Hispanic Asian indicated one race only. Estimates for other race and Hispanic-origin groups are not shown due to small sample sizes that would not allow reliable estimates.
Took sleep medication: Based on a response of “most days” or “every day” to the question, “During the past 30 days, how often did you take any medication to help you fall asleep or stay asleep? Include both prescribed and over-the-counter medications.”
Data source and methods
NHIS is a nationally representative household survey of the civilian noninstitutionalized population. It is conducted continuously throughout the year by the National Center for Health Statistics (NCHS). Interviews are typically conducted in respondents’ homes, but follow-ups to complete interviews may be conducted over the telephone. Due to the COVID-19 pandemic, data collection procedures in 2020 were disrupted. From April through June 2020, all interviews were conducted by telephone only, and from July through December 2020, interviews were attempted by telephone first, with follow-ups to complete interviews by personal visit. Questions on sleep, including use of medication for sleep, are on the NHIS rotating core and were most recently asked in 2020. For more information about NHIS, visit https://www.cdc.gov/nchs/nhis.htm.
Point estimates and corresponding variances for this analysis were calculated using SAS-callable SUDAAN software version 11.0 (8) to account for the complex sample design of NHIS. All estimates are based on self-report and meet NCHS data presentation standards for proportions (9). Differences between percentages were evaluated using two-sided significance tests at the 0.05 level. Linear and quadratic trends by age group and family income were evaluated using orthogonal polynomials in logistic regression.
About the authors
Cynthia Reuben and Nazik Elgaddal are with the NCHS Division of Analysis and Epidemiology. Lindsey I. Black is with the NCHS Division of Health Interview Statistics.
References
- American Academy of Sleep Medicine. Taking sleep medications for insomnia. 2019.
- Centers for Disease Control and Prevention. Sleep and sleep disorders. 2022.
- Chong Y, Fryar CD, Gu Q. Prescription sleep aid use among adults: United States, 2005–2010. NCHS Data Brief, no 127. Hyattsville, MD: National Center for Health Statistics. 2013.
- Adjaye-Gbewonyo D, Ng AE, Black LI. Sleep difficulties in adults: United States, 2020. NCHS Data Brief, no 436. Hyattsville, MD: National Center for Health Statistics. 2022. DOI: https://dx.doi.org/10.15620/cdc:117490.
- Nugent CN, Black LI. Sleep duration, quality of sleep, and use of sleep medication, by sex and family type, 2013–2014. NCHS Data Brief, no 230. Hyattsville, MD: National Center for Health Statistics. 2016.
- U.S. Census Bureau. Poverty thresholds.
- National Center for Health Statistics. Multiple imputation of family income in 2020 National Health Interview Survey: Methods. 2021.
- RTI International. SUDAAN (Release 11.0.3) [computer software]. 2018.
- Parker JD, Talih M, Malec DJ, Beresovsky V, Carroll M, Gonzalez Jr JF, et al. National Center for Health Statistics data presentation standards for proportions. National Center for Health Statistics. Vital Health Stat 2(175). 2017.
Suggested citation
Reuben C, Elgaddal N, Black LI. Sleep medication use in adults aged 18 and over: United States, 2020. NCHS Data Brief, no 462. Hyattsville, MD: National Center for Health Statistics. 2023. DOI: https://dx.doi.org/10.15620/cdc:123013.
Copyright information
All material appearing in this report is in the public domain and may be reproduced or copied without permission; citation as to source, however, is appreciated.
National Center for Health Statistics
Brian C. Moyer, Ph.D., Director
Amy M. Branum, Ph.D., Associate Director for Science
Division of Analysis and Epidemiology
Irma E. Arispe, Ph.D., Director
Julie D. Weeks, Ph.D., Acting Associate Director for Science
Division of Health Interview Statistics
Steven J. Blumberg, Ph.D., Director
Anjel Vahratian, Ph.D., M.P.H., Associate Director for Science