Opioids Prescribed to Adults at Discharge From Emergency Departments: United States, 2017–2020
NCHS Data Brief No. 461, January 2023 |PDF (437 KB)
- Key findings
- Did the rate of ED visits with an opioid prescribed at discharge change between 2017–2018 and 2019–2020?
- Did the percentage of ED visits with opioids prescribed at discharge change by race and ethnicity between 2017–2018 and 2019–2020?
- Did the percentage of ED visits with opioids prescribed at discharge change by primary expected payment source between 2017–2018 and 2019–2020?
- Summary
Data from the National Hospital Ambulatory Medical Care Survey
- In 2019–2020, opioids were prescribed at discharge at 36.4 emergency department (ED) visits per 1,000 adults, compared with 50.5 ED visits in 2017–2018.
- The rate of ED visits with an opioid prescribed at discharge was lower in 2019–2020 than in 2017–2018 for both men and women.
- The percentage of ED visits with an opioid prescribed at discharge decreased from 12.2% in 2017–2018 to 8.1% in 2019–2020.
- The percentage of ED visits with an opioid prescribed at discharge decreased in 2019–2020 among non-Hispanic White and non-Hispanic Black people compared with 2017–2018.
Opioids may be an effective treatment for chronic and acute pain when properly used (1). However, receiving an opioid prescription in the emergency department (ED) has been identified as a potential risk factor for long-term use (2). Between 2010–2011 and 2016–2017, the percentage of opioids prescribed at ED discharge decreased from 21.5% to 14.6% (3,4). This report provides more recent changes in rates and percentages of opioids prescribed to adults (aged 18 and over) at discharge from the ED by patient and visit characteristics through 2020, using data from the National Hospital Ambulatory Medical Care Survey (NHAMCS).
Keywords: Emergency care, narcotics, National Hospital Ambulatory Medical Care Survey
Did the rate of ED visits with an opioid prescribed at discharge change between 2017–2018 and 2019–2020?
- In 2019–2020, opioids were prescribed at discharge at 36.4 ED visits per 1,000 adults, which was lower than the 2017–2018 rate (50.5) (Figure 1).
- In 2019–2020, opioids were prescribed at discharge at 39.9 ED visits per 1,000 women and 32.6 ED visits per 1,000 men, both lower than the 56.6 and 43.9 ED visits for women and men, respectively, in 2017–2018.
- The rate of ED visits with opioids prescribed at discharge was higher for women (56.6 per 1,000 women) than men (43.9) in 2017–2018, but the observed difference in rates by sex for 2019–2020 was not significant.
Figure 1. Rate of emergency department visits by adults with opioids prescribed at discharge, by sex: United States, 2017–2020
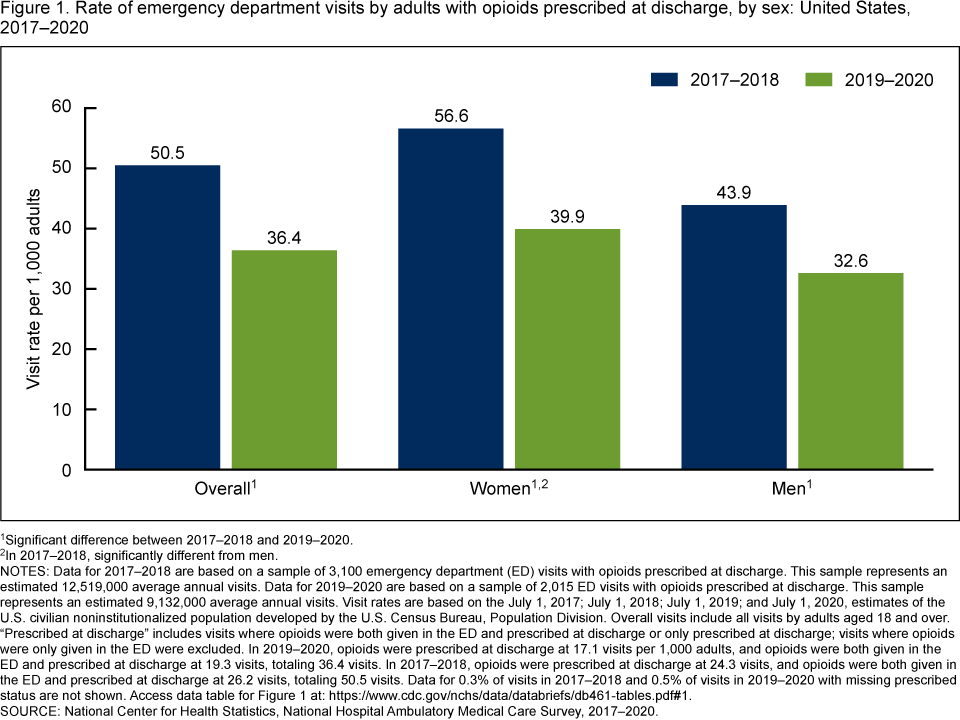
1Significant difference between 2017–2018 and 2019–2020.
2In 2017–2018, significantly different from men.
NOTES: Data for 2017–2018 are based on a sample of 3,100 emergency department (ED) visits with opioids prescribed at discharge. This sample represents an estimated 12,519,000 average annual visits. Data for 2019–2020 are based on a sample of 2,015 ED visits with opioids prescribed at discharge. This sample represents an estimated 9,132,000 average annual visits. Visit rates are based on the July 1, 2017; July 1, 2018; July 1, 2019; and July 1, 2020, estimates of the U.S. civilian noninstitutionalized population developed by the U.S. Census Bureau, Population Division. Overall visits include all visits by adults aged 18 and over. “Prescribed at discharge” includes visits where opioids were both given in the ED and prescribed at discharge or only prescribed at discharge; visits where opioids were only given in the ED were excluded. In 2019–2020, opioids were prescribed at discharge at 17.1 visits per 1,000 adults, and opioids were both given in the ED and prescribed at discharge at 19.3 visits, totaling 36.4 visits. In 2017–2018, opioids were prescribed at discharge at 24.3 visits, and opioids were both given in the ED and prescribed at discharge at 26.2 visits, totaling 50.5 visits. Data for 0.3% of visits in 2017–2018 and 0.5% of visits in 2019–2020 with missing prescribed status are not shown. Access data table for Figure 1.
SOURCE: National Center for Health Statistics, National Hospital Ambulatory Medical Care Survey, 2017–2020.
Did the percentage of ED visits with opioids prescribed at discharge change by race and ethnicity between 2017–2018 and 2019–2020?
- Opioids were prescribed at discharge at 8.1% of ED visits made by adults in 2019–2020, which was lower than the percentage for 2017–2018 (12.2%) (Figure 2).
- The percentage of ED visits with an opioid prescribed at discharge decreased among non-Hispanic White people in 2019–2020 (8.3%) compared with 2017–2018 (12.9%). The percentage also decreased for visits by non-Hispanic Black people during the same period, to 7.2% from 11.1%. The observed decrease among Hispanic people (to 8.9% from 11.8%) was not significant.
- Percentages were similar across all race and ethnicity groups for 2019–2020 and 2017–2018.
Figure 2. Percentage of emergency department visits by adults with opioids prescribed at discharge, by race and ethnicity: United States, 2017–2020
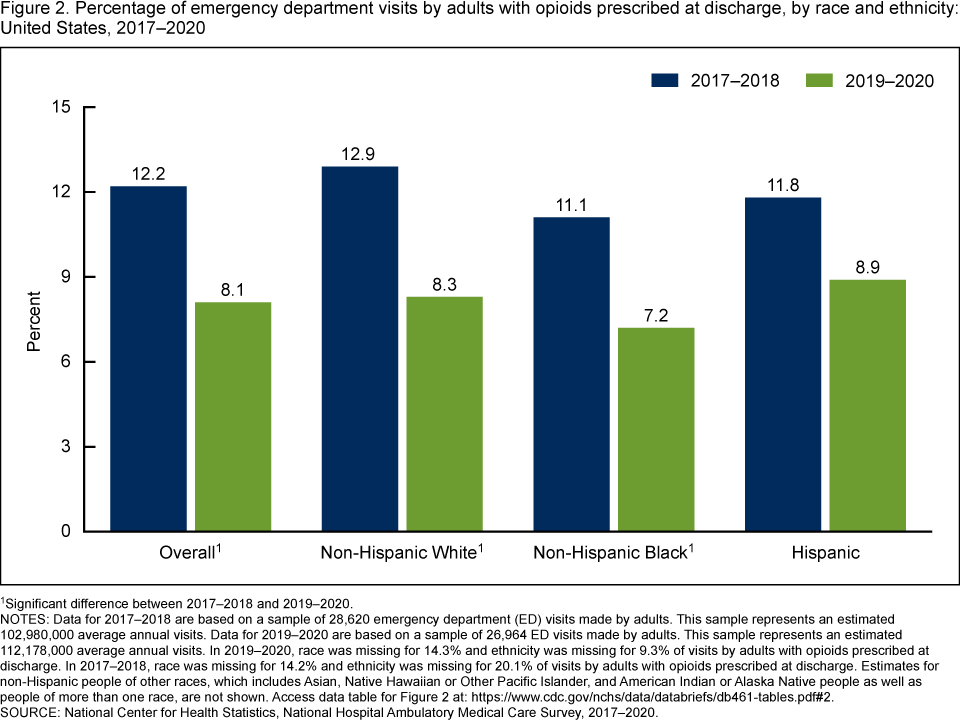
1Significant difference between 2017–2018 and 2019–2020.
NOTES: Data for 2017–2018 are based on a sample of 28,620 emergency department (ED) visits made by adults. This sample represents an estimated 102,980,000 average annual visits. Data for 2019–2020 are based on a sample of 26,964 ED visits made by adults. This sample represents an estimated 112,178,000 average annual visits. In 2019–2020, race was missing for 14.3% and ethnicity was missing for 9.3% of visits by adults with opioids prescribed at discharge. In 2017–2018, race was missing for 14.2% and ethnicity was missing for 20.1% of visits by adults with opioids prescribed at discharge. Estimates for non-Hispanic people of other races, which includes Asian, Native Hawaiian or Other Pacific Islander, and American Indian or Alaska Native people as well as people of more than one race, are not shown. Access data table for Figure 2.
SOURCE: National Center for Health Statistics, National Hospital Ambulatory Medical Care Survey, 2017–2020.
Did the percentage of ED visits with opioids prescribed at discharge change by primary expected payment source between 2017–2018 and 2019–2020?
- The percentage of ED visits with opioids prescribed at discharge decreased in 2019–2020 compared with 2017–2018 across all primary expected sources of payment (Figure 3).
- During 2019–2020, the percentage of ED visits with opioids prescribed at discharge was higher for visits with private insurance (9.4%) compared with those with Medicare (7.1%). Percentages were similar for Medicaid (8.4%) and no insurance (8.5%).
- During 2017–2018, the percentage of ED visits with opioids prescribed at discharge was higher for visits with private insurance (14.5%) and no insurance (14.0%) compared with visits with Medicare (10.5%) and Medicaid (10.8%).
Figure 3. Percentage of emergency department visits by adults with opioids prescribed at discharge, by primary expected source of payment: United States, 2017–2020
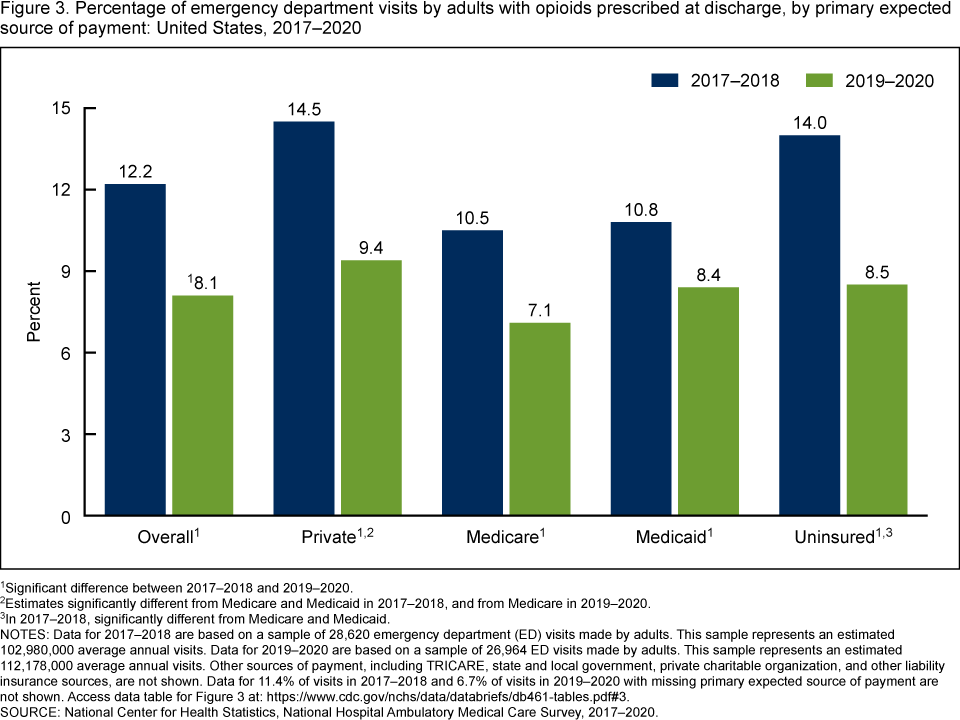
1Significant difference between 2017–2018 and 2019–2020.
2Estimates significantly different from Medicare and Medicaid in 2017–2018, and from Medicare in 2019–2020.
3In 2017–2018, significantly different from Medicare and Medicaid.
NOTES: Data for 2017–2018 are based on a sample of 28,620 emergency department (ED) visits made by adults. This sample represents an estimated 102,980,000 average annual visits. Data for 2019–2020 are based on a sample of 26,964 ED visits made by adults. This sample represents an estimated 112,178,000 average annual visits. Other sources of payment, including TRICARE, state and local government, private charitable organization, and other liability insurance sources, are not shown. Data for 11.4% of visits in 2017–2018 and 6.7% of visits in 2019–2020 with missing primary expected source of payment are not shown. Access data table for Figure 3.
SOURCE: National Center for Health Statistics, National Hospital Ambulatory Medical Care Survey, 2017–2020.
Summary
This report examines changes in rates and percentages of ED visits made by adults where opioids were prescribed at discharge.
In 2019–2020, the rate of ED visits with opioids prescribed at discharge decreased overall and among women and men compared with 2017–2018.
The percentage of ED visits with opioids prescribed at discharge decreased in 2019–2020 among all adults, among non-Hispanic White and non-Hispanic Black adults, and among visits according to all primary expected sources of payment compared with 2017–2018.
This report, based on the most recent estimates from NHAMCS on ED visits made by adults with opioids prescribed at discharge, shows a continued decreasing trend in opioid prescription patterns within the ED setting.
Definitions
ED visit rate: Calculated by dividing the number of 2017–2020 ED visits by adults with at least one opioid prescribed at discharge by the July 1, 2017; July 1, 2018; July 1, 2019; and July 1, 2020, estimates of the U.S. civilian noninstitutionalized population for each demographic group, as obtained from the U.S. Census Bureau’s Population Division.
Emergency department (ED) visits with opioids prescribed at discharge: Opioids were defined using the Cerner Multum third-level therapeutic category codes for narcotic analgesics (code 60) and narcotic analgesic combinations (code 191). Buprenorphine, buprenorphine-naloxone, and antitussive formulations containing opioids were not included. If any opioid mention in the visit record had the designation of “prescribed at discharge” or “both given in emergency department (ED) and prescribed at discharge,” then that opioid was classified as an opioid prescribed at discharge. The unit of measurement is any opioid mention in the visit record.
Primary expected source of payment: During data collection, all sources of payment were collected. For patients with more than one source of payment, the following hierarchy is used, with Medicare counted first and self-pay and no charge counted last, to collapse payments into one mutually exclusive variable of primary expected source of payment.
- Medicare: Partial or full payment by Medicare plan includes payments made directly to the hospital as well as payments reimbursed to the patient. Charges covered under a Medicare-sponsored prepaid plan are included.
- Medicaid: Partial or full payment by a Medicaid plan includes payments made directly to the hospital or reimbursed to the patient. Charges covered under a Medicaid-sponsored prepaid plan (health maintenance organization) or “managed Medicaid” are included.
- Private: Partial or full payment by a private insurer (as in BlueCross BlueShield), either directly to the hospital or reimbursed to the patient. Charges covered under a private insurance-sponsored prepaid plan are included.
- Uninsured: Includes self-pay, no charge or charity. Self-pay are charges paid by the patient or patient’s family that will not be reimbursed by a third party. Self-pay includes visits for which the patient is expected to be ultimately responsible for most of the bill, even if the patient never actually pays it. Copayments and deductibles are excluded. No charge or charity are visits for which no fee is charged, such as charity, special research, or teaching.
Data source and methods
Data for this report are from NHAMCS, an annual, nationally representative survey of nonfederal, general, and short-stay hospitals. NHAMCS uses a multistage probability design with samples of geographic primary sampling units (PSUs), hospitals within PSUs, and patient visits within EDs. Additional information on the methodology of NHAMCS has been described previously (5–8). This report presents results combining data for 2017–2018 and 2019–2020 to enable more detailed subgroup analyses. Estimates of the weighted number of visits are based on 2-year annual averages. Data analyses were performed using the statistical packages SAS version 9.4 (SAS Institute, Cary, N.C.) and SAS-callable SUDAAN version 11.0 (RTI International, Research Triangle Park, N.C.). All percentage estimates presented meet National Center for Health Statistics guidelines for presentation of proportions (9). Differences between groups were evaluated using a two-sided significance test at the 0.05 level.
About the authors
Loredana Santo and Susan M. Schappert are with the National Center for Health Statistics, Division of Health Care Statistics.
References
- O’Hehir RE, Holgate ST, Sheikh A, eds. Middleton’s allergy essentials. 1st ed. Elsevier. 2017.
Sampson HA, Aceves S, Bock SA, James J, Jones S, Lang D, et al. Food allergy: A practice parameter update—2014. J Allergy Clin Immunol 134(5):1016–25.e43. 2014. DOI: https://dx.doi.org/10.1016/j.jaci.2014.05.013. - Seidman MD, Gurgel RK, Lin SY, Schwartz SR, Baroody FM, Bonner JR, et al. Clinical practice guideline: Allergic rhinitis. Otolaryngol Head Neck Surg 152(1 Suppl):S1–43. 2015. DOI: https://dx.doi.org/10.1177/0194599814561600.
- Warren CM, Otto AK, Walkner MM, Gupta RS. Quality of life among food allergic patients and their caregivers. Curr Allergy Asthma Rep 16(5):38. 2016. DOI: https://doi.org/10.1007/s11882-016-0614-9.
- Baiardini I, Braido F, Brandi S, Canonica GW. Allergic diseases and their impact on quality of life. Ann Allergy Asthma Immunol 97(4):419–28; quiz 429–30, 476. 2006. DOI: https://dx.doi.org/10.1016/S1081-1206(10)60928-3.
- Asthma and Allergy Foundation of America. What is an allergy?
- National Center for Health Statistics. National Health Interview Survey: 2021 survey description. 2022.
- RTI International. SUDAAN (Release 11.0.3) [computer software]. 2018.
- Parker JD, Talih M, Malec DJ, Beresovsky V, Carroll M, Gonzalez JF Jr, et al. National Center for Health Statistics data presentation standards for proportions. National Center for Health Statistics. Vital Health Stat 2(175). 2017.
Suggested citation
Santo L, Schappert SM. Opioids prescribed to adults at discharge from emergency departments: United States, 2017–2020. NCHS Data Brief, no 461. Hyattsville, MD: National Center for Health Statistics. 2022. DOI: https://dx.doi.org/10.15620/cdc:122879.
Copyright information
All material appearing in this report is in the public domain and may be reproduced or copied without permission; citation as to source, however, is appreciated.
National Center for Health Statistics
Brian C. Moyer, Ph.D., Director
Amy M. Branum, Ph.D., Associate Director for Science
Division of Health Care Statistics
Carol J. DeFrances, Ph.D., Acting Director
Alexander Strashny, Ph.D., Associate Director for Science