Diagnosed Allergic Conditions in Adults: United States, 2021
NCHS Data Brief No. 460, January 2023
PDF Version (637 KB) | Visual Abstract
- Key findings
- Nearly one-third of adults aged 18 and over had a seasonal allergy, eczema, or food allergy.
- The prevalence of seasonal allergies varied by sex, age, and race and Hispanic origin.
- The percentage of adults with diagnosed eczema varied by sex, age, and race and Hispanic origin.
- The prevalence of food allergies was highest in women, adults aged 18–44, and non-Hispanic Black adults.
- Summary
Data from the National Health Interview Survey
- In 2021, 25.7% of adults had a seasonal allergy, 7.3% had eczema, and 6.2% had a food allergy.
- The percentage of adults with a seasonal allergy was higher in non-Hispanic White adults compared with Hispanic, non-Hispanic Black, and non-Hispanic Asian adults.
- Women (8.9%) were more likely to have eczema compared with men (5.7%).
- The prevalence of food allergy decreased with increasing age.
An allergy occurs when an individual’s immune system misclassifies typically harmless substances as harmful and has a specific and reproducible immune response (1,2). The severity of allergy symptoms can range from itchy, watery eyes and hives to life-threatening anaphylaxis, and the presence of allergies can negatively impact an individual’s quality of life (3–6). This report uses 2021 National Health Interview Survey (NHIS) data to describe the prevalence of seasonal allergies, eczema, and food allergies in adults in the United States.
Keywords: seasonal allergies, hay fever, eczema, atopic dermatitis, allergic rhinitis, National Health Interview Survey (NHIS)
Nearly one-third of adults aged 18 and over had a seasonal allergy, eczema, or food allergy.
- In 2021, 31.8% of adults had a seasonal allergy, eczema, or food allergy (Figure 1).
- About one-quarter (25.7%) of adults had a seasonal allergy, 7.3% had eczema, and 6.2% had a food allergy.
Figure 1. Percentage of adults with a diagnosed seasonal allergy, eczema, food allergy, or any allergic condition: United States, 2021
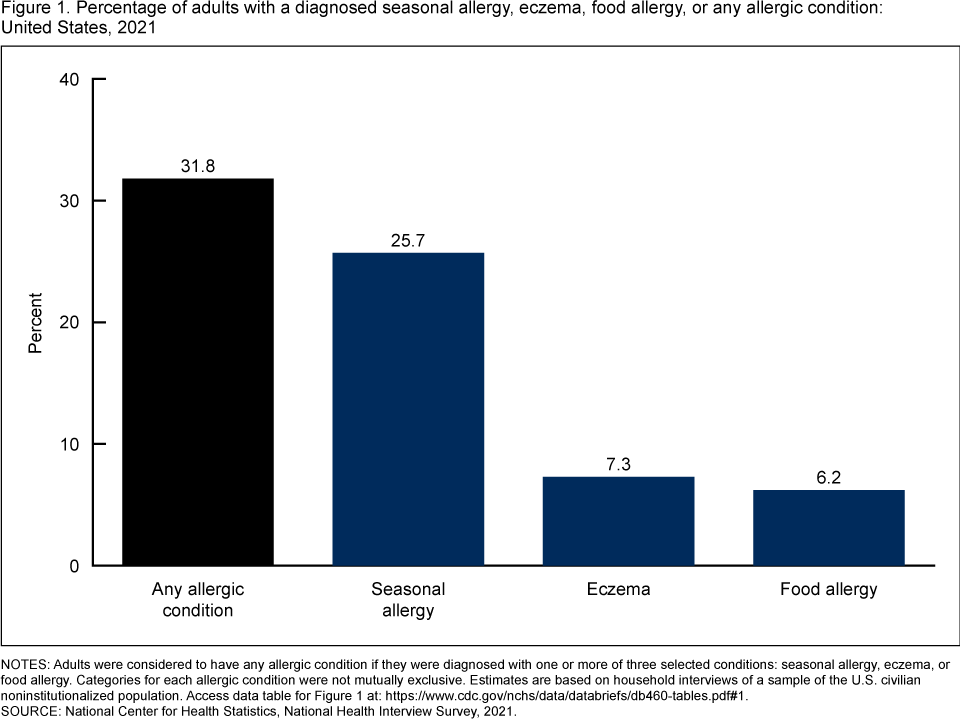
NOTES: Adults were considered to have any allergic condition if they were diagnosed with one or more of three selected conditions: seasonal allergy, eczema, or food allergy. Categories for each allergic condition were not mutually exclusive. Estimates are based on household interviews of a sample of the U.S. civilian noninstitutionalized population. Access data table for Figure 1.
SOURCE: National Center for Health Statistics, National Health Interview Survey, 2021.
The prevalence of seasonal allergies varied by sex, age, and race and Hispanic origin.
- Women (29.9%) were more likely to have a seasonal allergy compared with men (21.1%) (Figure 2).
- About one-quarter (24.7%) of adults aged 18–44, 27.9% of adults aged 45–64, 26.4% of adults aged 65–74, and 21.7% of adults aged 75 and over had a seasonal allergy in 2021.
- Non-Hispanic White adults (28.4%) were more likely to have a seasonal allergy compared with non-Hispanic Black (24.0%), Hispanic (18.8%), and non-Hispanic Asian (17.0%) adults.
- Non-Hispanic Black adults were more likely to have a seasonal allergy than Hispanic and non-Hispanic Asian adults.
Figure 2. Percentage of adults with a diagnosed seasonal allergy, by sex, age group, and race and Hispanic origin:
United States, 2021
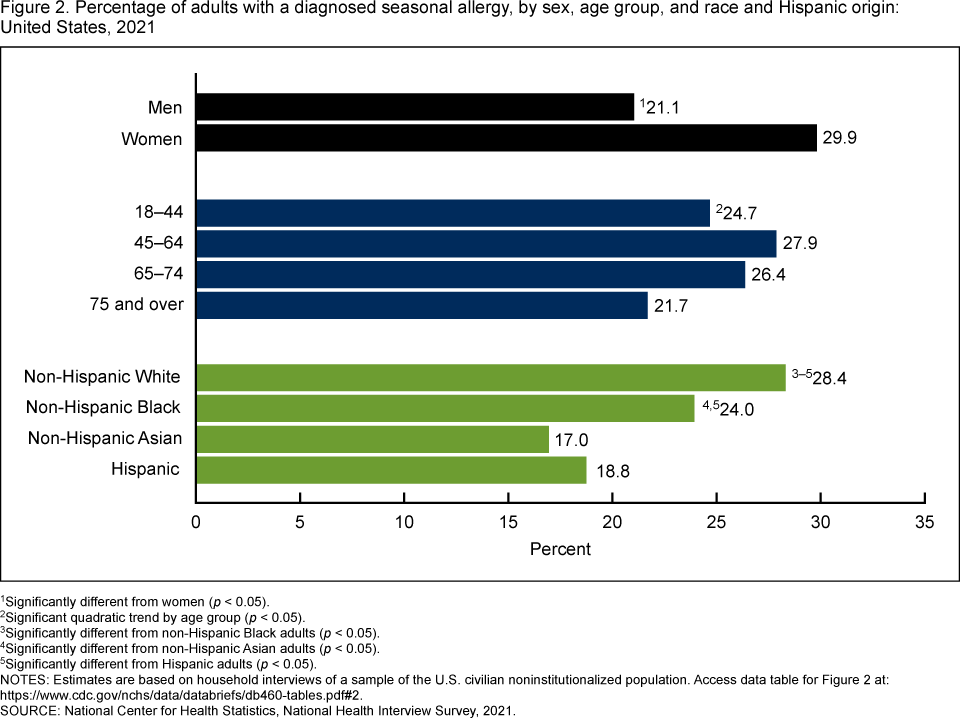
1Significantly different from women (p < 0.05).
2Significant quadratic trend by age group (p < 0.05).
3Significantly different from non-Hispanic Black adults (p < 0.05).
4Significantly different from non-Hispanic Asian adults (p < 0.05).
5Significantly different from Hispanic adults (p < 0.05).
NOTES: Estimates are based on household interviews of a sample of the U.S. civilian noninstitutionalized population. Access data table for Figure 2.
SOURCE: National Center for Health Statistics, National Health Interview Survey, 2021.
The percentage of adults with diagnosed eczema varied by sex, age, and race and Hispanic origin.
- The percentage of adults with eczema was higher in women (8.9%) compared with men (5.7%) (Figure 3).
- The percentage of adults with eczema decreased from 8.4% in adults aged 18–44 to 6.5% in adults aged 45–64, 6.8% in adults aged 65–74, and 5.5% in adults aged 75 and over.
- Hispanic adults (4.8%) were less likely to have eczema compared with non-Hispanic White (7.7%), non-Hispanic Black (8.6%), and non-Hispanic Asian (6.5%) adults.
- Non-Hispanic Black adults were more likely to have eczema than non-Hispanic Asian adults, but the difference compared with non-Hispanic White adults was not significant.
Figure 3. Percentage of adults with eczema, by sex, age group, and race and Hispanic origin: United States, 2021
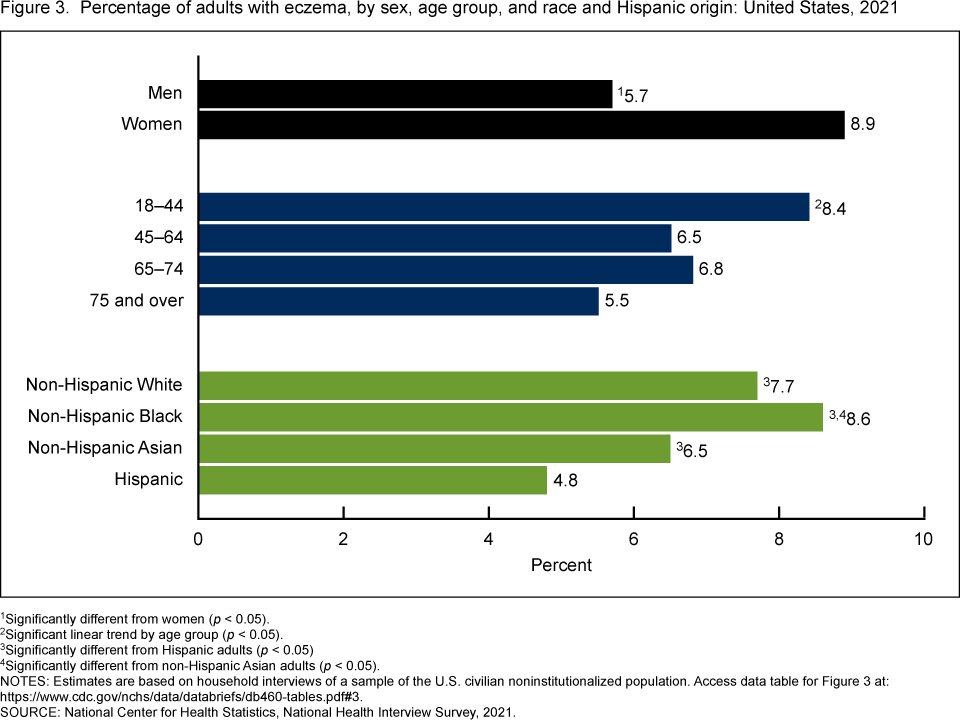
1Significantly different from women (p < 0.05).
2Significant linear trend by age group (p < 0.05).
3Significantly different from Hispanic adults (p < 0.05).
4Significantly different from non-Hispanic Asian adults (p < 0.05).
NOTES: Estimates are based on household interviews of a sample of the U.S. civilian noninstitutionalized population. Access data table for Figure 3.
SOURCE: National Center for Health Statistics, National Health Interview Survey, 2021.
The prevalence of food allergies was highest in women, adults aged 18–44, and non-Hispanic Black adults.
- Women (7.8%) were more likely to have a food allergy compared with men (4.6%) (Figure 4).
- The percentage of adults with a food allergy decreased with increasing age, from 6.6% in adults aged 18–44 to 6.7% in adults aged 45–64, 5.1% in adults aged 65–74, and 4.5% in adults aged 75 and over.
- Non-Hispanic Black adults (8.5%) were more likely to have a food allergy compared with Hispanic (4.4%), non-Hispanic White (6.2%), and non-Hispanic Asian (4.5%) adults.
- Non-Hispanic White adults were more likely to have a food allergy than Hispanic and non-Hispanic Asian adults.
Figure 4. Percentage of adults with a diagnosed food allergy, by sex, age group, and race and Hispanic origin: United States, 2021
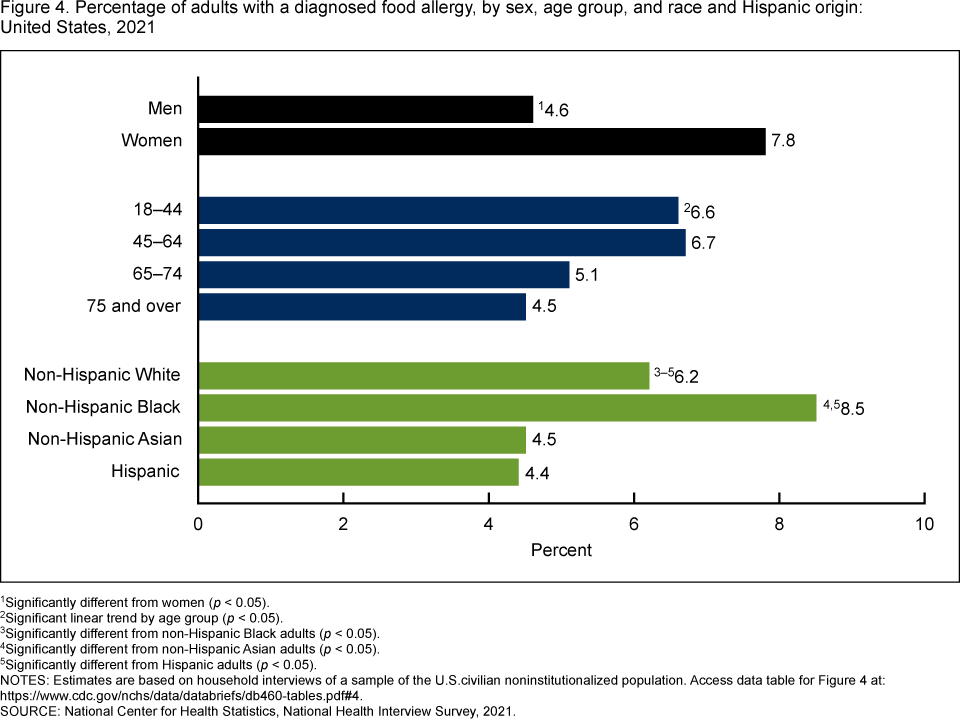
1Significantly different from women (p < 0.05).
2Significant linear trend by age group (p < 0.05).
3Significantly different from non-Hispanic Black adults (p < 0.05).
4Significantly different from non-Hispanic Asian adults (p < 0.05).
5Significantly different from Hispanic adults (p < 0.05).
NOTES: Estimates are based on household interviews of a sample of the U.S. civilian noninstitutionalized population. Access data table for Figure 4.
SOURCE: National Center for Health Statistics, National Health Interview Survey, 2021.
Summary
In 2021, nearly one-third of adults aged 18 and over had a diagnosed seasonal allergy, eczema, or food allergy. Overall, seasonal allergy was the most common of the three allergies, with about one-quarter (25.7%) of adults having a diagnosed seasonal allergy, followed by eczema (7.3%) and food allergy (6.2%). For all three allergies, women were more likely than men to have a diagnosed allergy. The prevalence of diagnosed eczema and food allergy generally decreased with increasing age, while the prevalence of a diagnosed seasonal allergy was 24.7% in adults aged 18–44, 27.9% in adults aged 45–64, 26.4% in adults aged 65–74, and 21.7% in adults aged 75 and over. The prevalence of diagnosed seasonal allergies was highest in non-Hispanic White adults, whereas the prevalence of diagnosed eczema and food allergies was highest in non-Hispanic Black adults. Hispanic adults were less likely to have diagnosed seasonal allergies, eczema, and food allergies than non-Hispanic White and non-Hispanic Black adults.
Definitions
Diagnosed allergic conditions: Adults were considered to have any allergic condition if they were diagnosed with one or more of three selected conditions: seasonal allergy, eczema, or food allergy.
- Eczema: Based on an affirmative response to both survey questions: “Does [Sample Adult] get an itchy rash due to eczema or atopic dermatitis?” and “Have you ever been told by a doctor or other health professional that [Sample Adult] had eczema or atopic dermatitis?”
- Food allergy: Based on an affirmative response to both survey questions: “Does [Sample Adult] have an allergy to one or more foods?” and “Have you ever been told by a doctor or other health professional that [Sample Adult] had an allergy to one or more foods?”
- Seasonal allergy: Based on an affirmative response to both survey questions: “Does [Sample Adult] get symptoms such as sneezing, runny nose, or itchy or watery eyes due to hay fever, seasonal, or year-round allergies?” and “Have you ever been told by a doctor or other health professional that [Sample Adult] had hay fever, seasonal, or year-round allergies?”
Race and Hispanic origin: Adults categorized as Hispanic may be of any race or combination of races. Categories shown for non-Hispanic adults are for those who selected only one racial group; respondents had the option to select more than one racial group. Estimates for non-Hispanic adults of races other than non-Hispanic White, non-Hispanic Black, or non-Hispanic Asian, and those of multiple races, are not shown but are included in total estimates. Analyses were limited to the race and Hispanic-origin groups for which data were reliable and sufficiently powered for group comparisons.
Data source and methods
Data from the 2021 NHIS were used for this analysis. NHIS is a nationally representative household survey of the U.S. civilian noninstitutionalized population. It is conducted continuously throughout the year by the National Center for Health Statistics (NCHS). Interviews are typically conducted in respondents’ homes, but follow-ups to complete interviews may be conducted over the telephone. Because of the COVID-19 pandemic, interviewing procedures were disrupted, and during 2021, 62.8% of Sample Adult interviews were conducted at least partially by telephone (7). For more information about NHIS, visit https://www.cdc.gov/nchs/nhis.htm.
Point estimates and the corresponding confidence intervals were calculated using SAS-callable SUDAAN software (8). All estimates meet NCHS data presentation standards for proportions (9). Differences between percentages were evaluated using two-sided significance tests at the 0.05 level. Linear and quadratic trends by age group were evaluated using orthogonal polynomials.
About the authors
Amanda E. Ng and Peter Boersma are with the National Center for Health Statistics, Division of Health Interview Statistics.
References
- O’Hehir RE, Holgate ST, Sheikh A, eds. Middleton’s allergy essentials. 1st ed. Elsevier. 2017.
- Sampson HA, Aceves S, Bock SA, James J, Jones S, Lang D, et al. Food allergy: A practice parameter update—2014. J Allergy Clin Immunol 134(5):1016–25.e43. 2014. DOI: https://dx.doi.org/10.1016/j.jaci.2014.05.013.
- Seidman MD, Gurgel RK, Lin SY, Schwartz SR, Baroody FM, Bonner JR, et al. Clinical practice guideline: Allergic rhinitis. Otolaryngol Head Neck Surg 152(1 Suppl):S1–43. 2015. DOI: https://dx.doi.org/10.1177/0194599814561600.
- Warren CM, Otto AK, Walkner MM, Gupta RS. Quality of life among food allergic patients and their caregivers. Curr Allergy Asthma Rep 16(5):38. 2016. DOI: https://doi.org/10.1007/s11882-016-0614-9.
- Baiardini I, Braido F, Brandi S, Canonica GW. Allergic diseases and their impact on quality of life. Ann Allergy Asthma Immunol 97(4):419–28; quiz 429–30, 476. 2006. DOI: https://dx.doi. org/10.1016/S1081-1206(10)60928-3.
- Asthma and Allergy Foundation of America. What is an allergy?
- National Center for Health Statistics. National Health Interview Survey: 2021 survey description. 2022.
- RTI International. SUDAAN (Release 11.0.3) [computer software]. 2018.
- Parker JD, Talih M, Malec DJ, Beresovsky V, Carroll M, Gonzalez Jr JF, et al. National Center for Health Statistics data presentation standards for proportions. National Center for Health Statistics. Vital Health Stat 2(175). 2017.
Suggested citation
Ng AE, Boersma P. Diagnosed allergic conditions in adults: United States, 2021. NCHS Data Brief, no 460. Hyattsville, MD: National Center for Health Statistics. 2023. DOI: https://dx.doi.org/10.15620/cdc:122809.
Copyright information
All material appearing in this report is in the public domain and may be reproduced or copied without permission; citation as to source, however, is appreciated.
National Center for Health Statistics
Brian C. Moyer, Ph.D., Director
Amy M. Branum, Ph.D., Associate Director for Science
Division of Health Interview Statistics
Stephen J. Blumberg, Ph.D., Director
Anjel Vahratian, Ph.D., M.P.H., Associate Director for Science